

The DOI matches its Crossref record; 45 of the 45 references it cites were found in a registry or an index.
The Development of a Mobile Monitoring and Feedback Tool to Stimulate Physical Activity of People With a Chronic Disease in Primary Care: A User-Centered Design
Open accessAbstract
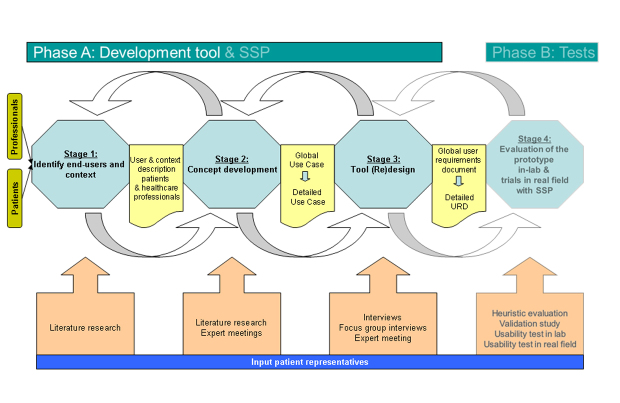
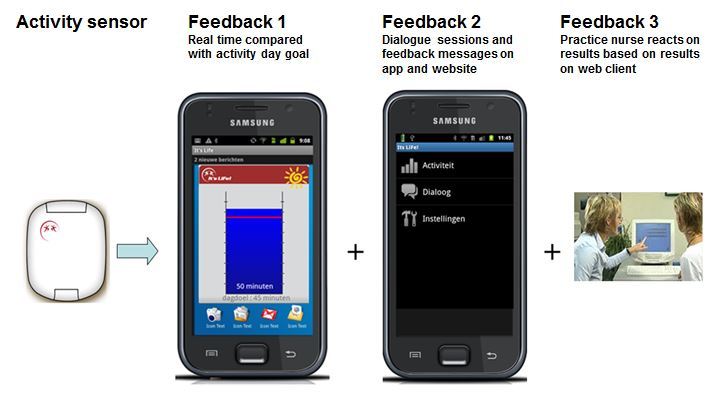
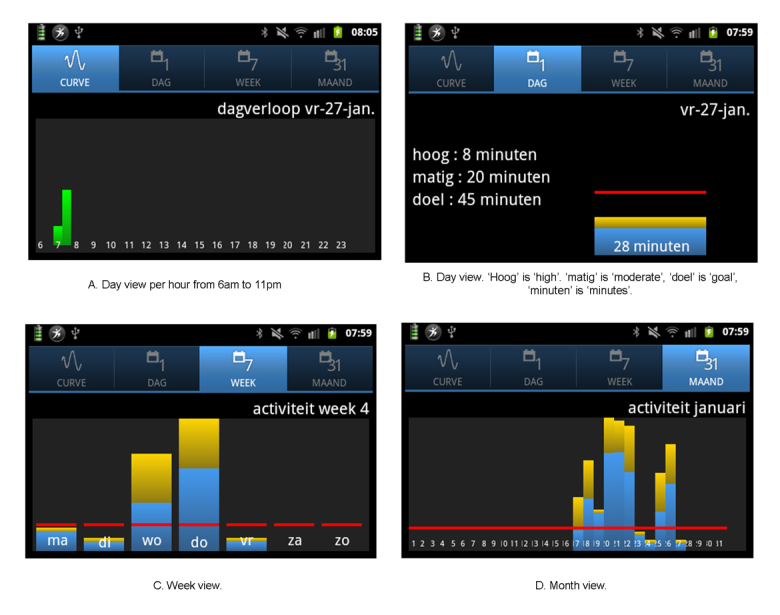
BACKGROUND: Physical activity is an important aspect in the treatment of patients with chronic obstructive pulmonary disease or type-2 diabetes. A monitoring and feedback tool combined with guidance by a primary care provider might be a successful method to enhance the level of physical activity in these patients. As a prerequisite for useful technology, it is important to involve the end-users in the design process from an early stage. OBJECTIVE: The aim of this study was to investigate the user requirements for a tool to stimulate physical activity, embedded in primary care practice. The leading principle of this tool is to change behavior by self-monitoring, goal-setting, and feedback. METHODS: The research team collected qualitative data among 15 patients, 16 care professionals, and several experts. A prototype was developed in three stages. In stage 1, the literature was searched to identify end-users and context. In stage 2, the literature, experts and patient representatives were consulted to set up a use case with the general idea of the innovation. In stage 3, individual interviews and focus groups were held to identify the end-user requirements. Based on these requirements a prototype was built by the engineering team. RESULTS: The development process has led to a tool that generally meets the requirements of the end-users. A tri-axial activity sensor, worn on the hip, is connected by Bluetooth to a smartphone. In an app, quantitative feedback is given about the amount of activity and goals reached by means of graphical visualization, and an image shows a sun when the goal is reached. Overviews about activity per half an hour, per day, week, and month are provided. In the menu of the app and on a secured website, patients can enter information in individual sessions or read feedback messages generated by the system. The practice nurse can see the results of all patients on a secure webpage and can then discuss the results and set personalized goals in consultation with the patient. CONCLUSIONS: This study demonstrates that a user-centered approach brings in valuable details (such as the requirements for feedback in activity minutes per day) to improve the fit between the user, technology, and the organization of care, which is important for the usability and acceptability of the tool. The tool embedded in primary care will be evaluated in a randomized controlled trial.
Overview
The claims and statistics of this paper haven’t been checked yet.
Run the check — free, no account needed. It reads the open-access text and checks the sources it cites.
Integrity signals
Registry
Cites
Statistics
Figures
Verification
Claims the paper makes
The claims and statistics of this paper haven’t been checked yet.
Run the check — free, no account needed. It reads the open-access text and checks the sources it cites.
Claims other papers make about this one
Each is checked against this paper’s own text: does it say what the citing paper says it does?
The source backs part of the claim, not all of it — or backs it for a different population, condition or comparison.
In the citing paper
“In this sense, digital wearable devices contribute not only by recording or prompting exercise, but also by embedding behavior regulation into everyday life and supporting the initiation, adjustment, and maintenance of exercise behaviors (14, 15).”
From Behavior change pathways by which digital wearable devices support exercise self-management in type 2 diabetes: a scoping review with machine learning–assisted text mining (2026) · cites this paper as [14]
Experimental — accuracy not yet measuredThe source backs part of the claim, not all of it — or backs it for a different population, condition or comparison.
In the citing paper
“Goal setting also seems central, as devices can translate broad recommendations into specific and feasible targets, such as daily step goals or activity thresholds (14, 17, 21).”
From Behavior change pathways by which digital wearable devices support exercise self-management in type 2 diabetes: a scoping review with machine learning–assisted text mining (2026) · cites this paper as [14]
Experimental — accuracy not yet measuredThe source backs part of the claim, not all of it — or backs it for a different population, condition or comparison.
In the citing paper
“while family involvement, peer comparison, clinician interaction, and remote feedback may broaden the social context of exercise behavior (14, 15, 19).”
From Behavior change pathways by which digital wearable devices support exercise self-management in type 2 diabetes: a scoping review with machine learning–assisted text mining (2026) · cites this paper as [14]
Experimental — accuracy not yet measuredThe source backs part of the claim, not all of it — or backs it for a different population, condition or comparison.
In the citing paper
“Over time, repeated goal attainment and visible progress may strengthen patients' sense of mastery and self-efficacy, thereby facilitating a shift from externally prompted behavior to proactive self-management (14, 17, 20, 25, 26).”
From Behavior change pathways by which digital wearable devices support exercise self-management in type 2 diabetes: a scoping review with machine learning–assisted text mining (2026) · cites this paper as [14]
Experimental — accuracy not yet measuredThe source backs part of the claim, not all of it — or backs it for a different population, condition or comparison.
In the citing paper
“Compared with traditional approaches that rely on recall or paper-based records, digital wearable devices provide continuous and objective tracking of step counts, activity duration, heart rate, and energy expenditure, thereby converting exercise behavior into visible and quantifiable information (14, 16–18).”
From Behavior change pathways by which digital wearable devices support exercise self-management in type 2 diabetes: a scoping review with machine learning–assisted text mining (2026) · cites this paper as [14]
Experimental — accuracy not yet measured
The source backs part of the claim, not all of it — or backs it for a different population, condition or comparison.
In the citing paper
“Features such as individualized goals, progress visualization, reward feedback, family involvement, peer comparison, and clinician interaction may help address these psychological needs (14, 19, 20).”
From Behavior change pathways by which digital wearable devices support exercise self-management in type 2 diabetes: a scoping review with machine learning–assisted text mining (2026) · cites this paper as [14]
Experimental — accuracy not yet measuredThe source backs part of the claim, not all of it — or backs it for a different population, condition or comparison.
In the citing paper
“Self-monitoring, real-time feedback, and goal setting align closely with Social Cognitive Theory and self-regulation perspectives, as digital wearable devices support a closed-loop process of self-observation, comparison with goals, and behavioral adjustment (14, 17, 20, 27).”
From Behavior change pathways by which digital wearable devices support exercise self-management in type 2 diabetes: a scoping review with machine learning–assisted text mining (2026) · cites this paper as [14]
Experimental — accuracy not yet measuredThe cited source says what the claim attributes to it.
In the citing paper
“Such data may strengthen patients' awareness of their behavioral status and provide a basis for behavioral adjustment (14, 17, 19, 20).”
Self-check
Percentages, sums and reported differences re-computed from the paper’s own numbers.
The self-check needs the paper’s full text.
Citations
Cites
Stages and processes of self-change of smoking: Toward an integrative model of change.
Prochaska, J. O., & DiClemente, C. C. (1983) · Journal of Consulting and Clinical Psychology · doi:10.1037/0022-006x.51.3.390 · Cited by 9,098
(2016) · Andalas University Repository (Andalas University) · Cited by 8,424
Nursing Research Generating and Assessing Evidence for Nursing Practice
Timmins, F. (2013) · Nurse Education in Practice · doi:10.1016/j.nepr.2013.04.001 · Cited by 5,510
Implementation intentions: Strong effects of simple plans.
Gollwitzer, P. M. (1999) · American Psychologist · doi:10.1037/0003-066x.54.7.493 · Cited by 5,478
Object Oriented Software Engineering: A Use Case Driven Approach
Jacobson, I. (1992) · CERN Document Server (European Organization for Nuclear Research) · Cited by 2,937
Predicting and Changing Behavior
Fishbein, M., & Ajzen, I. (2011) · doi:10.4324/9780203838020 · Cited by 2,807
A behavior model for persuasive design
Fogg, B. (2009) · Proceedings of the 4th International Conference on Persuasive Technology · doi:10.1145/1541948.1541999 · Cited by 2,328
Using Pedometers to Increase Physical Activity and Improve Health: A Systematic Review
Bravata, D. M., Smith-Spangler, C., Sundaram, V., Gienger, A. L., Lin, N., Lewis, R., Stave, C. D., Olkin, I., & Sirard, J. R. (2007) · JAMA · doi:10.1001/jama.298.19.2296 · Cited by 2,064
Object-oriented software engineering: a use case driven approach
Marshall, L. (1992) · Information and Software Technology · doi:10.1016/0950-5849(92)90126-a · Cited by 1,495
Self-regulation through goal setting
Latham, G. P., & Locke, E. A. (1991) · Organizational Behavior and Human Decision Processes · doi:10.1016/0749-5978(91)90021-k · Cited by 1,373
Research works printed but not linked: 9
- 2010, Global Recommendations on Physical Activity for Health
- Ursum, J, 2011, Summary studies: Care for the chronically ill, the organisation of care, self-management, self-reliance and participation
- Arsand, E, 2008, Stud Health Technol Inform, 136, 113
- Varnfield, M, 2011, Med J Aust, 194, S15
- 1999, ISO 13407: Human-centered design processes for interactive systems
- 2010, Ergonomics of human-system interaction -- Part 210: Human-centred design for interactive systems
- Klasnja, P, 2009, AMIA Annu Symp Proc, 2009, 338
- JafarinaimiNForlizziJHurstAZimmermanJeditorsBreakaway: an ambient display designed to change human behavior2005CHI Conference on factors in computing systems2-7 April 2005Portland, Oregon, USANew YorkACM
- LinJMamykinaLLindtnerSDelajouxGStrubHEncouraging physical activity with an interactive computer game2006The 8th international conference on Ubiquitous Computing17-21 September 2006Orange County, California, USAHeidelbergSpringer-Verlag Berlin
Cited by
Sorted by citations
Items 101–128 of 128
Musselman, K. E., Jervis-Rademeyer, H., & Nezon, E. (2025) · Expert Review of Medical Devices · doi:10.1080/17434440.2025.2517169 · Cited by 2
Development of eHealth Applications Applying the eHix Framework
Gyaltsen-Lohuis, E., Hettinga, M., de Vries, K., Wink, G., Braad, A., Nauta, J. M., & van Alphen, G. (2015) · International Conference on eHealth, Telemedicine, and Social Medicine · Cited by 2
Behboudi, F., Pouralizadeh, M., Yeganeh, M. R., & Khoshrang, H. (2021) · International Journal of Africa Nursing Sciences · doi:10.1016/j.ijans.2021.100313 · Cited by 2
APLICATIVOS MÓVEIS EM SAÚDE E NUTRIÇÃO: UMA VISÃO ABRANGENTE
Terebinto, E., Bohrer, C. T., & Dallepiane, L. B. (2021) · Saúde (Santa Maria) · doi:10.5902/2236583463757 · Cited by 1
Conformity of Diabetes Mobile apps with the Chronic Care Model
Salari, R., Kalhori, S. R. N., Ghazisaeidi, M., & Fatehi, F. (2019) · BMJ Health & Care Informatics · doi:10.1136/bmjhci-2019-000017 · Cited by 1
Bregenzer, A., & Jiménez, P. (2018) · Springer Reference Wirtschaft · doi:10.1007/978-3-658-17975-5_30-1 · Cited by 1
Bregenzer, A., & Jiménez, P. (2021) · Springer eBooks · doi:10.1007/978-3-658-17782-9_30 · Cited by 1
Kip, H. (2021) · doi:10.3990/1.9789036551311 · Cited by 1
Sun, W., Xie, D., Hou, W., Zhang, M., Wang, C., Wang, Z., Yang, H., Xu, G., & Dai, H. (2026) · Frontiers in Public Health · doi:10.3389/fpubh.2026.1871682
Lieffers, J. R. L. (2016) · UWSpace (University of Waterloo)
Technologie om de fysieke activiteit te verhogen
van der Weegen, S., Verwey, R., Spreeuwenberg, M. D., Tange, H. J., van der Weijden, T., & de Witte, L. (2016) · Huisarts en Wetenschap · doi:10.1007/s12445-016-0152-7
F.R.A.M.E - FACIAL REMOTE ACTIVITY MONITORING EYEWEAR
Breedon, P., Watts, P., Cox, G., Szczepura, A. K., Baines, D. L., Johnson, K. L., Venables, V., & Nduka, C. C. (2017) · Nottingham Trent University's Institutional Repository (Nottingham Trent Repository)
Ryobeza, B., Grobbelaar, S. S. S., & Botha, A. (2021) · Research Square · doi:10.21203/rs.3.rs-236496/v1
Pratiwi, P. S. (2021) · Queensland University of Technology · doi:10.5204/thesis.eprints.213213
Meaningful use of activity trackers in healthcare
Ummels, D. (2021) · doi:10.26481/dis.20211001du
Bregenzer, A., & Jiménez, P. (2020) · Springer Reference Wirtschaft · doi:10.1007/978-3-658-17975-5_30-2
Measurement and promotion of physical activity
Berendsen, B. (2016) · Research Publications (Maastricht University) · doi:10.26481/dis.20160624bbb · Cited by 1
Chatterjee, A., Prinz, A., Gerdes, M. W., Martínez, S., Pahari, N., & Meena, Y. K. (2022) · doi:10.2196/preprints.37799
Duan, H., Wang, Z., Ji, Y., Ma, L., Chi, M., Deng, N., & An, J. (2019) · doi:10.2196/preprints.14466
Braake, E. T., Vaseur, R. M. E., Grünloh, C., & Tabak, M. (2024) · Research Square · doi:10.21203/rs.3.rs-3787842/v1
Behavioural Changes Using mHealth: An Experimental Case Study
Mungloo-Dilmohamud, Z., Jodheea-Jutton, A., Khedo, K. K., Cheerkoot-Jalim, S., Nagowah, L., Nagowah, S. D., Peerally, A., & Baichoo, S. (2024) · Lecture notes of the Institute for Computer Sciences, Social Informatics and Telecommunications Engineering · doi:10.1007/978-3-031-60665-6_30
Design Thinking como um habilitador de inovação no setor de saúde.
de Oliveira, M. S. (2024) · Digital Library of Theses and Dissertations (Universidade de São Paulo) · doi:10.11606/t.3.2024.tde-12072024-082206
Spreeuwenberg, M. D. (2013) · doi:10.26481/spe.20250613ms
Technical Validation of COPD Activity Support Monitor- Towards COPD Self-management
Beattie, M. P., Zheng, H., Nugent, C., & McCullagh, P. J. (2014) · Lecture notes in computer science · doi:10.1007/978-3-319-13105-4_12
Villena-Esponera, M. P., Aguilar, H., Jerves-Córdova, C., Molina‐Recio, G., & Caballero, M. (2026) · Digital Health · doi:10.1177/20552076261460352
Masoumy, M., Ahrari, S., Javanbakhtian, R., & Vagharseyyedin, S. A. (2026) · Complementary Therapies in Medicine · doi:10.1016/j.ctim.2026.103462
Metadata
- Authors
- van der Weegen, S., Verwey, R., Spreeuwenberg, M., Tange, H., van der Weijden, T., & de Witte, L.
- Affiliations
- Zuyd University of Applied Sciences (NL)
- Maastricht University (NL)
- Venue
- JMIR mhealth and uhealth
- Publisher
- JMIR Publications Inc.
- Published
- 2013-07-02
- Volume
- 1
- Issue
- 2
- Pages
- e8
- ISSN
- 2291-5222 (ISSN-L)
- PMC
- PMC4114510
- OpenAlex
- W2143825555
- Cited by
- 128
- References
- 45
- Citations by year
- 2026: 3 · 2025: 4 · 2024: 5 · 2023: 4 · 2022: 8 · 2021: 14 · 2020: 12 · 2019: 19 · 2018: 14 · 2017: 10 · 2016: 13 · 2015: 10 · 2014: 10 · 2013: 2
- FWCI
- 21.13
- Type
- journal article
- Language
- en
- Open access
- gold
- doi.org
- Licence
- cc-by
- Locations
- JMIR mhealth and uhealth (publishedVersion, cc-by)
- Europe PMC (PubMed Central) (publishedVersion, cc-by)
- PubMed Central (publishedVersion, cc-by)
- PubMed (publishedVersion)
- DOAJ (DOAJ: Directory of Open Access Journals) (submittedVersion, cc-by-sa)
- Funders
- ZonMw
- Nederlandse Organisatie voor Wetenschappelijk Onderzoek
- Maastricht Universitair Medisch Centrum
- Topics
- Health Sciences › Health Professions › General Health Professions › Mobile Health and mHealth Applications
- Physical Sciences › Computer Science › Computer Vision and Pattern Recognition › Context-Aware Activity Recognition Systems
- Physical Sciences › Computer Science › Human-Computer Interaction › Innovative Human-Technology Interaction
- Keywords
- physical activity promotion, chronic disease, chronic obstructive pulmonary disease, type 2 diabetes, mobile health apps, self-monitoring, goal setting, feedback, user-centered design, user requirements, primary care, practice nurses, behavior change, wearable sensors, mobile application
About these checks
Registry, retraction, Cites and statistics results are computed, not judged, with one exception: a printed reference that no index lists is read once by a model before it counts as a citation error. Claims are extracted by a model and kept only when their quote appears verbatim in the text; each cited source is then checked, with a model’s help, for whether it says what the claim relies on. Those verdicts can be wrong — read the claim’s quote and the cited source before relying on one.
Statistics and arithmetic are recomputed, not judged.
Confidence bands are shown only for fields calibrated on our annotated test set. None is calibrated yet, so no band is shown.
What counts as a claim ›How we measure confidence ›How we check this ›
Are you an author, or do you see a problem with this page? Request a review
