

The DOI matches its Crossref record; 28 of the 29 references it cites were found in a registry or an index.
Endoplasmic Reticulum Stress Is Reduced in Tissues of Obese Subjects After Weight Loss
Open accessAbstract
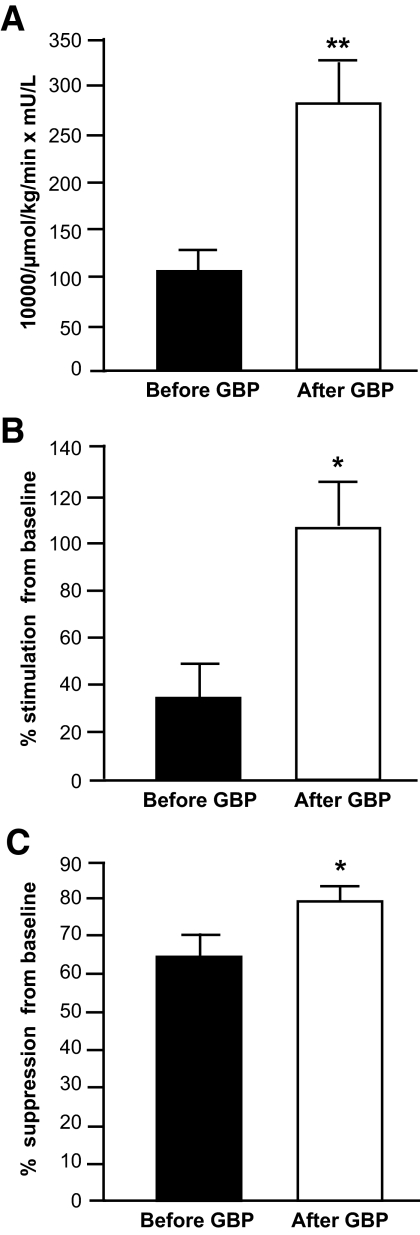
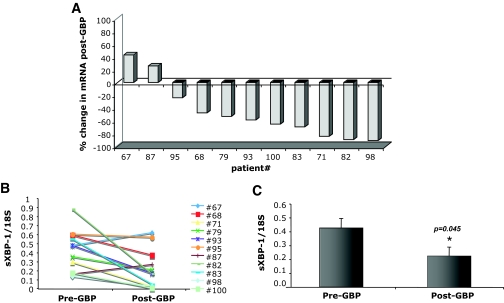
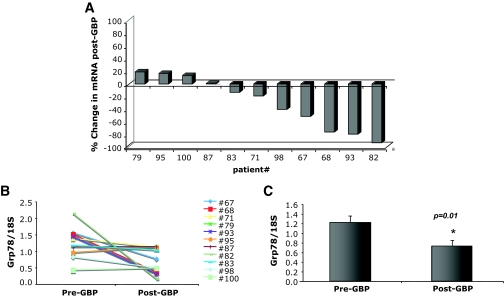
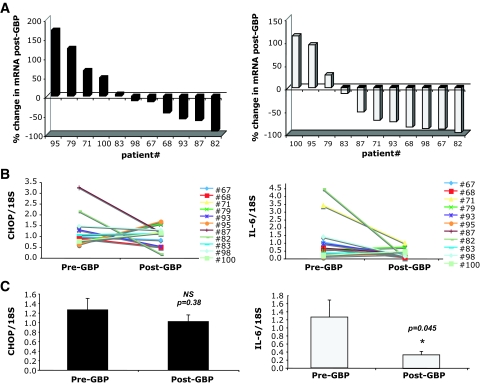
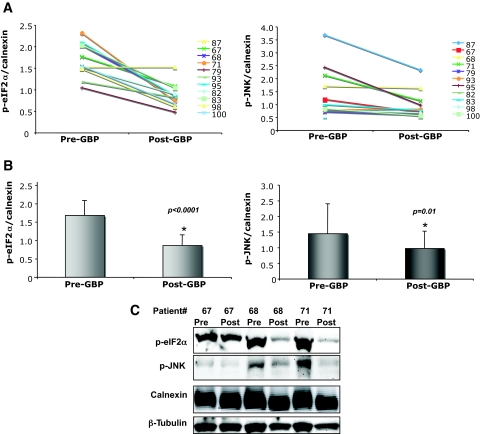
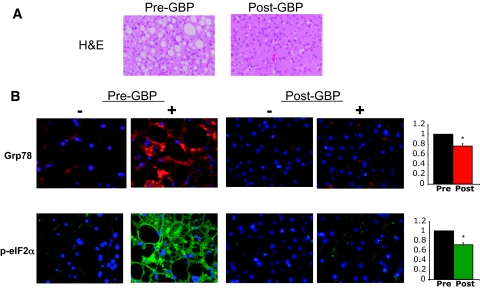
OBJECTIVE: Obesity is associated with insulin resistance and type 2 diabetes, although the mechanisms linking these pathologies remain undetermined. Recent studies in rodent models revealed endoplasmic reticulum (ER) stress in adipose and liver tissues and demonstrated that ER stress could cause insulin resistance. Therefore, we tested whether these stress pathways were also present in obese human subjects and/or regulated by weight loss. RESEARCH DESIGN AND METHODS: Eleven obese men and women (BMI 51.3 +/- 3.0 kg/m2) were studied before and 1 year after gastric bypass (GBP) surgery. We examined systemic insulin sensitivity using hyperinsulinemic-euglycemic clamp studies before and after surgery and collected subcutaneous adipose and liver tissues to examine ER stress markers. RESULTS: Subjects lost 39 +/- 9% body wt at 1 year after GBP surgery (P < 0.001), which was associated with a marked improvement in hepatic, skeletal muscle, and adipose tissue insulin sensitivity. Markers of ER stress in adipose tissue significantly decreased with weight loss. Specifically, glucose-regulated protein 78 (Grp78) and spliced X-box binding protein-1 (sXBP-1) mRNA levels were reduced, as were phosphorylated elongation initiation factor 2alpha (eIF2alpha) and stress kinase c-Jun NH2-terminal kinase 1 (JNK1) (all P values <0.05). Liver sections from a subset of subjects showed intense staining for Grp78 and phosphorylated eIF2alpha before surgery, which was reduced in post-GBP sections. CONCLUSIONS: This study presents important evidence that ER stress pathways are present in selected tissues of obese humans and that these signals are regulated by marked weight loss and metabolic improvement. Hence, this suggests the possibility of a relationship between obesity-related ER stress and metabolic dysfunction in obese humans.
Overview
The claims and statistics of this paper haven’t been checked yet.
Run the check — free, no account needed. It reads the open-access text and checks the sources it cites.
Integrity signals
Registry
Cites
Statistics
Figures
Verification
Claims the paper makes
The claims and statistics of this paper haven’t been checked yet.
Run the check — free, no account needed. It reads the open-access text and checks the sources it cites.
Claims other papers make about this one
Each is checked against this paper’s own text: does it say what the citing paper says it does?
In the citing paper
“Substantial weight loss in patients after bariatric surgery has also been associated with both improvements in insulin sensitivity and reduction in markers of endoplasmic-reticulum stress.132”
From Lipid-induced insulin resistance: unravelling the mechanism (2010) · cites this paper as [132]
Self-check
Percentages, sums and reported differences re-computed from the paper’s own numbers.
The self-check needs the paper’s full text.
Citations
Cites
Inflammation and metabolic disorders
Hotamisligil, G. S. (2006) · Nature · doi:10.1038/nature05485 · Cited by 9,199 · cited 1×
“In the past decade, it was recognized and established that chronic inflammatory and stress responses are a central feature of obesity, insulin resistance, and type 2 diabetes and contribute to the metabolic imbalance (4).”
BackgroundSignal integration in the endoplasmic reticulum unfolded protein response
Ron, D., & Walter, P. (2007) · Nature Reviews Molecular Cell Biology · doi:10.1038/nrm2199 · Cited by 6,431 · cited 1×
“The UPR is initiated by three ER transmembrane sensors (namely PERK (PKR-like ER-regulated kinase), IRE-1 (inositolrequiring enzyme-1), and ATF-6 (activating transcription factor-6) which activate an adaptive response that results in cessation of protein translation and transcriptional increase in proteinfolding chape…”
BackgroundMatsuda, M., & DeFronzo, R. A. (1999) · Diabetes Care · doi:10.2337/diacare.22.9.1462 · Cited by 5,621
Effects of Bariatric Surgery on Mortality in Swedish Obese Subjects
Sjöström, L., Narbro, K., Sjöström, C. D., Karason, K., Larsson, B., Wedel, H., Lystig, T., Sullivan, M., Bouchard, C., Carlsson, B., et al. (2007) · New England Journal of Medicine · doi:10.1056/nejmoa066254 · Cited by 4,668 · cited 1×
“Weight loss induced by GBP surgery improves or completely resolves most obesity-related medical complications and increases survival [24, 25].”
BackgroundEndoplasmic Reticulum Stress Links Obesity, Insulin Action, and Type 2 Diabetes
Özcan, U., Cao, Q., Yilmaz, E., Lee, A.-H., Iwakoshi, N. N., Özdelen, E., Tuncman, G., Görgün, C., Glimcher, L. H., & Hotamisligil, G. S. (2004) · Science · doi:10.1126/science.1103160 · Cited by 3,844 · cited 3×
“Data obtained from mouse models demonstrate that genetically compromised ER folding capacity induces ER stress, activates JNK, and leads to whole-body insulin resistance in the mouse (7).”
BackgroundInfluentialUrano, F., Wang, X.-Z., Bertolotti, A., Zhang, Y.-H., Chung, P., Harding, H., & Ron, D. (2000) · Science · doi:10.1126/science.287.5453.664 · Cited by 3,081 · cited 2×
“The UPR is also able to induce activation of the c-Jun NH2-terminal kinase (JNK) pathway and thereby inhibit insulin signaling through the subsequent phosphorylation and/or degradation of IRS1 (7–9).”
BackgroundÖzcan, U., Yilmaz, E., Özcan, L., Furuhashi, M., Vaillancourt, E., Smith, R. O., Görgün, C. Z., & Hotamisligil, G. S. (2006) · Science · doi:10.1126/science.1128294 · Cited by 2,413 · cited 1×
“In contrast, enhancing ER capacity in obese mice through the use of chemical or molecular chaperones relieves ER stress in adipose tissue and liver, reduces intrahepatic fat accumulation, and restores glucose homeostasis (10).”
BackgroundObesity and Diabetes in the Developing World — A Growing Challenge
Hossain, P., Kawar, B., & El Nahas, M. (2007) · New England Journal of Medicine · doi:10.1056/nejmp068177 · Cited by 2,200
Subcutaneous Adipose Tissue Releases Interleukin-6, But Not Tumor Necrosis Factor-α,in Vivo1
Mohamed‐Ali, V., Goodrick, S., Rawesh, A., Katz, D. R., Miles, J. M., Yudkin, J. S., Klein, S., & Coppack, S. W. (1997) · The Journal of Clinical Endocrinology & Metabolism · doi:10.1210/jcem.82.12.4450 · Cited by 2,032
Kern, P. A., Ranganathan, S., Li, C., Wood, L., & Ranganathan, G. (2001) · American Journal of Physiology-Endocrinology and Metabolism · doi:10.1152/ajpendo.2001.280.5.e745 · Cited by 1,883 · cited 1×
“Earlier studies have shown that IL-6 expression is significantly and consistently down-regulated in adipose tissue after weight loss [17-21].”
Background
Cited by
Sorted by citations
Mechanisms of Insulin Action and Insulin Resistance
Petersen, M. C., & Shulman, G. I. (2018) · Physiological Reviews · doi:10.1152/physrev.00063.2017 · Cited by 3,028
Endoplasmic reticulum stress and the inflammatory basis of metabolic disease
Hotamisligil, G. S. (2010) · Cell · doi:10.1016/j.cell.2010.02.034 · Cited by 2,802
“Finally, we showed that when obese patients undergo marked weight loss due to gastric by-pass surgery, there is a decrease in ER stress markers in liver and adipose tissue (Gregor et al., 2009).”
DeFronzo, R. A., Ferrannini, E., Groop, L., Henry, R. R., Herman, W. H., Holst, J. J., Hu, F. B., Kahn, C. R., Raz, I., Shulman, G. I., et al. (2015) · Nature Reviews Disease Primers · doi:10.1038/nrdp.2015.19 · Cited by 2,611
Mechanisms for Insulin Resistance: Common Threads and Missing Links
Samuel, V. T., & Shulman, G. I. (2012) · Cell · doi:10.1016/j.cell.2012.02.017 · Cited by 2,294
“Further, markers of the UPR are decreased after surgical induced weight loss (Gregor et al., 2009).”
Obesity and nonalcoholic fatty liver disease: biochemical, metabolic, and clinical implications
Fabbrini, E., Sullivan, S., & Klein, S. (2010) · Hepatology · doi:10.1002/hep.23280 · Cited by 2,100
Metadata
- Authors
- Gregor, M. F., Yang, L., Fabbrini, E., Mohammed, B. S., Eagon, J. C., Hotamisligil, G. S., & Klein, S.
- Affiliations
- Harvard University (US)
- Washington University in St. Louis (US)
- Department of Genetics and Complex Diseases, Harvard School of Public Health, Boston, Massachusetts
- Corresponding author
- Klein, Samuel
- Venue
- Diabetes
- Publisher
- American Diabetes Association
- Published
- 2009-03-01
- Volume
- 58
- Issue
- 3
- Pages
- 693-700
- ISSN
- 0012-1797 (ISSN-L)
- 1939-327X
- PMC
- PMC2646068
- OpenAlex
- W2122631753
- Cited by
- 488
- References
- 29
- Citations by year
- 2026: 7 · 2025: 13 · 2024: 16 · 2023: 22 · 2022: 22 · 2021: 22 · 2020: 25 · 2019: 19 · 2018: 28 · 2017: 31 · 2016: 32 · 2015: 47 · 2014: 38 · 2013: 42 · 2012: 43
- FWCI
- 11.82
- Type
- journal article
- Language
- en
- Open access
- hybrid
- doi.org
- Licence
- cc-by-nc-nd
- Locations
- Diabetes (publishedVersion, cc-by-nc-nd)
- PubMed Central (publishedVersion, cc-by-nc-nd)
- PubMed (publishedVersion)
- Digital Commons@Becker (Washington University School of Medicine) (submittedVersion)
- Funders
- American Diabetes Association
- National Institutes of Health (5t32es007155-24, UL1TR000448)
- National Institute of Diabetes and Digestive and Kidney Diseases (DK52539, DK37948, DK56341, R01DK037948, R01DK052539, P30DK056341, P30DK040561)
- National Institute of Environmental Health Sciences (T32-ES007155, T32 ES007155-24)
- National Center for Research Resources (UL1RR024992)
- National Center for Advancing Translational Sciences
- Topics
- Life Sciences › Biochemistry, Genetics and Molecular Biology › Cell Biology › Endoplasmic Reticulum Stress and Disease
- Health Sciences › Medicine › Endocrinology, Diabetes and Metabolism › Adipokines, Inflammation, and Metabolic Diseases
- Health Sciences › Medicine › Surgery › Bariatric Surgery and Outcomes
- Keywords
- endoplasmic reticulum stress, obesity, weight loss, gastric bypass, insulin resistance, type 2 diabetes, adipose tissue, liver, skeletal muscle, GRP78, eIF2α, JNK1, insulin sensitivity
- MeSH terms
- Endoplasmic Reticulum Chaperone BiP, Adipose Tissue, Endoplasmic Reticulum, Female, Follow-Up Studies, Humans, Hyperinsulinism, Insulin Resistance, Liver, Male, Middle Aged, Obesity, Stress, Physiological, Glucose Clamp Technique, Gastric Bypass, Muscle, Skeletal
About these checks
Registry, retraction, Cites and statistics results are computed, not judged, with one exception: a printed reference that no index lists is read once by a model before it counts as a citation error. Claims are extracted by a model and kept only when their quote appears verbatim in the text; each cited source is then checked, with a model’s help, for whether it says what the claim relies on. Those verdicts can be wrong — read the claim’s quote and the cited source before relying on one.
Statistics and arithmetic are recomputed, not judged.
Confidence bands are shown only for fields calibrated on our annotated test set. None is calibrated yet, so no band is shown.
What counts as a claim ›How we measure confidence ›How we check this ›
Are you an author, or do you see a problem with this page? Request a review
