

The DOI matches its Crossref record; 38 of the 38 references it cites were found in a registry or an index.
Butyrate Improves Insulin Sensitivity and Increases Energy Expenditure in Mice
Open accessAbstract
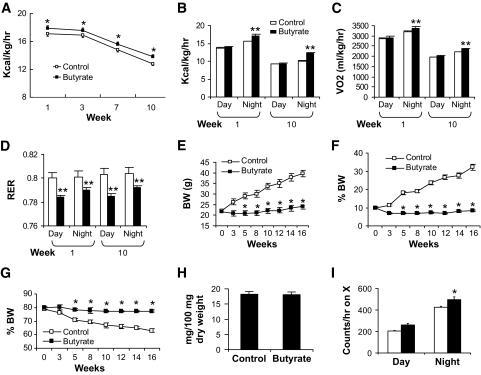
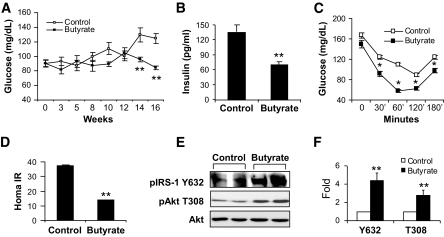
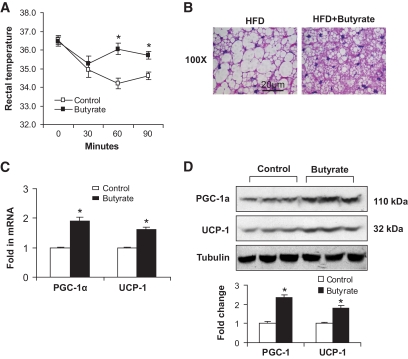
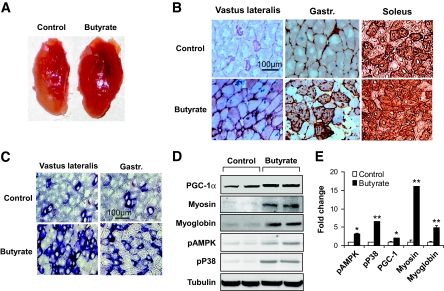
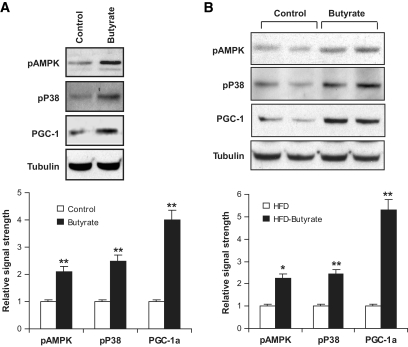
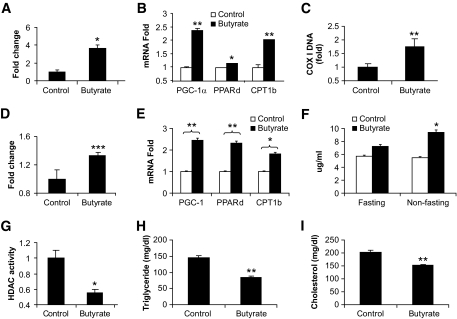
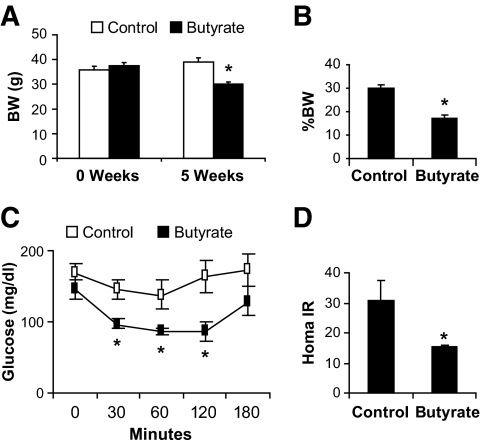
OBJECTIVE: We examined the role of butyric acid, a short-chain fatty acid formed by fermentation in the large intestine, in the regulation of insulin sensitivity in mice fed a high-fat diet. RESEARCH DESIGN AND METHODS: In dietary-obese C57BL/6J mice, sodium butyrate was administrated through diet supplementation at 5% wt/wt in the high-fat diet. Insulin sensitivity was examined with insulin tolerance testing and homeostasis model assessment for insulin resistance. Energy metabolism was monitored in a metabolic chamber. Mitochondrial function was investigated in brown adipocytes and skeletal muscle in the mice. RESULTS: On the high-fat diet, supplementation of butyrate prevented development of insulin resistance and obesity in C57BL/6 mice. Fasting blood glucose, fasting insulin, and insulin tolerance were all preserved in the treated mice. Body fat content was maintained at 10% without a reduction in food intake. Adaptive thermogenesis and fatty acid oxidation were enhanced. An increase in mitochondrial function and biogenesis was observed in skeletal muscle and brown fat. The type I fiber was enriched in skeletal muscle. Peroxisome proliferator-activated receptor-gamma coactivator-1alpha expression was elevated at mRNA and protein levels. AMP kinase and p38 activities were elevated. In the obese mice, supplementation of butyrate led to an increase in insulin sensitivity and a reduction in adiposity. CONCLUSIONS: Dietary supplementation of butyrate can prevent and treat diet-induced insulin resistance in mouse. The mechanism of butyrate action is related to promotion of energy expenditure and induction of mitochondria function.
Overview
The claims and statistics of this paper haven’t been checked yet.
Run the check — free, no account needed. It reads the open-access text and checks the sources it cites.
Integrity signals
Registry
Cites
Statistics
Figures
Verification
Claims the paper makes
The claims and statistics of this paper haven’t been checked yet.
Run the check — free, no account needed. It reads the open-access text and checks the sources it cites.
Claims other papers make about this one
Each is checked against this paper’s own text: does it say what the citing paper says it does?
In the citing paper
“For the peptides discussed in this review, beyond the role in satiety, they can be stimulated by bacterial products that come into contact with the gut epithelium [83,105,106].”
From Anxiety, depression, and the microbiome: A role for gut peptides (2018) · cites this paper as [106]
Self-check
Percentages, sums and reported differences re-computed from the paper’s own numbers.
The self-check needs the paper’s full text.
Citations
Cites
Mootha, V. K., Lindgren, C. M., Eriksson, K.-F., Subramanian, A., Sihag, S., Lehar, J., Puigserver, P., Carlsson, E., Ridderstråle, M., Laurila, E., et al. (2003) · Nature Genetics · doi:10.1038/ng1180 · Cited by 10,197
Resveratrol improves health and survival of mice on a high-calorie diet
Baur, J. A., Pearson, K. J., Price, N. L., Jamieson, H. A., Lerin, C., Kalra, A., Prabhu, V. V., Allard, J. S., Lopez-Lluch, G., Lewis, K., et al. (2006) · Nature · doi:10.1038/nature05354 · Cited by 4,290
Lagouge, M., Argmann, C., Gerhart-Hines, Z., Meziane, H., Lerin, C., Daussin, F., Messadeq, N., Milne, J., Lambert, P., Elliott, P., et al. (2006) · Cell · doi:10.1016/j.cell.2006.11.013 · Cited by 4,057
A Cold-Inducible Coactivator of Nuclear Receptors Linked to Adaptive Thermogenesis
Puigserver, P., Wu, Z., Park, C. W., Graves, R., Wright, M., & Spiegelman, B. M. (1998) · Cell · doi:10.1016/s0092-8674(00)81410-5 · Cited by 3,864
Transcriptional co-activator PGC-1α drives the formation of slow-twitch muscle fibres
Lin, J., Wu, H., Tarr, P. T., Zhang, C.-Y., Wu, Z., Boss, O., Michael, L. F., Puigserver, P., Isotani, E., Olson, E. N., et al. (2002) · Nature · doi:10.1038/nature00904 · Cited by 2,546
AMP-activated protein kinase (AMPK) action in skeletal muscle via direct phosphorylation of PGC-1α
Jäger, S., Handschin, C., St.-Pierre, J., & Spiegelman, B. M. (2007) · Proceedings of the National Academy of Sciences · doi:10.1073/pnas.0705070104 · Cited by 2,491
Bile acids induce energy expenditure by promoting intracellular thyroid hormone activation
Watanabe, M., Houten, S. M., Mataki, C., Christoffolete, M. A., Kim, B. W., Sato, H., Messaddeq, N., Harney, J. W., Ezaki, O., Kodama, T., et al. (2006) · Nature · doi:10.1038/nature04330 · Cited by 2,220
Metabolic control through the PGC-1 family of transcription coactivators
Lin, J., Handschin, C., & Spiegelman, B. M. (2005) · Cell Metabolism · doi:10.1016/j.cmet.2005.05.004 · Cited by 2,130 · cited 1×
“PGC-1 controls energy metabolism by interaction with several transcription factors, e.g., estrogen-related receptor-, nuclear respiratory factor-1 and -2, PPAR- and -, and thyroid hormone receptor, that direct gene transcription for mitochondrial biogenesis and respiration ( 8 ).”
BackgroundMitochondrial dysfunction in the elderly: possible role in insulin resistance
Petersen, K. F., Befroy, D., Dufour, S., Dziura, J., Ariyan, C., Rothman, D. L., DiPietro, L., Cline, G. W., & Shulman, G. I. (2003) · Science · doi:10.1126/science.1082889 · Cited by 2,107
Puigserver, P., & Spiegelman, B. M. (2003) · Endocrine Reviews · doi:10.1210/er.2002-0012 · Cited by 2,076
Cited by
Sorted by citations
Items 801–900 of 1,005
The relationships between high-fat diet and metabolic syndrome: Potential mechanisms
Tang, C., Wang, Y., Xu, Z., Chen, D., Xu, J., Yang, D., Zhang, L., Liu, J., & Kan, J. (2024) · Food Bioscience · doi:10.1016/j.fbio.2024.104261 · Cited by 49
Induction of Peroxisomes by Butyrate-Producing Probiotics
Weng, H., Endo, K., Li, J., Kito, N., & Iwai, N. (2015) · PLoS ONE · doi:10.1371/journal.pone.0117851 · Cited by 44
Zheng, J., Enright, F. M., Keenan, M. J., Finley, J. W., Zhou, J., Ye, J., Greenway, F. L., Senevirathne, R. N., Gissendanner, C. R., Manaois, R. V., et al. (2010) · Journal of Agricultural and Food Chemistry · doi:10.1021/jf904583b · Cited by 45
Self-citationYin, F., Yu, H., Lepp, D., Shi, X., Yang, X., Hu, J., Leeson, S., Yang, C., Nie, S., Hou, Y., et al. (2016) · PLoS ONE · doi:10.1371/journal.pone.0160751 · Cited by 46
Emerging role of intestinal microbiota and microbial metabolites in metabolic control
Herrema, H., IJzerman, R. G., & Nieuwdorp, M. (2016) · Diabetologia · doi:10.1007/s00125-016-4192-0 · Cited by 45
Zubiría, M. G., Gambaro, S. E., Rey, M., Carasi, P., Serradell, M. D. L. Á., & Giovambattista, A. (2017) · Nutrients · doi:10.3390/nu9050470 · Cited by 45
Botta, C., Acquadro, A., Greppi, A., Barchi, L., Bertolino, M., Cocolin, L., & Rantsiou, K. (2017) · Scientific Reports · doi:10.1038/s41598-017-16186-8 · Cited by 45
Genes and Gut Bacteria Involved in Luminal Butyrate Reduction Caused by Diet and Loperamide
Hwang, N., Eom, T.-K., Gupta, S. K., Jeong, S.-Y., Jeong, D., Kim, Y. S., Lee, J.-H., Sadowsky, M. J., & Unno, T. (2017) · Genes · doi:10.3390/genes8120350 · Cited by 45
Oh, T. J., Sul, W. J., Oh, H. N., Lee, Y.-K., Lim, H. L., Choi, S. H., Park, K. S., & Jang, H. C. (2019) · Scientific Reports · doi:10.1038/s41598-019-56684-5 · Cited by 48
Hu, C., Li, F., Duan, Y., Yin, Y., & Kong, X. (2019) · Frontiers in Microbiology · doi:10.3389/fmicb.2019.01767 · Cited by 41
Dagbasi, A., Lett, A. M., Murphy, K., & Frost, G. (2020) · Proceedings of the Nutrition Society · doi:10.1017/s0029665120006941 · Cited by 44
Gal, A., Barko, P. C., Biggs, P. J., Gedye, K. R., Midwinter, A. C., Williams, D. A., Burchell, R. K., & Pazzi, P. (2021) · PLoS ONE · doi:10.1371/journal.pone.0250344 · Cited by 48
Gut Microbiome in Chronic Coronary Syndrome Patients
Sawicka, E., Bondarczuk, K., Bauer, W., Niemira, M., Szalkowska, A., Raczkowska, J., Kwaśniewski, M., Tarasiuk, E., Dubatówka, M., Łapińska, M., et al. (2021) · Journal of Clinical Medicine · doi:10.3390/jcm10215074 · Cited by 46
Khosravi, Z., Hadi, A., Tutunchi, H., Jafarabadi, M. A., Naeinie, F., Roshanravan, N., Ostadrahimi, A., & Fadel, A. (2022) · Clinical Nutrition ESPEN · doi:10.1016/j.clnesp.2022.03.008 · Cited by 45
Ai, Z.-L., Zhang, X., Ge, W., Zhong, Y., Wang, H.-Y., Zuo, Z.-Y., & Liu, D. (2022) · World Journal of Gastroenterology · doi:10.3748/wjg.v28.i43.6131 · Cited by 45
The critical role of gut microbiota dysbiosis in skeletal muscle wasting: a systematic review
Nikkhah, A., Ejtahed, H., Marvasti, F. E., Taghavi, M., Pakmehr, A., Hajipour, F., & Larijani, B. A. (2022) · Journal of Applied Microbiology · doi:10.1093/jambio/lxac014 · Cited by 47
Yadav, J., Liang, T., Qin, T., Nathan, N., Schwenger, K. J. P., Pickel, L., Xie, L., Lei, H., Winer, D. A., Maughan, H., et al. (2023) · Cell Reports Medicine · doi:10.1016/j.xcrm.2023.101051 · Cited by 49
Obesity, obesities and gastrointestinal cancers
Zou, Y., & Pitchumoni, C. S. (2023) · Disease-a-Month · doi:10.1016/j.disamonth.2023.101592 · Cited by 47
Leopold, C., Duta-Mare, M., Sachdev, V., Goeritzer, M., Maresch, L. K., Kolb, D., Reicher, H., Wagner, B., Stojaković, T., Ruelicke, T., et al. (2019) · Biochimica et Biophysica Acta (BBA) - Molecular and Cell Biology of Lipids · doi:10.1016/j.bbalip.2019.01.007 · Cited by 44
Adeyanju, O. A., Badejogbin, O. C., Areola, E. D., Olaniyi, K. S., Dibia, C., Soetan, O. A., Oniyide, A. A., Michael, O. S., Olatunji, L. A., & Soladoye, A. O. (2020) · Biomedicine & Pharmacotherapy · doi:10.1016/j.biopha.2020.110994 · Cited by 44
Abnormal food timing and predisposition to weight gain: Role of barrier dysfunction and microbiota
Bishehsari, F., Engen, P. A., Adnan, D., Sarrafi, S., Wilber, S., Shaikh, M. W., Green, S. J., Naqib, A. D., Giron, L. B., Abdel‐Mohsen, M., et al. (2020) · Translational research · doi:10.1016/j.trsl.2020.11.007 · Cited by 44
Shashni, B., Tajika, Y., & Nagasaki, Y. (2021) · Biomaterials · doi:10.1016/j.biomaterials.2021.120877 · Cited by 45
Liu, X., Xu, M., Wang, H., & Zhu, L. (2025) · Nutrients · doi:10.3390/nu17091463 · Cited by 49
Gut microbiota and obesity: Involvement of the adipose tissue
Guida, S., & Venema, K. (2015) · Journal of Functional Foods · doi:10.1016/j.jff.2015.02.014 · Cited by 43
Sarbini, S. R., Kolida, S., Deaville, E. R., Gibson, G. R., & Rastall, R. A. (2014) · British Journal Of Nutrition · doi:10.1017/s0007114514002177 · Cited by 44
Intestinal microbiota, obesity and prebiotics
Barczyńska, R., Bandurska, K., Śliżewska, K., Litwin, M., Szalecki, M., Libudzisz, Z., & Kapuśniak, J. (2015) · Polish Journal of Microbiology · doi:10.33073/pjm-2015-014 · Cited by 42
Fluitman, K. S., de Clercq, N. C., Keijser, B. J. F., Visser, M., Nieuwdorp, M., & IJzerman, R. G. (2017) · Expert Review of Endocrinology & Metabolism · doi:10.1080/17446651.2017.1318060 · Cited by 47
Schmedes, M. S., Brejnrod, A., Aadland, E. K., Kiilerich, P., Kristiansen, K., Jacques, H., Lavigne, C., Graff, I. E., Eng, Ø., Holthe, A., et al. (2018) · Molecular Nutrition & Food Research · doi:10.1002/mnfr.201700976 · Cited by 43
Gut Microbial Product Predicts Cardiovascular Risk in Chronic Kidney Disease Patients
Jadoon, A., Mathew, A. V., Byun, J., Gadegbeku, C. A., Gipson, D. S., Afshinnia, F., Pennathur, S., & for the Michigan Kidney Translational Core CPROBE Investigator Group (2018) · American Journal of Nephrology · doi:10.1159/000493862 · Cited by 41
Therapeutic advances in non-alcoholic fatty liver disease: A microbiota-centered view
Chen, H., Huang, H., Li, Y., Xu, H., & Zhou, Y. (2020) · World Journal of Gastroenterology · doi:10.3748/wjg.v26.i16.1901 · Cited by 43
Nakashima, A., Sasaki, K., Sasaki, D., Yasuda, K., Suzuki, K., & Kondo, A. (2021) · Scientific Reports · doi:10.1038/s41598-020-80306-0 · Cited by 43
The Association of Targeted Gut Microbiota with Body Composition in Type 2 Diabetes Mellitus
Hung, W.-C., Hung, W., Tsai, H.-J., Chang, C.-C., Chiu, Y., Hwang, S., Kuo, M., Chen, S., Dai, C., & Tsai, Y. (2020) · International Journal of Medical Sciences · doi:10.7150/ijms.51164 · Cited by 45
He, L., Yang, F., Tang, P., Gao, T., Yang, C., Tan, L., Yue, P., Hua, Y., Liu, S., & Guo, J. (2022) · Biomedicine & Pharmacotherapy · doi:10.1016/j.biopha.2022.113091 · Cited by 41
Régnier, M., Hul, M. V., Roumain, M., Paquot, A., d’Oplinter, A. D. W., Suriano, F., Everard, A., Delzenne, N. M., Muccioli, G. G., & Cani, P. D. (2023) · Gut Microbes · doi:10.1080/19490976.2023.2178796 · Cited by 42
Wang, X., Zhang, J., Wang, S., Song, Z., Sun, H., Wu, F., Lin, X., Jin, K., Jin, X., Wang, W.-T., et al. (2023) · European Journal of Pharmacology · doi:10.1016/j.ejphar.2023.175782 · Cited by 43
Self-citationZhang, L., Chen, N., Zhan, L., Bi, T., Zhou, W., Zhang, L., & Zhu, L. (2023) · Journal of Ethnopharmacology · doi:10.1016/j.jep.2023.116811 · Cited by 42
Evidence for the contribution of the gut microbiome to obesity and its reversal
de Wit, D. F., Hanssen, N. M. J., Wortelboer, K., Herrema, H., Rampanelli, E., & Nieuwdorp, M. (2023) · Science Translational Medicine · doi:10.1126/scitranslmed.adg2773 · Cited by 50
Livshits, G., & Kalinkovich, A. (2024) · Ageing Research Reviews · doi:10.1016/j.arr.2024.102267 · Cited by 43
New perspectives on nutritional interventions to augment lipid utilisation during exercise
Gonzalez, J. T., & Stevenson, E. (2011) · British Journal Of Nutrition · doi:10.1017/s0007114511006684 · Cited by 43
Effects of dietary fibers and prebiotics in adiposity regulation via modulation of gut microbiota
Rivera‐Piza, A., & Lee, S. (2020) · Applied Biological Chemistry · doi:10.1186/s13765-019-0482-9 · Cited by 46
Yi, W., Cheng, J., Wei, Q., Pan, R., Song, S., He, Y., Tang, C. K., Liu, X., Zhou, Y., & Su, H. (2021) · The Science of The Total Environment · doi:10.1016/j.scitotenv.2020.144568 · Cited by 43
The emerging role of gut microbiota in cardiovascular diseases
Kumar, D., Mukherjee, S. S., Chakraborty, R., Roy, R. R., Pande, A., Patra, S., & Dey, S. (2021) · Indian Heart Journal · doi:10.1016/j.ihj.2021.04.008 · Cited by 42
Lunken, G., Tsai, K., Schick, A., Lisko, D. J., Cook, L. E., Vallance, B. A., & Jacobson, K. (2021) · Cellular and Molecular Gastroenterology and Hepatology · doi:10.1016/j.jcmgh.2021.06.011 · Cited by 42
Xiao, L., Sun, Y., & Tsao, R. (2022) · Journal of Agricultural and Food Chemistry · doi:10.1021/acs.jafc.2c02326 · Cited by 50
Zhang, L., Liu, Y., Xinzhou, W., & Zhang, X. (2023) · Nutrients · doi:10.3390/nu15061539 · Cited by 49
Rohde, J. K., Fuh, M. M., Evangelakos, I., Pauly, M. J., Schaltenberg, N., Siracusa, F., Gagliani, N., Tödter, K., Heeren, J., & Worthmann, A. (2022) · Metabolites · doi:10.3390/metabo12020170 · Cited by 41
Li, J., Zhao, J., Tian, C., Dong, L., Kang, Z., Wang, J., Zhao, S., Li, M., & Tong, X. (2024) · Nutrition & Metabolism · doi:10.1186/s12986-024-00829-5 · Cited by 43
The Gut Microbiota-Related Antihyperglycemic Effect of Metformin
Szymczak-Pajor, I., Drzewoski, J., Kozłowska, M., Krekora, J., & Śliwińska, A. (2025) · Pharmaceuticals · doi:10.3390/ph18010055 · Cited by 43
Nielsen, T. S., Theil, P. K., Purup, S., Nørskov, N. P., & Knudsen, K. E. B. (2015) · Journal of Agricultural and Food Chemistry · doi:10.1021/acs.jafc.5b03372 · Cited by 41
Epigenetic regulation of skeletal muscle metabolism
Howlett, K. F., & McGee, S. L. (2016) · Clinical Science · doi:10.1042/cs20160115 · Cited by 40
Epigenomic and transcriptional control of insulin resistance
Rosen, E. D. (2016) · Journal of Internal Medicine · doi:10.1111/joim.12547 · Cited by 43
Maillard, F., Vazeille, E., Sauvanet, P., Sirvent, P., Combaret, L., Sourdrille, A., Chavanelle, V., Bonnet, R., Otero, Y. F., Delcros, G., et al. (2019) · PLoS ONE · doi:10.1371/journal.pone.0214660 · Cited by 45
Zheng, Y., Gou, X., Zhang, L., Gao, H., Wei, Y., Yu, X., Pang, B., Tian, J., Tong, X., & Li, M. (2020) · Frontiers in Cellular and Infection Microbiology · doi:10.3389/fcimb.2020.00360 · Cited by 43
Liang, D., Li, N., Dai, X., Zhang, H., & Hu, H. (2020) · International Journal of Food Science & Technology · doi:10.1111/ijfs.14873 · Cited by 41
Relationship between intestinal microbiota, diet and biological systems: an integrated view
Ferreira, R. D. S., Mendonça, L. A. B. M., Ribeiro, C. F. A., Calças, N. C., Guimarães, R. D. C. A., do Nascimento, V. A., Freitas, K. D. C., Carvalho, C. M. E., de Castro, A. P., & Franco, O. L. (2020) · Critical Reviews in Food Science and Nutrition · doi:10.1080/10408398.2020.1836605 · Cited by 46
The role of lactose in weanling pig nutrition: a literature and meta-analysis review
Zhao, J., Zhang, Z., Zhang, S., Page, G. L., & Jaworski, N. W. (2021) · Journal of Animal Science and Biotechnology/Journal of animal science and biotechnology · doi:10.1186/s40104-020-00522-6 · Cited by 43
Multiple Selection Criteria for Probiotic Strains with High Potential for Obesity Management
Alard, J., Cudennec, B., Boutillier, D., Peucelle, V., Descat, A., Decoin, R., Kuylle, S., Jablaoui, A., Rhimi, M., Wolowczuk, I., et al. (2021) · Nutrients · doi:10.3390/nu13030713 · Cited by 46
Shah, S., Fillier, T. A., Pham, T. H., Thomas, R., & Cheema, S. K. (2021) · Nutrients · doi:10.3390/nu13030892 · Cited by 43
Sakakida, T., Ishikawa, T., Doi, T., Morita, R., Endo, Y., Matsumura, S., Ota, T., Yoshida, J., Hirai, Y., Mizushima, K., et al. (2022) · Cancer Science · doi:10.1111/cas.15306 · Cited by 45
Advances in the role and mechanism of lactic acid bacteria in treating obesity
Shen, Y., Zhang, L., Yang, Y., Yin, B., Ye, B., & Zhou, Y. Q. (2022) · Food Bioengineering · doi:10.1002/fbe2.12002 · Cited by 41
Gut mechanisms linking intestinal sweet sensing to glycemic control
Kreuch, D., Keating, D. J., Wu, T., Horowitz, M., Rayner, C. K., & Young, R. L. (2018) · Frontiers in Endocrinology · doi:10.3389/fendo.2018.00741 · Cited by 40
Wen, C., Wang, Q., Gu, S., Jin, J., & Yang, N. (2023) · Microbial Biotechnology · doi:10.1111/1751-7915.14361 · Cited by 45
Role of Gut Microbial Metabolites in Cardiovascular Diseases—Current Insights and the Road Ahead
Datta, S., Pasham, S., Sandeep, I. S., Boini, K. M., & Koka, S. (2024) · International Journal of Molecular Sciences · doi:10.3390/ijms251810208 · Cited by 42
Emerging roles for histone deacetylases in age-related muscle atrophy
Walsh, M. E., & Remmen, H. V. (2016) · Nutrition and Healthy Aging · doi:10.3233/nha-160005 · Cited by 39
Human microbiome as therapeutic intervention target to reduce cardiovascular disease risk
Koopen, A. M., Groen, A. K., & Nieuwdorp, M. (2016) · Current Opinion in Lipidology · doi:10.1097/mol.0000000000000357 · Cited by 41
Wang, H., Ren, P., Lai, M., Shen, N., Chen, J., & Zhang, Y. (2019) · Journal of Functional Foods · doi:10.1016/j.jff.2019.02.030 · Cited by 41
Effects of Probiotics and Prebiotics on Frailty and Ageing: A Narrative Review
Jayanama, K., & Theou, O. (2019) · Current Clinical Pharmacology · doi:10.2174/1574884714666191120124548 · Cited by 43
Ye, L., Cao, Z., Lai, X., Shi, Y., & Zhou, N. (2019) · Journal of Nutrition · doi:10.1093/jn/nxz303 · Cited by 40
Ren, G., Zhang, J., Li, M., Tang, Z., Yang, Z., Cheng, G., & Wang, J. (2020) · Clinical Nutrition · doi:10.1016/j.clnu.2020.04.030 · Cited by 41
Self-citationMicrobiome response to diet: focus on obesity and related diseases
Delzenne, N. M., Rodriguez, J., Olivares, M., & Neyrinck, A. M. (2020) · Reviews in Endocrine and Metabolic Disorders · doi:10.1007/s11154-020-09572-7 · Cited by 40
Szczuko, M., Kikut, J., Maciejewska, D., Kulpa, D., Celewicz, Z., & Ziętek, M. (2020) · International Journal of Molecular Sciences · doi:10.3390/ijms21239212 · Cited by 41
Human Gut Microbiome and Liver Diseases: From Correlation to Causation
Li, R., Mao, Z., Ye, X., & Zuo, T. (2021) · Microorganisms · doi:10.3390/microorganisms9051017 · Cited by 40
The Crosstalk between Microbiome and Mitochondrial Homeostasis in Neurodegeneration
Borbolis, F., Mytilinaiou, E., & Palikaras, K. (2023) · Cells · doi:10.3390/cells12030429 · Cited by 42
Герунова, Л. К., Gerunov, T. V., P’yanova, L. G., Лавренов, А. В., Седанова, А. В., Delyagina, M. S., Fedorov, Y. N., Корниенко, Н. В., Kryuchek, Y. O., & Tarasenko, A. A. (2024) · Journal of Veterinary Science · doi:10.4142/jvs.23230 · Cited by 39
Li, X., Zhang, Z., Cheng, J., Diao, C., Yan, Y., Liu, D., Wang, H., & Zheng, F. (2019) · Journal of Functional Foods · doi:10.1016/j.jff.2019.05.032 · Cited by 39
Niacin fine‐tunes energy homeostasis through canonical GPR109A signaling
Ye, L., Cao, Z., Lai, X., Wang, W., Guo, Z., Yan, L., Wang, Y., Shi, Y., & Zhou, N. (2018) · The FASEB Journal · doi:10.1096/fj.201801951r · Cited by 38
Yao, H., Wang, L., Tang, X., Yang, Z., Li, H.-Y., Sun, C., Wu, X.-Y., & Xu, D. (2020) · International Journal of Biological Macromolecules · doi:10.1016/j.ijbiomac.2020.05.121 · Cited by 35
AMPK as Target for Intervention in Childhood and Adolescent Obesity
Rojas, J., Arráiz, N., Aguirre, M., Velasco, M., & Bermúdez, V. (2010) · Journal of Obesity · doi:10.1155/2011/252817 · Cited by 40
Zhang, L., Xinzhou, W., & Zhang, X. (2022) · Foods · doi:10.3390/foods11192961 · Cited by 38
Xu, R.-C., Miao, W.-T., Xu, J., Xu, W. V., Liu, M.-R., Ding, S., Jian, Y.-X., Lei, Y.-H., Yan, N., & Liu, H.-D. (2022) · Nutrients · doi:10.3390/nu14194163 · Cited by 41
Salehi, S., Allahverdy, J., Pourjafar, H., Sarabandi, K., & Jafari, S. M. (2024) · Probiotics and Antimicrobial Proteins · doi:10.1007/s12602-024-10223-5 · Cited by 45
Hartstra, A. V., Nieuwdorp, M., & Herrema, H. (2016) · Trends in Food Science & Technology · doi:10.1016/j.tifs.2016.08.009 · Cited by 39
Gut Microbiota Dysbiosis in Children with Relapsing Idiopathic Nephrotic Syndrome
Tsuji, S., Suruda, C., Hashiyada, M., Kimata, T., Yamanouchi, S., Kitao, T., Kino, J., Akane, A., & Kaneko, K. (2018) · American Journal of Nephrology · doi:10.1159/000487557 · Cited by 38
Gut microbiota in early pregnancy among women with Hyperglycaemia vs. Normal blood glucose
Gao, B., Zhong, M., Shen, Q. “., Wu, Y., Cao, M., Ju, S., & Chen, L. (2020) · BMC Pregnancy and Childbirth · doi:10.1186/s12884-020-02961-5 · Cited by 38
Xu, N., Ding, T., Liu, Y., Zheng, W., Liu, Q., Yin, Z., Xiang, X., Xu, D., Mai, K., & Ai, Q. (2020) · Aquaculture Nutrition · doi:10.1111/anu.13192 · Cited by 37
Effects of urolithins on obesity-associated gut dysbiosis in rats fed on a high-fat diet
Abdulrahman, A. O., Alzubaidi, M. Y., Nadeem, M. S., Khan, J. A., Rather, I. A., & Khan, M. I. (2021) · International Journal of Food Sciences and Nutrition · doi:10.1080/09637486.2021.1886255 · Cited by 38
Kushwaha, V., Rai, P., Varshney, S., Gupta, S., Khandelwal, N., Kumar, D., & Gaikwad, A. N. (2022) · Food Chemistry Molecular Sciences · doi:10.1016/j.fochms.2022.100079 · Cited by 42
St‐Onge, M., Salinardi, T. C., Rubin, K. H., & Black, R. M. (2011) · Obesity · doi:10.1038/oby.2011.289 · Cited by 38
Resistant starch as a novel dietary strategy to maintain kidney health in diabetes mellitus
Koh, G. Y., & Rowling, M. J. (2017) · Nutrition Reviews · doi:10.1093/nutrit/nux006 · Cited by 39
Ma, H., He, K., Zhu, J., Li, X., & Ye, X. (2019) · Fitoterapia · doi:10.1016/j.fitote.2019.03.003 · Cited by 37
Short-chain fatty acids as a link between diet and cardiometabolic risk: a narrative review
Birkeland, E., Gharagozlian, S., Valeur, J., & Aas, A. (2023) · Lipids in Health and Disease · doi:10.1186/s12944-023-01803-5 · Cited by 48
Gut microbial metabolites and the brain–gut axis in Alzheimer’s disease: A review
Ji, X., Wang, J., Lan, T., Zhao, D., & Xu, P. (2025) · Biomolecules and Biomedicine · doi:10.17305/bb.2025.12921 · Cited by 43
Lee, J., Jung, S., Kim, N., Shin, M., Ryu, D. H., & Hwang, G. (2017) · Scientific Reports · doi:10.1038/s41598-017-13991-z · Cited by 37
Li, L., Wang, H., Nie, X., Jiang, W., & Zhang, Y. (2018) · Journal of Cellular Biochemistry · doi:10.1002/jcb.27565 · Cited by 37
Wang, A., Dongcheng, C., Zhang, H., Li, Q., Yan, Z., Qiu, Y., Xu, H., & Keji, C. (2019) · Pharmacological Research · doi:10.1016/j.phrs.2019.02.018 · Cited by 37
Hu, C., Li, F., Duan, Y., Yin, Y., & Kong, X. (2019) · Food & Function · doi:10.1039/c9fo00520j · Cited by 37
García‐Carrizo, F., Cannon, B., Nedergaard, J., Picó, C., Dols, A., Rodríguez, A. M., & Palou, A. (2019) · International Journal of Obesity · doi:10.1038/s41366-019-0445-6 · Cited by 38
Wang, W., Chen, D., Yu, B., Huang, Z., Mao, X., Zheng, P., Luo, Y., Yu, J., Luo, J., Yan, H., et al. (2020) · British Journal Of Nutrition · doi:10.1017/s0007114520001130 · Cited by 37
In vitro human colonic microbiota utilises D-β-hydroxybutyrate to increase butyrogenesis
Sasaki, K., Sasaki, D., Hannya, A., Tsubota, J., & Kondo, A. (2020) · Scientific Reports · doi:10.1038/s41598-020-65561-5 · Cited by 37
Gut Microbiota and Cardiovascular Diseases
Anselmi, G., Gagliardi, L., Egidi, G., Leone, S., Gasbarrini, A., Miggiano, G. A. D., & Galiuto, L. (2020) · Cardiology in Review · doi:10.1097/crd.0000000000000327 · Cited by 37
Metadata
- Authors
- Gao, Z., Yin, J., Zhang, J., Ward, R. E., Martin, R. J., Lefevre, M., Cefalu, W. T., & Ye, J.
- Affiliations
- Antioxidant and Gene Regulation Laboratory, Pennington Biomedical Research Center, Louisiana State University System, Baton Rouge, Louisiana;
- Pennington Biomedical Research Center (US)
- Utah State University (US)
- Corresponding author
- Ye, Jianping
- Venue
- Diabetes
- Publisher
- American Diabetes Association
- Published
- 2009-04-14
- Volume
- 58
- Issue
- 7
- Pages
- 1509-1517
- ISSN
- 0012-1797 (ISSN-L)
- 1939-327X
- PMC
- PMC2699871
- OpenAlex
- W2101209169
- Cited by
- 2,204
- References
- 38
- Citations by year
- 2026: 129 · 2025: 187 · 2024: 200 · 2023: 198 · 2022: 213 · 2021: 206 · 2020: 229 · 2019: 168 · 2018: 149 · 2017: 115 · 2016: 119 · 2015: 98 · 2014: 58 · 2013: 43 · 2012: 33
- FWCI
- 12.09
- Type
- journal article
- Language
- en
- Open access
- hybrid
- doi.org
- Licence
- Locations
- Diabetes (publishedVersion, cc-by-nc-nd)
- Europe PMC (PubMed Central) (publishedVersion, cc-by-nc-nd)
- PubMed Central (publishedVersion, cc-by-nc-nd)
- PubMed (publishedVersion)
- Funders
- American Diabetes Association
- National Institutes of Health (DK072476)
- National Institute of Diabetes and Digestive and Kidney Diseases (DK072476, R56DK068036, R01DK068036, DK 68036, P30DK072476)
- National Center for Complementary and Integrative Health (P50AT002776, P50 AT02776-020002)
- Topics
- Life Sciences › Biochemistry, Genetics and Molecular Biology › Molecular Biology › Gut microbiota and health
- Health Sciences › Medicine › Physiology (medical) › Adipose Tissue and Metabolism
- Health Sciences › Medicine › Endocrinology, Diabetes and Metabolism › Adipokines, Inflammation, and Metabolic Diseases
- Keywords
- butyrate, short-chain fatty acids, insulin sensitivity, insulin resistance, energy expenditure, high-fat diet, obesity, thermogenesis, mitochondrial biogenesis, brown adipose tissue, skeletal muscle, AMPK, p38 MAPK, PGC-1α, type I muscle fibers, gut fermentation, dietary supplementation
- MeSH terms
- Peroxisome Proliferator-Activated Receptor Gamma Coactivator 1-alpha, Animals, Body Temperature, Adipose Tissue, Brown, Butyrates, Dietary Fats, Energy Metabolism, Histone Deacetylases, Insulin, Insulin Resistance, Mice, Inbred C57BL, Mitochondria, Muscle, Obesity, Transcription Factors, Trans-Activators, Muscle, Skeletal, Muscle Fibers, Skeletal, Reverse Transcriptase Polymerase Chain Reaction, Metabolic Syndrome, Mice
About these checks
Registry, retraction, Cites and statistics results are computed, not judged, with one exception: a printed reference that no index lists is read once by a model before it counts as a citation error. Claims are extracted by a model and kept only when their quote appears verbatim in the text; each cited source is then checked, with a model’s help, for whether it says what the claim relies on. Those verdicts can be wrong — read the claim’s quote and the cited source before relying on one.
Statistics and arithmetic are recomputed, not judged.
Confidence bands are shown only for fields calibrated on our annotated test set. None is calibrated yet, so no band is shown.
What counts as a claim ›How we measure confidence ›How we check this ›
Are you an author, or do you see a problem with this page? Request a review
