

The DOI matches its Crossref record; 47 of the 48 references it cites were found in a registry or an index.
Flavonoid Apigenin Is an Inhibitor of the NAD+ase CD38
Open accessAbstract
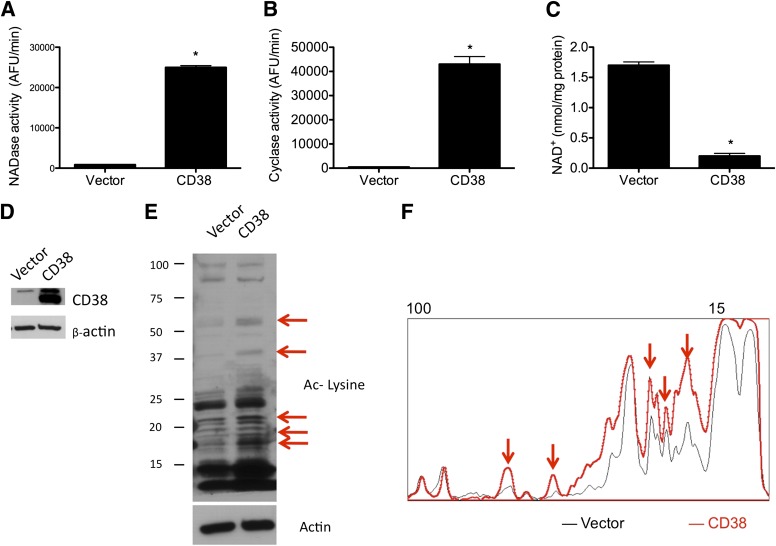
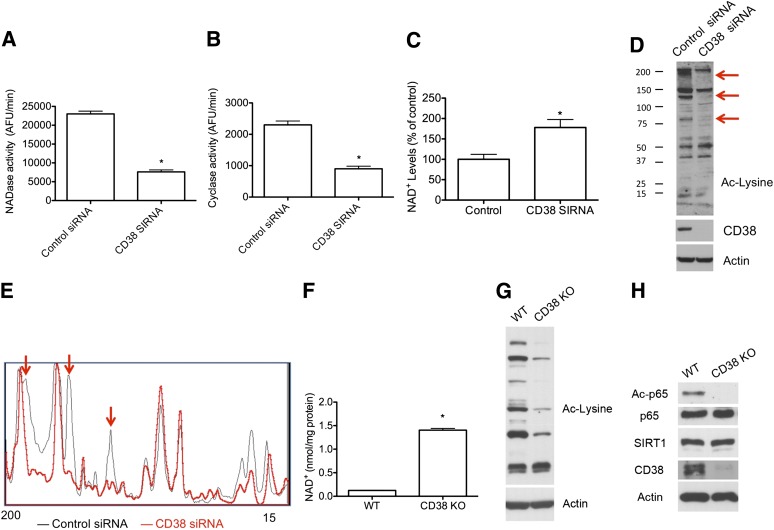
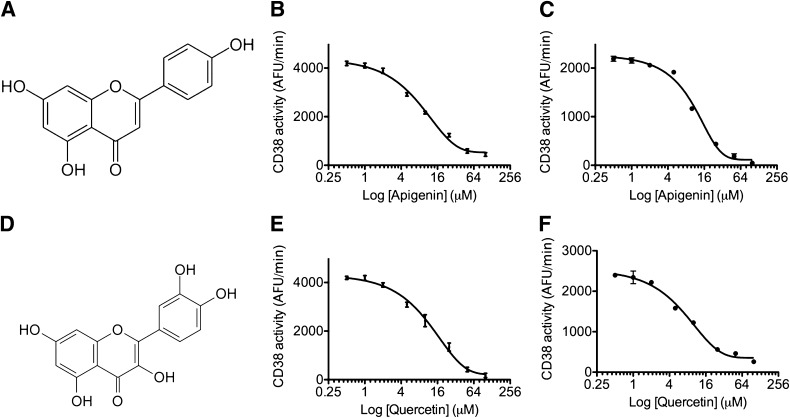
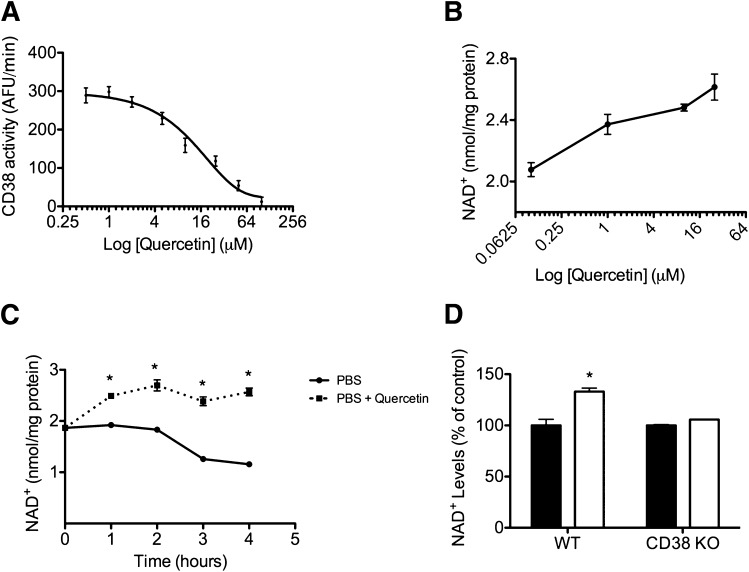
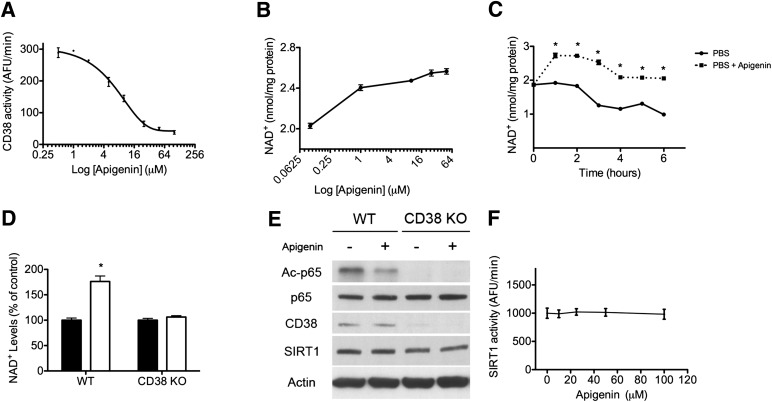
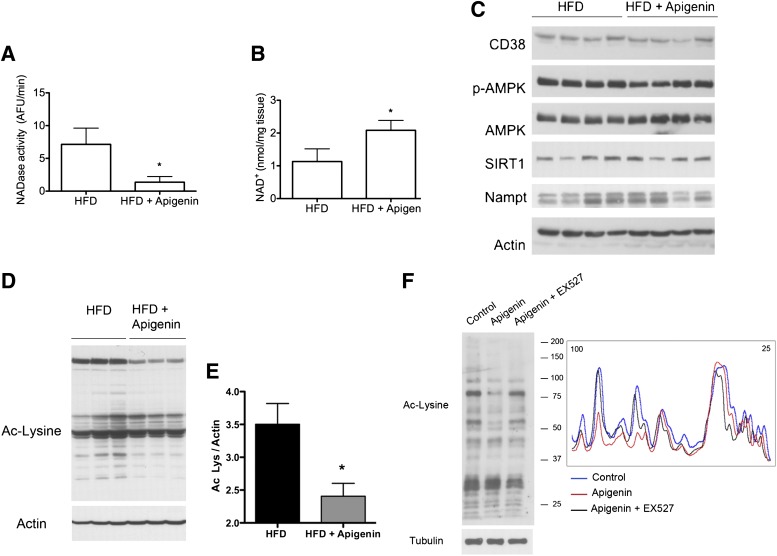
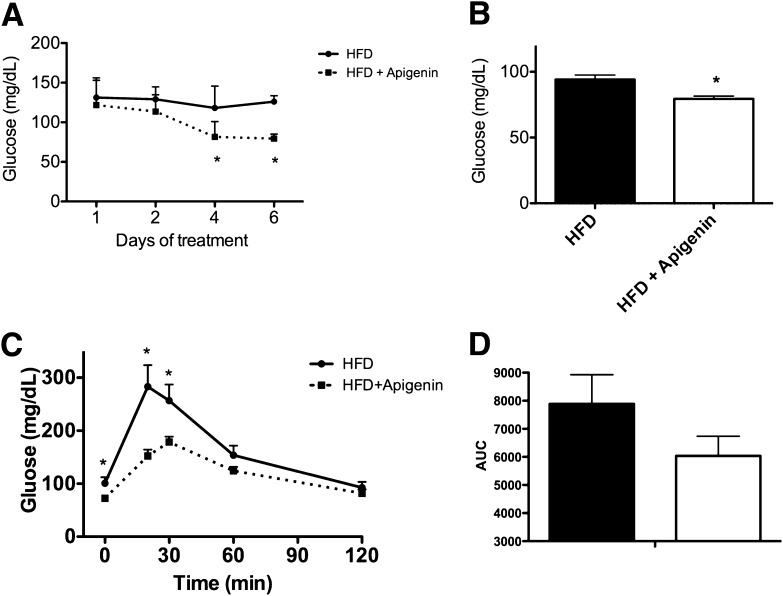
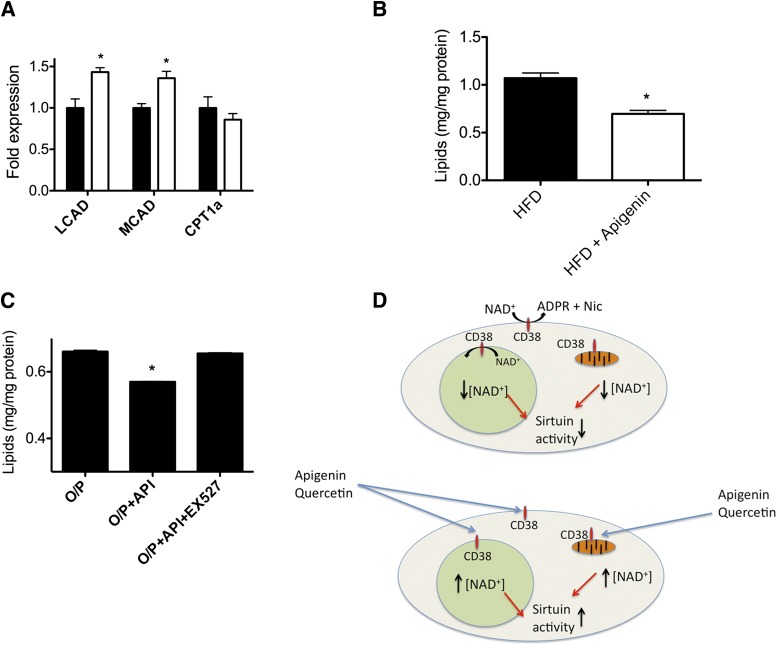
Metabolic syndrome is a growing health problem worldwide. It is therefore imperative to develop new strategies to treat this pathology. In the past years, the manipulation of NAD+ metabolism has emerged as a plausible strategy to ameliorate metabolic syndrome. In particular, an increase in cellular NAD+ levels has beneficial effects, likely because of the activation of sirtuins. Previously, we reported that CD38 is the primary NAD+ase in mammals. Moreover, CD38 knockout mice have higher NAD+ levels and are protected against obesity and metabolic syndrome. Here, we show that CD38 regulates global protein acetylation through changes in NAD+ levels and sirtuin activity. In addition, we characterize two CD38 inhibitors: quercetin and apigenin. We show that pharmacological inhibition of CD38 results in higher intracellular NAD+ levels and that treatment of cell cultures with apigenin decreases global acetylation as well as the acetylation of p53 and RelA-p65. Finally, apigenin administration to obese mice increases NAD+ levels, decreases global protein acetylation, and improves several aspects of glucose and lipid homeostasis. Our results show that CD38 is a novel pharmacological target to treat metabolic diseases via NAD+-dependent pathways.
Overview
The claims and statistics of this paper haven’t been checked yet.
Run the check — free, no account needed. It reads the open-access text and checks the sources it cites.
Integrity signals
Registry
Cites
Statistics
Figures
Verification
Claims the paper makes
The claims and statistics of this paper haven’t been checked yet.
Run the check — free, no account needed. It reads the open-access text and checks the sources it cites.
Claims other papers make about this one
Each is checked against this paper’s own text: does it say what the citing paper says it does?
In the citing paper
“For example, apigenin, a naturally occurring flavonoid, enhances NAD+ levels in human cells and mouse liver tissue, and improves glucose and lipid homeostasis in mouse models of obesity226.”
From NAD+ metabolism and its roles in cellular processes during ageing (2021) · cites this paper as [226]
In the citing paper
“For example, apigenin, a naturally occurring flavonoid, enhances NAD+ levels in human cells and mouse liver tissue, and improves glucose and lipid homeostasis in mouse models of obesity226.”
From NAD+ metabolism and its roles in cellular processes during ageing (2021) · cites this paper as [226]
In the citing paper
“have been implicated in the regulation of chromosomal integrity, DNA damage repair, metabolism, aging, health span, and longevity”
From A Potent and Specific CD38 Inhibitor Ameliorates Age-Related Metabolic Dysfunction by Reversing Tissue NAD+ Decline (2018) · cites this paper as Escande et al., 2013
In the citing paper
“Sirtuins are enzymes that remove specific covalent modification in lysine residues, such as acetylation, malonylation, and succinylation, in several proteins”
From A Potent and Specific CD38 Inhibitor Ameliorates Age-Related Metabolic Dysfunction by Reversing Tissue NAD+ Decline (2018) · cites this paper as Escande et al., 2013
Self-check
Percentages, sums and reported differences re-computed from the paper’s own numbers.
The self-check needs the paper’s full text.
Citations
Cites
Eckel, R. H., Alberti, K., Grundy, S. M., & Zimmet, P. (2010) · The Lancet · doi:10.1016/s0140-6736(09)61794-3 · Cited by 6,317
Eckel, R. H., Grundy, S. M., & Zimmet, P. (2005) · The Lancet · doi:10.1016/s0140-6736(05)66378-7 · Cited by 5,755
Prevalence of overweight and obesity among US children, adolescents, and adults, 1999-2002.
Hedley, A. A., Ogden, C., Johnson, C. L., Carroll, M., Curtin, L. R., & Flegal, K. (2004) · Journal of the American Medical Association (JAMA) · doi:10.1001/jama.291.23.2847 · Cited by 4,670
Global nutrition transition and the pandemic of obesity in developing countries
Popkin, B. M., Adair, L. S., & Ng, S. W. (2012) · Nutrition Reviews · doi:10.1111/j.1753-4887.2011.00456.x · Cited by 4,313
Resveratrol improves health and survival of mice on a high-calorie diet
Baur, J. A., Pearson, K. J., Price, N. L., Jamieson, H. A., Lerin, C., Kalra, A., Prabhu, V. V., Allard, J. S., Lopez-Lluch, G., Lewis, K., et al. (2006) · Nature · doi:10.1038/nature05354 · Cited by 4,290
Self-citationSmall molecule activators of sirtuins extend Saccharomyces cerevisiae lifespan
Howitz, K. T., Bitterman, K. J., Cohen, H. Y., Lamming, D. W., Lavu, S., Wood, J. G., Zipkin, R. E., Chung, P., Kisielewski, A., Zhang, L.-L., et al. (2003) · Nature · doi:10.1038/nature01960 · Cited by 3,796
Self-citationTranscriptional silencing and longevity protein Sir2 is an NAD-dependent histone deacetylase
Imai, S.-I., Armstrong, C. M., Kaeberlein, M., & Guarente, L. (2000) · Nature · doi:10.1038/35001622 · Cited by 3,510
Nutrient control of glucose homeostasis through a complex of PGC-1α and SIRT1
Rodgers, J. T., Lerin, C., Haas, W., Gygi, S. P., Spiegelman, B. M., & Puigserver, P. (2005) · Nature · doi:10.1038/nature03354 · Cited by 3,160
Modulation of NF‐κB‐dependent transcription and cell survival by the SIRT1 deacetylase
Yeung, F., Hoberg, J. E., Ramsey, C. S., Keller, M. D., Jones, D. R., Frye, R. A., & Mayo, M. W. (2004) · The EMBO Journal · doi:10.1038/sj.emboj.7600244 · Cited by 2,750
hSIR2SIRT1 Functions as an NAD-Dependent p53 Deacetylase
Vaziri, H., Dessain, S. K., Eaton, E. N., Imai, S., Frye, R. A., Pandita, T. K., Guarente, L., & Weinberg, R. A. (2001) · Cell · doi:10.1016/s0092-8674(01)00527-x · Cited by 2,690
Haberland, M., Montgomery, R. L., & Olson, E. N. (2008) · Nature Reviews Genetics · doi:10.1038/nrg2485 · Cited by 2,600
D IETARY F LAVONOIDS : Bioavailability, Metabolic Effects, and Safety
Ross, J. A., & Kasum, C. M. (2002) · Annual Review of Nutrition · doi:10.1146/annurev.nutr.22.111401.144957 · Cited by 2,153
Mammalian Sirtuins: Biological Insights and Disease Relevance
Haigis, M. C., & Sinclair, D. A. (2010) · Annual Review of Pathology: Mechanisms of Disease · doi:10.1146/annurev.pathol.4.110807.092250 · Cited by 2,085
Self-citationSmall molecule activators of SIRT1 as therapeutics for the treatment of type 2 diabetes
Milne, J. C., Lambert, P. D., Schenk, S., Carney, D. P., Smith, J. J., Gagne, D. J., Jin, L., Boss, O., Perni, R. B., Vu, C. B., et al. (2007) · Nature · doi:10.1038/nature06261 · Cited by 1,707
Self-citationPrice, N. L., Gomes, A. P., Ling, A. J. Y., Duarte, F. V., Martin-Montalvo, A., North, B. J., Agarwal, B., Ye, L., Ramadori, G., Teodoro, J. S., et al. (2012) · Cell Metabolism · doi:10.1016/j.cmet.2012.04.003 · Cited by 1,602
Self-citationYoshino, J., Mills, K. F., Yoon, M. J., & Imai, S.-I. (2011) · Cell Metabolism · doi:10.1016/j.cmet.2011.08.014 · Cited by 1,340
Grundy, S. M. (2010) · Springer eBooks · doi:10.1007/978-1-4419-5839-6_1 · Cited by 1,227
Mechanism of Human SIRT1 Activation by Resveratrol
Borra, M. T., Smith, B. C., & Denu, J. M. (2005) · Journal of Biological Chemistry · doi:10.1074/jbc.m501250200 · Cited by 1,065
Fong, P. C. C., Yap, T. A., Boss, D. S., Carden, C. P., Mergui‐Roelvink, M., Gourley, C., Grève, J. D., Lubiński, J., Shanley, S., Messiou, C., et al. (2010) · Journal of Clinical Oncology · doi:10.1200/jco.2009.26.9589 · Cited by 1,022
SRT1720, SRT2183, SRT1460, and resveratrol are not direct activators of SIRT1
Pacholec, M., Bleasdale, J. E., Chrunyk, B., Cunningham, D., Flynn, D., Garofalo, R. S., Griffith, D., Griffor, M., Loulakis, P., Pabst, B., et al. (2010) · Journal of Biological Chemistry · doi:10.1074/jbc.m109.088682 · Cited by 915
PARP-1 inhibition increases mitochondrial metabolism through SIRT1 activation
Bai, P., Cantó, C., Oudart, H., Brunyánszki, A., Cen, Y., Thomas, C., Yamamoto, H., Huber, A., Kiss, B., Houtkooper, R. H., et al. (2011) · Cell Metabolism · doi:10.1016/j.cmet.2011.03.004 · Cited by 837
Sirt1 protects against high-fat diet-induced metabolic damage
Pfluger, P. T., Herranz, D., Velasco-Miguel, S., Serrano, M., & Tschöp, M. H. (2008) · Proceedings of the National Academy of Sciences · doi:10.1073/pnas.0802917105 · Cited by 818
Zang, M., Xu, S., Maitland, K. A., Zuccollo, A., Hou, X., Jiang, B., Wierzbicki, M., Verbeuren, T. J., & Cohen, R. A. (2006) · Diabetes · doi:10.2337/db05-1188 · Cited by 672
Fasting-dependent glucose and lipid metabolic response through hepatic sirtuin 1
Rodgers, J. T., & Puigserver, P. (2007) · Proceedings of the National Academy of Sciences · doi:10.1073/pnas.0702509104 · Cited by 466
Regulation of intracellular levels of NAD: A novel role for CD38
Aksoy, P., White, T. A., Thompson, M., & Chini, E. N. (2006) · Biochemical and Biophysical Research Communications · doi:10.1016/j.bbrc.2006.05.042 · Cited by 364
Self-citationSirtuins mediate mammalian metabolic responses to nutrient availability
Chalkiadaki, A., & Guarente, L. (2012) · Nature Reviews Endocrinology · doi:10.1038/nrendo.2011.225 · Cited by 344
Li, Y., Xu, S., Giles, A. J., Nakamura, K., Lee, J. W., Hou, X., Dönmez, G., Li, J., Luo, Z., Walsh, K. X., et al. (2011) · The FASEB Journal · doi:10.1096/fj.10-173492 · Cited by 305
Barbosa, M. T., Soares, S. M., Novak, C. M., Sinclair, D. A., Levine, J. A., Aksoy, P., & Chini, E. N. (2007) · The FASEB Journal · doi:10.1096/fj.07-8290com · Cited by 252
Self-citationXu, F. L., Gao, Z., Zhang, J., Rivera, C. A., Yin, J., Weng, J., & Ye, J. (2010) · Endocrinology · doi:10.1210/en.2009-1013 · Cited by 221
Lee, J., Zhou, H. Y., Cho, S. Y., Kim, Y. S., Lee, Y. S., & Jeong, C. S. (2007) · Archives of Pharmacal Research · doi:10.1007/bf02980273 · Cited by 220
Birt, D. F., Mitchell, D. L., Gold, B. I., Pour, P. M., & Pinch, H. C. (1997) · PubMed · Cited by 201
Escande, C., Chini, C. C. S., Nin, V., Dykhouse, K. M., Novak, C. M., Levine, J. A., van Deursen, J., Gores, G. J., Chen, J., Lou, Z., et al. (2010) · Journal of Clinical Investigation · doi:10.1172/jci39319 · Cited by 190
Self-citationAksoy, P., Escande, C., White, T. A., Thompson, M., Soares, S. M., Benech, J. C., & Chini, E. N. (2006) · Biochemical and Biophysical Research Communications · doi:10.1016/j.bbrc.2006.08.066 · Cited by 178
Self-citationRossi, M. N., Carbone, M., Mostocotto, C., Mancone, C., Tripodi, M., Maione, R., & Amati, P. (2009) · Journal of Biological Chemistry · doi:10.1074/jbc.m109.025882 · Cited by 163
Poly(ADP-Ribose) Polymerase Inhibition: “Targeted” Therapy for Triple-Negative Breast Cancer
Anders, C. K., Winer, E. P., Ford, J. M., Dent, R. A., Silver, D. P., Sledge, G. W., & Carey, L. (2010) · Clinical Cancer Research · doi:10.1158/1078-0432.ccr-10-0939 · Cited by 159
Yamazaki, Y., Usui, I., Kanatani, Y., Matsuya, Y., Tsuneyama, K., Fujisaka, S., Bukhari, A., Suzuki, H., Senda, S., Imanishi, S., et al. (2009) · American Journal of Physiology-Endocrinology and Metabolism · doi:10.1152/ajpendo.90997.2008 · Cited by 137
Expression of c-erbB receptors, heregulin and oestrogen receptor in human breast cell lines
DeFazio, A., Chiew, Y.-E., Sini, R. L., Janes, P. W., & Sutherland, R. L. (2000) · International Journal of Cancer · doi:10.1002/1097-0215(20000815)87:4 · Cited by 136
Hwang, Y. P., Oh, K. N., Yun, H. J., & Jeong, H. G. (2010) · Journal of Dermatological Science · doi:10.1016/j.jdermsci.2010.10.016 · Cited by 133
Ultrastructural localization of CD38 immunoreactivity in rat brain
Yamada, M., Mizuguchi, M., Otsuka, N., Ikeda, K., & Takahashi, H. (1997) · Brain Research · doi:10.1016/s0006-8993(97)00117-0 · Cited by 111
Apigenin Induces Apoptosis in Human Leukemia Cells and Exhibits Anti-Leukemic Activity In Vivo
Budhraja, A., Gao, N., Zhang, Z., Son, Y., Cheng, S., Wang, X., Ding, S., Hitron, J. A., Chen, G., Luo, J., et al. (2011) · Molecular Cancer Therapeutics · doi:10.1158/1535-7163.mct-11-0343 · Cited by 105
Flavonoids as inhibitors of human CD38
Kellenberger, E., Kuhn, I., Schuber, F. J., & Muller‐Steffner, H. (2011) · Bioorganic & Medicinal Chemistry Letters · doi:10.1016/j.bmcl.2011.05.022 · Cited by 104
Lapucci, A., Pittelli, M. G., Rapizzi, E., Felici, R., Moroni, F., & Chiarugi, A. (2011) · Molecular Pharmacology · doi:10.1124/mol.110.070110 · Cited by 65
Kang, O., Lee, J. H., & Kwon, D. (2010) · Immunopharmacology and Immunotoxicology · doi:10.3109/08923973.2010.538851 · Cited by 60
Synthesis of NAADP and cADPR in Mitochondria
Liang, M., Chini, E. N., Cheng, J., & Dousa, T. P. (1999) · Archives of Biochemistry and Biophysics · doi:10.1006/abbi.1999.1463 · Cited by 53
Self-citationExecutive summary of the Strategic Plan for National Institutes of Health Obesity Research
Spiegel, A. M., & Alving, B. M. (2005) · American Journal of Clinical Nutrition · doi:10.1093/ajcn/82.1.221s · Cited by 41
Suou, K., Taniguchi, F., Tagashira, Y., Kiyama, T., Terakawa, N., & Harada, T. (2010) · Fertility and Sterility · doi:10.1016/j.fertnstert.2010.09.046 · Cited by 31
Executive summary of the Strategic Plan for National Institutes of Health Obesity Research
Spiegel, A. M., & Alving, B. M. (2005) · American Journal of Clinical Nutrition · doi:10.1093/ajcn/82.1.211s · Cited by 23
Cited by
Sorted by citations
Cantó, C., Menzies, K. J., & Auwerx, J. (2015) · Cell Metabolism · doi:10.1016/j.cmet.2015.05.023 · Cited by 1,648
NAD+ metabolism and its roles in cellular processes during ageing
Covarrubias, A. J., Perrone, R., Grozio, A., & Verdin, E. (2021) · Nature Reviews Molecular Cell Biology · doi:10.1038/s41580-020-00313-x · Cited by 1,617
NAD+ and sirtuins in aging and disease
Imai, S.-I., & Guarente, L. (2014) · Trends in Cell Biology · doi:10.1016/j.tcb.2014.04.002 · Cited by 1,481
Camacho-Pereira, J., Tarragó, M. G., Chini, C. C. S., Nin, V., Escande, C., Warner, G. M., Puranik, A. S., Schoon, R. A., Reid, J. M., Galina, A., et al. (2016) · Cell Metabolism · doi:10.1016/j.cmet.2016.05.006 · Cited by 901
Self-citationTherapeutic Potential of NAD-Boosting Molecules: The In Vivo Evidence
Rajman, L., Chwalek, K., & Sinclair, D. A. (2018) · Cell Metabolism · doi:10.1016/j.cmet.2018.02.011 · Cited by 865
Self-citation
Metadata
- Authors
- Escande, C., Nin, V., Price, N. L., Capellini, V., Gomes, A. P., Barbosa, M. T., O’Neil, L., White, T. A., Sinclair, D. A., & Chini, E. N.
- Affiliations
- Mayo Clinic (US)
- Department of Anesthesiology and Kogod Aging Center Mayo Clinic, Rochester, Minnesota
- Harvard University (US)
- Corresponding author
- Chini, Eduardo N.
- ORCID
- Venue
- Diabetes
- Publisher
- American Diabetes Association
- Published
- 2013-03-14
- Volume
- 62
- Issue
- 4
- Pages
- 1084-1093
- ISSN
- 0012-1797 (ISSN-L)
- 1939-327X
- PMC
- PMC3609577
- OpenAlex
- W2112866277
- Cited by
- 332
- References
- 48
- Citations by year
- 2026: 27 · 2025: 20 · 2024: 30 · 2023: 17 · 2022: 37 · 2021: 38 · 2020: 33 · 2019: 23 · 2018: 31 · 2017: 25 · 2016: 17 · 2015: 18 · 2014: 11 · 2013: 5
- FWCI
- 5.35
- Type
- journal article
- Language
- en
- Update notices
- correction (2014-04-01)
- Open access
- hybrid
- doi.org
- Licence
- Locations
- Diabetes (publishedVersion, cc-by-nc-nd)
- Europe PMC (PubMed Central) (publishedVersion, cc-by-nc-nd)
- PubMed Central (publishedVersion, cc-by-nc-nd)
- PubMed (publishedVersion)
- Digital Access to Scholarship at Harvard (DASH) (Harvard University) (submittedVersion, cc-by)
- Funders
- National Institute on Aging (R37AG028730, T32AG000222)
- National Institute of Diabetes and Digestive and Kidney Diseases (P30DK050456, R01DK084055)
- Topics
- Health Sciences › Medicine › Geriatrics and Gerontology › Sirtuins and Resveratrol in Medicine
- Health Sciences › Medicine › Endocrinology, Diabetes and Metabolism › Natural Antidiabetic Agents Studies
- Life Sciences › Biochemistry, Genetics and Molecular Biology › Molecular Biology › Biochemical and Molecular Research
- Keywords
- apigenin, CD38, NAD+ metabolism, sirtuins, protein acetylation, quercetin, metabolic syndrome, obesity, p53 acetylation, glucose homeostasis, lipid homeostasis, flavonoids, CD38 inhibitors
- MeSH terms
- Animals, Gene Expression Regulation, Humans, Mice, Inbred C57BL, NAD, Obesity, Quercetin, Random Allocation, Molecular Structure, Mice, Knockout, Metabolic Syndrome, Cell Line, Tumor, Apigenin, Mice, ADP-ribosyl Cyclase 1, Sirtuin 1
About these checks
Registry, retraction, Cites and statistics results are computed, not judged, with one exception: a printed reference that no index lists is read once by a model before it counts as a citation error. Claims are extracted by a model and kept only when their quote appears verbatim in the text; each cited source is then checked, with a model’s help, for whether it says what the claim relies on. Those verdicts can be wrong — read the claim’s quote and the cited source before relying on one.
Statistics and arithmetic are recomputed, not judged.
Confidence bands are shown only for fields calibrated on our annotated test set. None is calibrated yet, so no band is shown.
What counts as a claim ›How we measure confidence ›How we check this ›
Are you an author, or do you see a problem with this page? Request a review
