

The DOI matches its Crossref record; 54 of the 54 references it cites were found in a registry or an index.
Circadian Regulation of Lipid Mobilization in White Adipose Tissues
Open accessAbstract
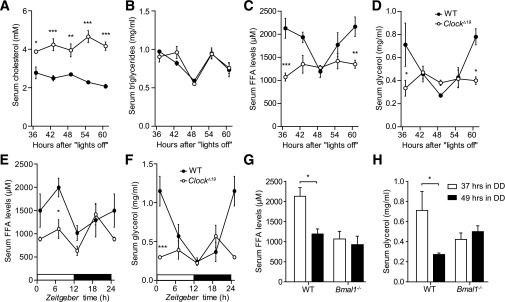
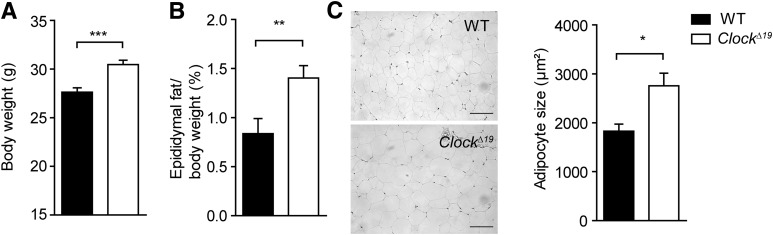
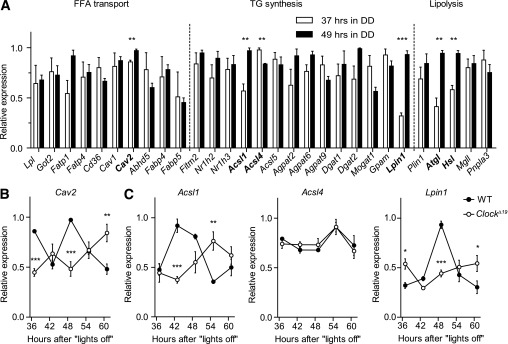
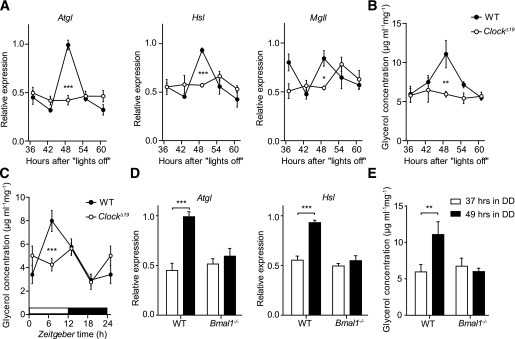
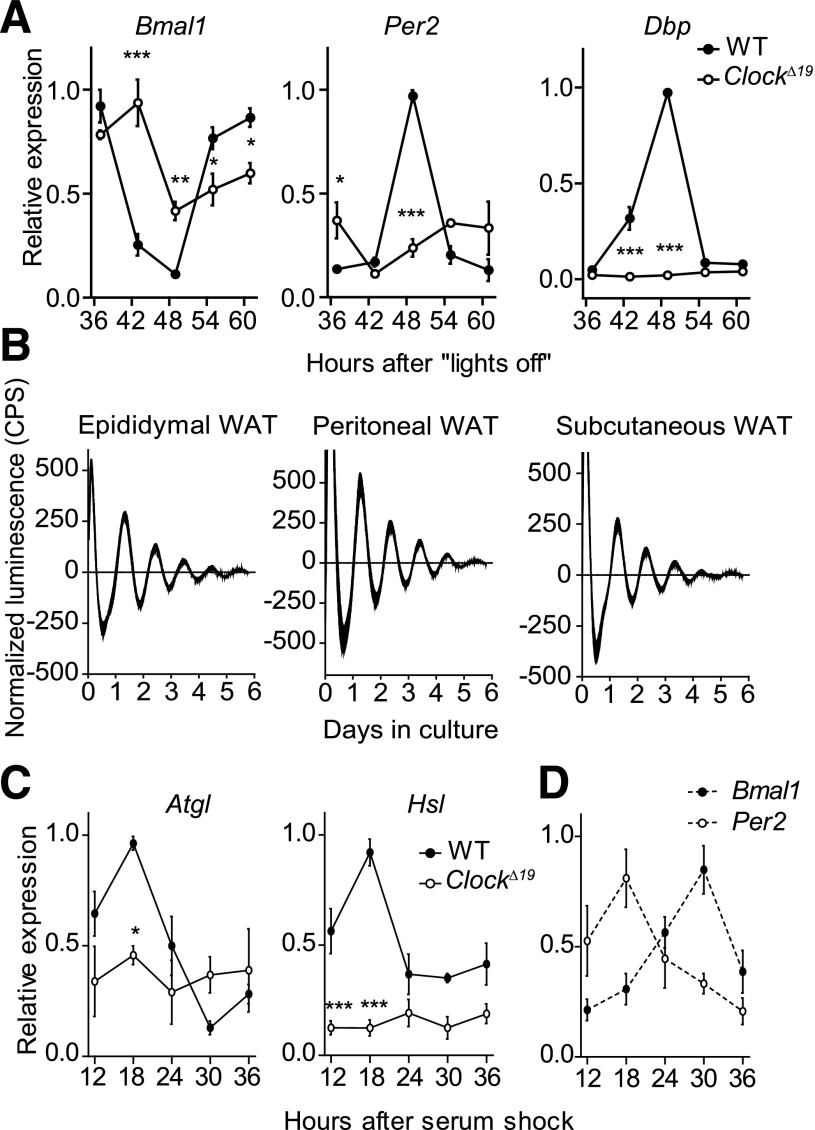
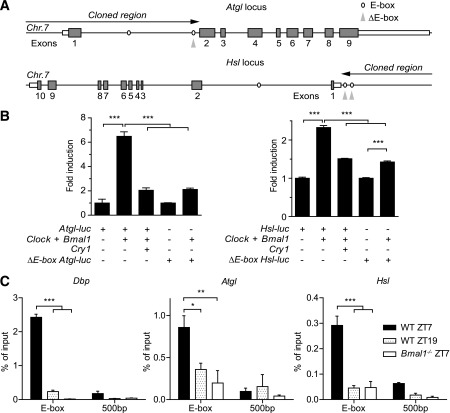
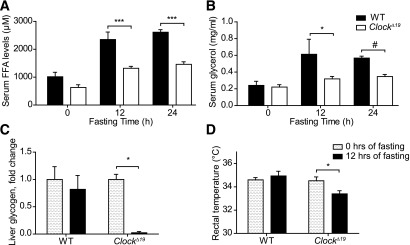
In mammals, a network of circadian clocks regulates 24-h rhythms of behavior and physiology. Circadian disruption promotes obesity and the development of obesity-associated disorders, but it remains unclear to which extent peripheral tissue clocks contribute to this effect. To reveal the impact of the circadian timing system on lipid metabolism, blood and adipose tissue samples from wild-type, ClockΔ19, and Bmal1(-/-) circadian mutant mice were subjected to biochemical assays and gene expression profiling. We show diurnal variations in lipolysis rates and release of free fatty acids (FFAs) and glycerol into the blood correlating with rhythmic regulation of two genes encoding the lipolysis pacemaker enzymes, adipose triglyceride (TG) lipase and hormone-sensitive lipase, by self-sustained adipocyte clocks. Circadian clock mutant mice show low and nonrhythmic FFA and glycerol blood content together with decreased lipolysis rates and increased sensitivity to fasting. Instead circadian clock disruption promotes the accumulation of TGs in white adipose tissue (WAT), leading to increased adiposity and adipocyte hypertrophy. In summary, circadian modulation of lipolysis rates regulates the availability of lipid-derived energy during the day, suggesting a role for WAT clocks in the regulation of energy homeostasis.
Overview
The claims and statistics of this paper haven’t been checked yet.
Run the check — free, no account needed. It reads the open-access text and checks the sources it cites.
Integrity signals
Registry
Cites
Statistics
Figures
Verification
Claims the paper makes
The claims and statistics of this paper haven’t been checked yet.
Run the check — free, no account needed. It reads the open-access text and checks the sources it cites.
Claims other papers make about this one
Each is checked against this paper’s own text: does it say what the citing paper says it does?
In the citing paper
“For example, the hepatic clock regulates fasting glycemic control and glucose clearance (8), the pancreatic clock regulates insulin secretion and its response to glucose (9-11), the adipose clock regulates lipid storage and mobilization (12,13), and the skeletal muscle clock regulates glucose uptake and metabolism (14).”
From Circadian rhythms, metabolism, and chrononutrition in rodents and humans (2016) · cites this paper as [13]
Self-check
Percentages, sums and reported differences re-computed from the paper’s own numbers.
The self-check needs the paper’s full text.
Citations
Cites
Obesity and Metabolic Syndrome in Circadian Clock Mutant Mice
Turek, F. W., Joshu, C., Kohsaka, A., Lin, E., Ivanova, G., McDearmon, E., Laposky, A., Losee-Olson, S., Easton, A., Jensen, D. R., et al. (2005) · Science · doi:10.1126/science.1108750 · Cited by 2,485
Yoo, S.-H., Yamazaki, S., Lowrey, P. L., Shimomura, K., Ko, C. H., Buhr, E. D., Siepka, S. M., Hong, H.-K., Oh, W. J., Yoo, O. J., et al. (2004) · Proceedings of the National Academy of Sciences · doi:10.1073/pnas.0308709101 · Cited by 2,329
Coordinated Transcription of Key Pathways in the Mouse by the Circadian Clock
Panda, S., Antoch, M. P., Miller, B. H., Su, A. I., Schook, A. C., Straume, M., Schultz, P. G., Kay, S. A., Takahashi, J. S., & Hogenesch, J. B. (2002) · Cell · doi:10.1016/s0092-8674(02)00722-5 · Cited by 2,310
Fat Mobilization in Adipose Tissue Is Promoted by Adipose Triglyceride Lipase
Zimmermann, R., Bogner‐Strauß, J. G., Haemmerle, G., Schoiswohl, G., Birner‐Gruenberger, R., Riederer, M., Lass, A., Neuberger, G., Eisenhaber, F., Hermetter, A., et al. (2004) · Science · doi:10.1126/science.1100747 · Cited by 2,121
Hatori, M., Vollmers, C., Zarrinpar, A., DiTacchio, L., Bushong, E. A., Gill, S., Leblanc, M., Chaix, A., Joens, M., Fitzpatrick, J. A. J., et al. (2012) · Cell Metabolism · doi:10.1016/j.cmet.2012.04.019 · Cited by 1,986
Mutagenesis and Mapping of a Mouse Gene, Clock , Essential for Circadian Behavior
Vitaterna, M. H., King, D. P., Chang, A.-M., Kornhauser, J. M., Lowrey, P. L., McDonald, J. D., Dove, W. F., Pinto, L. H., Turek, F. W., & Takahashi, J. S. (1994) · Science · doi:10.1126/science.8171325 · Cited by 1,632
Mop3 is an essential component of the master circadian pacemaker in mammals.
Bunger, M. K., Wilsbacher, L. D., Moran, S. M., Clendenin, C., Radcliffe, L. A., Hogenesch, J. B., Simon, M. C., Takahashi, J. S., & Bradfield, C. A. (2000) · Cell · doi:10.1016/s0092-8674(00)00205-1 · Cited by 1,621
Disruption of the clock components CLOCK and BMAL1 leads to hypoinsulinaemia and diabetes
Marcheva, B., Ramsey, K. M., Buhr, E. D., Kobayashi, Y., Su, H., Ko, C. H., Ivanova, G., Omura, C., Mo, S., Vitaterna, M. H., et al. (2010) · Nature · doi:10.1038/nature09253 · Cited by 1,525
Extensive and divergent circadian gene expression in liver and heart
Storch, K.-F., Lipan, O., Leykin, I., Viswanathan, N., Davis, F. C., Wong, W. H., & Weitz, C. J. (2002) · Nature · doi:10.1038/nature744 · Cited by 1,509
Defective lipolysis and altered energy metabolism in mice lacking adipose triglyceride lipase
Haemmerle, G., Lass, A., Zimmermann, R., Gorkiewicz, G., Meyer, C., Rozman, J., Heldmaier, G., Maier, R., Theussl, C., Eder, S., et al. (2006) · Science · doi:10.1126/science.1123965 · Cited by 1,375
Cited by
Sorted by citations
Items 101–200 of 242
Mathew, D., Zhou, P., Pywell, C. M., van der Veen, D. R., Shao, J., Xi, Y., Bonar, N. A., Hummel, A. D., Chapman, S., Leevy, W. M., et al. (2013) · PLoS ONE · doi:10.1371/journal.pone.0073064 · Cited by 30
Kadiri, S., Monnier, C., Ganbold, M., Ledent, T., Capeau, J., & Antoine, B. (2015) · American Journal of Physiology-Endocrinology and Metabolism · doi:10.1152/ajpendo.00518.2014 · Cited by 30
Rodent Models for the Analysis of Tissue Clock Function in Metabolic Rhythms Research
Tsang, A. H. K., Astiz, M., Leinweber, B., & Oster, H. (2017) · Frontiers in Endocrinology · doi:10.3389/fendo.2017.00027 · Cited by 30
Self-citationDiurnal Regulation of Peripheral Glucose Metabolism: Potential Effects of Exercise Timing
Mancilla, R., Krook, A., Schrauwen, P., & Hesselink, M. K. C. (2020) · Obesity · doi:10.1002/oby.22811 · Cited by 29
Circadian regulation of digestive and metabolic tissues
Taleb, Z., & Karpowicz, P. A. (2022) · American Journal of Physiology-Cell Physiology · doi:10.1152/ajpcell.00166.2022 · Cited by 30
Chronodisruption enhances inflammatory cytokine release from visceral adipose tissue in obesity
Zinna, L., Verde, L., Tolla, M. F. D., Barrea, L., Parascandolo, A., D’Alterio, F., Colao, A. A. L., Formisano, P., D’Esposito, V., & Muscogiuri, G. (2025) · Journal of Translational Medicine · doi:10.1186/s12967-025-06250-7 · Cited by 30
Circadian Misalignment and Metabolic Consequences
Banks, S., Dorrian, J., Grant, C., & Coates, A. M. (2015) · Elsevier eBooks · doi:10.1016/b978-0-12-420168-2.00017-x · Cited by 30
Aguilar-Galarza, A., García-Gasca, T., Mejía, C., Díaz‐Muñoz, M., Pérez-Mendoza, M., Anaya‐Loyola, M. A., & Garaulet, M. (2020) · Clinical Nutrition · doi:10.1016/j.clnu.2020.10.030 · Cited by 30
Time-of-day and Meal Size Effects on Clinical Lipid Markers
Grant, L. K., Czeisler, C. A., Lockley, S. W., & Rahman, S. A. (2020) · The Journal of Clinical Endocrinology & Metabolism · doi:10.1210/clinem/dgaa739 · Cited by 27
The circadian clock control of adipose tissue physiology and metabolism
Lekkas, D., & Paschos, G. K. (2019) · Autonomic Neuroscience · doi:10.1016/j.autneu.2019.05.001 · Cited by 26
Xie, X., Zhang, M., & Luo, H. (2024) · Life Sciences · doi:10.1016/j.lfs.2024.122814 · Cited by 29
Chronodisruption, Metabolic Homeostasis, and the Regulation of Inflammation in Adipose Tissues.
Kolbe, I., & Oster, H. (2019) · PubMed Central · Cited by 27
Self-citationZhou, X., Wan, D., Zhang, Y.-M., Zhang, Y., Long, C., Chen, S., He, L., Tan, B., Wu, X., & Yin, Y. (2016) · Biochemical and Biophysical Research Communications · doi:10.1016/j.bbrc.2016.12.126 · Cited by 24
Circadian Rhythm: Biological Functions, Diseases, and Therapeutic Targets
Zha, K., Mi, B., Xiong, Y., Wu, S., Li, L., Zhang, S., Lu, X., Mak, H. C., Huang, J., Panayi, A. C., et al. (2025) · MedComm · doi:10.1002/mco2.70435 · Cited by 27
Rynders, C. A., Bergouignan, A., Kealey, E. H., & Bessesen, D. H. (2017) · Obesity · doi:10.1002/oby.21807 · Cited by 23
Konakchieva, R., Mladenov, M. I., Konaktchieva, M. N., Sazdova, I., Gagov, H., & Nikolaev, G. (2025) · International Journal of Molecular Sciences · doi:10.3390/ijms26136267 · Cited by 28
Effect of circadian clock disruption on type 2 diabetes
Tran, H. T., Kondo, T., Ashry, A., Fu, Y., Okawa, H., Sawangmake, C., & Egusa, H. (2024) · Frontiers in Physiology · doi:10.3389/fphys.2024.1435848 · Cited by 28
Henriksson, E., & Lamia, K. A. (2015) · Journal of Biological Rhythms · doi:10.1177/0748730415581234 · Cited by 23
Arredondo‐Amador, M., Zambrano, C., Kulyté, A., Luján, J., Hu, K., de Medina, F. S., Scheer, F. A. J. L., Arner, P., Rydén, M., Martínez‐Augustin, O., et al. (2020) · The Journal of Clinical Endocrinology & Metabolism · doi:10.1210/clinem/dgaa492 · Cited by 21
Rhythms of metabolism in adipose tissue and mitochondria
Onder, Y., & Green, C. B. (2018) · Neurobiology of Sleep and Circadian Rhythms · doi:10.1016/j.nbscr.2018.01.001 · Cited by 22
Circadian clock rhythms in different adipose tissue model systems
Friedrichs, M., Kolbe, I., Seemann, J., Tsang, A. H. K., Cherradi, L., Klein, J. C., & Oster, H. (2018) · Chronobiology International · doi:10.1080/07420528.2018.1494603 · Cited by 21
Self-citationImpact of circadian clock dysfunction on human health
Samanta, S., & Ali, S. A. (2022) · Exploration of neuroscience · doi:10.37349/en.2022.00002 · Cited by 21
Kim, E., Mawatari, K., Yoo, S. H., & Chen, Z. (2023) · Nutrients · doi:10.3390/nu15183919 · Cited by 21
Wharfe, M. D., Wyrwoll, C. S., Waddell, B. J., & Mark, P. J. (2016) · Endocrinology · doi:10.1210/en.2016-1177 · Cited by 20
Kessler, K., Hornemann, S., Petzke, K. J., Kemper, M., Markova, M., Rudovich, N. N., Grune, T., Kramer, A., Pfeiffer, A. F. H., & Pivovarova‐Ramich, O. (2018) · American Journal of Clinical Nutrition · doi:10.1093/ajcn/nqy224 · Cited by 19
Circadian Rhythm of Lipid Metabolism in Health and Disease
Zhang, Z., Xin, H., & Li, M. (2020) · Small Methods · doi:10.1002/smtd.201900601 · Cited by 21
Circadian Clock and Sirtuins in Diabetic Lung: A Mechanistic Perspective
Zhou, S., Dai, Y., Zeng, X., & Chen, H. (2020) · Frontiers in Endocrinology · doi:10.3389/fendo.2020.00173 · Cited by 21
Melatonin protects against body weight gain induced by sleep deprivation in mice
Hu, S., Liu, X., Wang, Y., Zhang, R., & Wei, S. (2022) · Physiology & Behavior · doi:10.1016/j.physbeh.2022.113975 · Cited by 20
Adipocyte GR Inhibits Healthy Adipose Expansion Through Multiple Mechanisms in Cushing Syndrome
Hayashi, R., Okuno, Y., Mukai, K., Kitamura, T., Hayakawa, T., Onodera, T., Murata, M., Fukuhara, A., Imamura, R., Miyagawa, Y., et al. (2019) · Endocrinology · doi:10.1210/en.2018-01029 · Cited by 20
Monnier, C., Auclair, M., Cam, G. L., Garcia, M., & Antoine, B. (2018) · Physiological Reports · doi:10.14814/phy2.13678 · Cited by 21
Zhang, C., Li, M., Li, L., Wan, C. C., Xia, Y., Ma, H., & Xu, J. (2025) · Food & Function · doi:10.1039/d5fo02046h · Cited by 24
Protocol for assessing ex vivo lipolysis of murine adipose tissue
Roy, D., Myers, J. M., & Tedeschi, A. (2022) · STAR Protocols · doi:10.1016/j.xpro.2022.101518 · Cited by 18
Kiranmala, K., Aslam, M., Mishra, B. K., Jhamb, R., & Madhu, S. V. (2019) · Experimental Physiology · doi:10.1113/ep087514 · Cited by 18
Kiriyama, K., Yamamoto, M., Kim, D., Sun, S., Yamamoto, H., & Oda, H. (2022) · British Journal Of Nutrition · doi:10.1017/s0007114522000356 · Cited by 17
Körner, C., Vlaic, S., Marbach-Breitrück, E., Thiel, C., Sales, S., Shevchenko, A., Gebhardt, R., & Matz‐Soja, M. (2018) · Frontiers in Physiology · doi:10.3389/fphys.2018.01180 · Cited by 18
Metabolomic Profiles of Shift Workers and Day Workers: A Cross‐Sectional Study
Huang, X., Chen, X., Zhao, S., Hou, J., Huang, L., Xu, J., Wang, W., He, M., Shen, O., & Zhang, J. (2021) · Obesity · doi:10.1002/oby.23164 · Cited by 17
Amatobi, K. M., Ozbek-Unal, A. G., Schäbler, S., Deppisch, P., Helfrich‐Förster, C., Mueller, M. J., Wegener, C., & Fekete, Á. (2023) · Journal of Lipid Research · doi:10.1016/j.jlr.2023.100417 · Cited by 16
Excessive fat expenditure in cachexia is associated with dysregulated circadian rhythm: a review
Ma, D., Li, X., Wang, Y., Cai, L., & Wang, Y. (2021) · Nutrition & Metabolism · doi:10.1186/s12986-021-00616-6 · Cited by 15
Li, T., Xu, L., Yan, Q., Liu, J., & Jiang, Z. (2022) · Food Science and Human Wellness · doi:10.1016/j.fshw.2022.03.033 · Cited by 17
Zong, J., Li, S., Wang, Y.-X., Mo, W., Sun, R., & Yu, M. (2019) · General and Comparative Endocrinology · doi:10.1016/j.ygcen.2019.05.011 · Cited by 16
Time-of-day-dependent adaptation of the HPA axis to predictable social defeat stress
Koch, C. E., Bartlang, M. S., Kiehn, J., Lucke, L., Naujokat, N., Helfrich‐Förster, C., Reber, S. O., & Oster, H. (2016) · Journal of Endocrinology · doi:10.1530/joe-16-0163 · Cited by 16
Self-citationOleic acid regulates the circadian rhythm of adipose tissue in obesity
Martín‐Reyes, F., Ho‐Plagaro, A., Rodriguez, C., Gomez, C. L., García‐Serrano, S., Reyes, D. R. D. L., Gonzalo, M., Fernández‐García, J. C., Montiel-Casado, C., Fernández-Aguilar, J. L., et al. (2022) · Pharmacological Research · doi:10.1016/j.phrs.2022.106579 · Cited by 15
Marot, L. P., Lopes, T. D. V. C., Balieiro, L. C. T., Crispim, C. A., & Moreno, C. R. D. C. (2023) · Nutrients · doi:10.3390/nu15112570 · Cited by 19
Romero, A. R., Mu, A., & Ayres, J. S. (2022) · iScience · doi:10.1016/j.isci.2022.103941 · Cited by 14
Obesity Disrupts the Rhythmic Profiles of Maternal and Fetal Progesterone in Rat Pregnancy
Crew, R. C., Mark, P. J., Clarke, M. W., & Waddell, B. J. (2016) · Biology of Reproduction · doi:10.1095/biolreprod.116.139451 · Cited by 15
Metabolic plasticity and obesity-associated changes in diurnal postexercise metabolism in mice
Pendergrast, L. A., Ashcroft, S. P., Ehrlich, A. M., Treebak, J. T., Krook, A., Dollet, L., & Zierath, J. R. (2024) · Metabolism · doi:10.1016/j.metabol.2024.155834 · Cited by 13
Aryl hydrocarbon receptor affects circadian-regulated lipolysis through an E-Box-dependent mechanism
Khazaal, A. Q., Haque, N., Krager, C. R., Krager, S. L., Chambers, C., Wilber, A. C., & Tischkau, S. A. (2022) · Molecular and Cellular Endocrinology · doi:10.1016/j.mce.2022.111809 · Cited by 14
Nio, Y., Hotta, N., Maruyama, M., Hamagami, K., Nagi, T., Funata, M., Sakamoto, J., Nakakariya, M., Amano, N., Okawa, T., et al. (2017) · Endocrinology · doi:10.1210/en.2016-1825 · Cited by 14
Rabadán-Chávez, G. M., de la Garza, R. I. D., & Jacobo‐Velázquez, D. A. (2023) · Biochimica et Biophysica Acta (BBA) - Molecular Basis of Disease · doi:10.1016/j.bbadis.2023.166853 · Cited by 15
Nutrients and the Circadian Clock: A Partnership Controlling Adipose Tissue Function and Health
Ribas‐Latre, A., & Eckel‐Mahan, K. L. (2022) · Nutrients · doi:10.3390/nu14102084 · Cited by 14
Circadian rhythms and clocks in adipose tissues: current insights
Kiehn, J., Koch, C. E., Walter, M., Brod, A., & Oster, H. (2017) · ChronoPhysiology and Therapy · doi:10.2147/cpt.s116242 · Cited by 13
Self-citationThe role of circadian gene CLOCK in cancer
Rashed, N., Liu, W., Zhou, X., Bode, A. M., & Luo, X. (2024) · Biochimica et Biophysica Acta (BBA) - Molecular Cell Research · doi:10.1016/j.bbamcr.2024.119782 · Cited by 12
Nobiletin promotes lipolysis of white adipose tissue in a circadian clock-dependent manner
Li, X., Zhuang, R., Lu, Z., Wu, F., Wu, X., Zhang, K., Wang, M., Li, W., Zhang, H., Zhu, W., et al. (2024) · The Journal of Nutritional Biochemistry · doi:10.1016/j.jnutbio.2024.109696 · Cited by 12
Meriin, A. B., Zaarur, N., Roy, D., & Kandror, K. V. (2022) · Frontiers in Cell and Developmental Biology · doi:10.3389/fcell.2022.1003030 · Cited by 13
Sphingolipids in adipose tissue: What's tipping the scale?
Lambert, J. M., Anderson, A. K., & Cowart, L. A. (2018) · Advances in Biological Regulation · doi:10.1016/j.jbior.2018.10.002 · Cited by 13
The Circadian Clock and Obesity
Sebti, Y., Hebras, A., Pourcet, B., Staels, B., & Duez, H. (2022) · Handbook of experimental pharmacology · doi:10.1007/164_2021_579 · Cited by 13
Exercise Training-Enhanced Lipolytic Potency to Catecholamine Depends on the Time of the Day
Kato, H., Ogasawara, J., Takakura, H., Shirato, K., Sakurai, T., Kizaki, T., & Izawa, T. (2020) · International Journal of Molecular Sciences · doi:10.3390/ijms21186920 · Cited by 11
Ma, D., Qu, Y., Wu, T., Liu, X., Cai, L., & Wang, Y. (2024) · Scientific Reports · doi:10.1038/s41598-024-58577-8 · Cited by 10
Kreuzer, K., Birkl-Toeglhofer, A. M., Haybaeck, J., Reiter, A., Dalkner, N., Fellendorf, F. T., Maget, A., Platzer, M., Seidl, M., Mendel, L.-M., et al. (2024) · Neuropsychobiology · doi:10.1159/000538781 · Cited by 11
Zhou, C., Hu, Z., Liu, X., Wang, Y., Wei, S., & Liu, Z. (2024) · Biochimica et Biophysica Acta (BBA) - Molecular and Cell Biology of Lipids · doi:10.1016/j.bbalip.2024.159530 · Cited by 9
Defining the brain control of physiological stability
Stevenson, T. J. (2024) · Hormones and Behavior · doi:10.1016/j.yhbeh.2024.105607 · Cited by 9
Yoshida, I., Mishima, T., Kumagai, M., Takahashi, Y., Fujita, K., & Igarashi, T. (2023) · Journal of Functional Foods · doi:10.1016/j.jff.2023.105649 · Cited by 9
Interaction of circadian and stress systems in the regulation of adipose physiology
Tsang, A. H. K., Kolbe, I., Seemann, J., & Oster, H. (2014) · Hormone Molecular Biology and Clinical Investigation · doi:10.1515/hmbci-2014-0020 · Cited by 9
Self-citationThe shades of grey in adipose tissue reprogramming
Qi, Y., & Hui, X. H. (2022) · Bioscience Reports · doi:10.1042/bsr20212358 · Cited by 9
Analysing the Expression of Eight Clock Genes in Five Tissues From Fasting and Fed Sows
Cardoso, T. F., Quintanilla, R., Castelló, A., Mármol‐Sánchez, E., Ballester, M., Jordana, J., & Amills, M. (2018) · Frontiers in Genetics · doi:10.3389/fgene.2018.00475 · Cited by 8
Ahn, C., Zhang, T., Rode, T., Yang, G., Chugh, O. K., Ellis, S., Ghayur, S., Mehta, S., Salzman, R. M., Jiang, H., et al. (2025) · The Journal of Physiology · doi:10.1113/jp289339 · Cited by 8
Keeping fat on time: Circadian control of adipose tissue
Hansen, S., Peics, J., & Gerhart‐Hines, Z. (2017) · Experimental Cell Research · doi:10.1016/j.yexcr.2017.03.045 · Cited by 12
Insulin under the influence of light
Ursino, G., & Coppari, R. (2020) · Swiss Medical Weekly · doi:10.4414/smw.2020.20273 · Cited by 8
Colom‐Pellicer, M., Rodríguez, R. M., Navarro‐Masip, È., Bravo, F. I., Mulero, M., Arola, L., & Aragonès, G. (2022) · International Journal of Obesity · doi:10.1038/s41366-022-01132-0 · Cited by 9
Snack timing affects tissue clock and metabolic responses in male mice
Begemann, K., & Oster, H. (2022) · Frontiers in Nutrition · doi:10.3389/fnut.2022.956641 · Cited by 7
Self-citationChronobiology and circadian rhythms establish a connection to diagnosis
Nydegger, U. E., Escobar, P. M., Risch, L., Risch, M., & Stanga, Z. G. (2014) · Diagnosis · doi:10.1515/dx-2014-0036 · Cited by 7
The Role of Circadian Clocks in Metabolism
Kim, K. J. (2019) · Chronobiology in Medicine · doi:10.33069/cim.2019.0017 · Cited by 7
Wyngene, L. V., Vanderhaeghen, T., Πέττα, Ι., Timmermans, S., Corbeels, K., der Schueren, B. V., Vandewalle, J., Looveren, K. V., Wallaeys, C., Eggermont, M., et al. (2021) · iScience · doi:10.1016/j.isci.2021.102790 · Cited by 7
Fan, Y., Lu, J., Jinghui, F., & Guan, S. (2023) · Food and Chemical Toxicology · doi:10.1016/j.fct.2023.113670 · Cited by 7
Salfer, I. J., Matamoros, C. I., Bartell, P. A., & Harvatine, K. J. (2023) · Journal of Dairy Science · doi:10.3168/jds.2022-22633 · Cited by 7
Zheng, S., Chen, Y., Zheng, X., Ma, D., Yan, X., Zhang, J., & Liu, C. (2025) · iScience · doi:10.1016/j.isci.2025.113654 · Cited by 7
Hansen, S. B., Frederiksen, J. S. S., Lodberg, A., Poulsen, M. F., Andersen, C. B. F., Oster, H., Jessen, N., & Jørgensen, J. O. L. (2025) · The Journal of Clinical Endocrinology & Metabolism · doi:10.1210/clinem/dgaf564 · Cited by 5
Self-citationTănăsescu, M., Rosu, A.-M., Mincă, A., Grigorie, M.-M., Timofte, D., & Ionescu, D. (2026) · Life · doi:10.3390/life16020305 · Cited by 9
Untargeted Metabolomics Reveals Alterations of Rhythmic Pulmonary Metabolism in IPF
Sun, W., Ren, J., Jia, Z., Liang, P., Li, S., Song, M., Cao, Y., Chen, H., Luo, Q., Yang, L., et al. (2023) · Metabolites · doi:10.3390/metabo13101069 · Cited by 6
Endocrine mechanisms controlling the migratory disposition in birds
Цвей, А. Л. (2023) · Proceedings of the Zoological Institute RAS · doi:10.31610/trudyzin/2023.327.4.683 · Cited by 6
Intramuscular adipocytes: a buried adipose tissue depot deserving more exploration
Begaye, L. J., & Simcox, J. (2019) · Journal of Lipid Research · doi:10.1194/jlr.c093047 · Cited by 6
Diurnal gene expression of lipolytic natriuretic peptide receptors in white adipose tissue
Smith, J. S., Fahrenkrug, J., Jørgensen, H. L., Christoffersen, C., & Goetze, J. P. (2015) · Endocrine Connections · doi:10.1530/ec-15-0074 · Cited by 6
Mota, M. C. (2017) · doi:10.14393/ufu.te.2018.486 · Cited by 6
Fatostatin ameliorates inflammation without affecting cell viability
Ma, S., Murakami, K., Tanaka, K., Hashimoto, M., Tanaka, M., Kitagori, K., Akizuki, S., Nakashima, R., Yoshifuji, H., Ohmura, K., et al. (2022) · FEBS Open Bio · doi:10.1002/2211-5463.13364 · Cited by 5
Daily Lipolysis Gene Expression in Male Rat Mesenteric Adipose Tissue: Obesity and Melatonin Effects
Cano, P., Jiménez‐Ortega, V., Fernández‐Mateos, P., Virto, L., Maldonado, E., Pérez‐Miguelsanz, J., & Esquifino, A. I. (2025) · International Journal of Molecular Sciences · doi:10.3390/ijms26020577 · Cited by 5
Makris, K. C., Konstantinou, C., Perikkou, A., Zdravic, A. B., & Christophi, C. A. (2019) · Environmental Research · doi:10.1016/j.envres.2019.109065 · Cited by 5
Circadian clock controlled glycolipid metabolism and its relevance to disease management
Lin, L., Huang, Y., Li, A., Cai, Y., Yan, Y., Huang, Y., He, L., Chen, Y., & Wang, S. (2025) · Biochemical Pharmacology · doi:10.1016/j.bcp.2025.116967 · Cited by 4
Regulation of hedonic feeding rhythms by circadian clocks in leptin-receptive neurons
Osorio-Mendoza, J., Kiehn, J., Stenger, S., Heinen, K. O., Griewahn, L., Koch, C. E., Haferkamp, U., Pilorz, V., Barclay, J. L., Joshi, P., et al. (2025) · Molecular Metabolism · doi:10.1016/j.molmet.2025.102221 · Cited by 5
Self-citationAdipose Tissue Circadian Clocks: Implications for Metabolism and Metabolic Dysfunction
Zeng, P., Hill, M. A., & Wu, J. (2025) · Obesity Reviews · doi:10.1111/obr.70071 · Cited by 4
Asgari, E., Shiraseb, F., Mirzababaei, A., Tangestani, H., & Mirzaei, K. (2023) · Clinical Nutrition Research · doi:10.7762/cnr.2023.12.1.7 · Cited by 4
The Impact of Metformin on Circadian Clock Genes
Vieira, E. C. (2014) · Journal of Diabetes Metabolic Disorders & Control · doi:10.15406/jdmdc.2014.01.00016 · Cited by 4
da Costa, T. N. F., Andreotti, S., de Farias, T. D. S. M., Lima, F. B., & Bargi‐Souza, P. (2020) · Journal of Biological Rhythms · doi:10.1177/0748730420949337 · Cited by 4
Effects of Circadian Disruption on Physiology and Pathology: From Bench to Clinic (and Back)
Chiesa, J. J., Duhart, J. M., Casiraghi, L. P., Paladino, N., Bussi, I. L., & Golombek, D. A. (2014) · Springer eBooks · doi:10.1007/978-3-319-08945-4_15 · Cited by 4
The Circadian Timing System and Endocrine Physiology
Sellix, M. T. (2016) · Springer eBooks · doi:10.1007/978-1-4939-3450-8_2 · Cited by 3
Relevance of Circadian Rhythm in Cancer
DiTacchio, L., DiTacchio, K. A., & Panda, S. (2015) · Energy balance and cancer · doi:10.1007/978-3-319-16733-6_1 · Cited by 3
Dietary interventions to combat obesity in metabolic syndrome - Role of time restricted eating
Srividya, N., Haldipur, A. C., & Sanjeevi, C. B. (2024) · Elsevier eBooks · doi:10.1016/b978-0-323-85732-1.00035-9 · Cited by 2
Ishii, H., Kitaura, S., Wada, T., & Shimba, S. (2025) · npj Biological Timing and Sleep · doi:10.1038/s44323-025-00023-7 · Cited by 2
BMAL2 controls adipose tissue inflammation and metabolic adaptation during obesity
Philippe, M., Fruchet, B., Cagninacci, L., Beaudoin, L., Gadault, A., Aznar, B., Venteclef, N., Challet, É., Lehuen, A., Rogner, U. C., et al. (2025) · Metabolism · doi:10.1016/j.metabol.2025.156396 · Cited by 2
Soliz‐Rueda, J. R., Kessler, K., Jürchott, K., Sticht, C., Hornemann, S., Kramer, A., Pfeiffer, A. F. H., & Pivovarova‐Ramich, O. (2026) · Food Research International · doi:10.1016/j.foodres.2026.118685 · Cited by 2
Nagata, N., Sugiyama, R., Kohno, S., Yamazaki, T., Arai, S., Sasaki, G., Xu, P., Morishige, J., Iba, T., Miyazaki, R., et al. (2026) · Endocrinology · doi:10.1210/endocr/bqag023 · Cited by 2
Metadata
- Authors
- Shostak, A., Meyer-Kovac, J., & Oster, H.
- Affiliations
- Max Planck Institute for Biophysical Chemistry (DE)
- Circadian Rhythms Group, Max Planck Institute for Biophysical Chemistry, Göttingen, Germany
- Corresponding author
- Oster, Henrik
- Venue
- Diabetes
- Publisher
- American Diabetes Association
- Published
- 2013-06-14
- Volume
- 62
- Issue
- 7
- Pages
- 2195-2203
- ISSN
- 0012-1797 (ISSN-L)
- 1939-327X
- PMC
- PMC3712056
- OpenAlex
- W2098360522
- Cited by
- 243
- References
- 54
- Citations by year
- 2026: 12 · 2025: 22 · 2024: 17 · 2023: 23 · 2022: 26 · 2021: 14 · 2020: 22 · 2019: 19 · 2018: 16 · 2017: 17 · 2016: 20 · 2015: 16 · 2014: 14 · 2013: 5
- FWCI
- 9.90
- Type
- journal article
- Language
- en
- Open access
- hybrid
- doi.org
- Licence
- Locations
- Diabetes (publishedVersion, cc-by-nc-nd)
- PubMed Central (publishedVersion, cc-by-nc-nd)
- PubMed (publishedVersion)
- MPG.PuRe (Max Planck Society) (submittedVersion)
- Topics
- Life Sciences › Neuroscience › Endocrine and Autonomic Systems › Circadian rhythm and melatonin
- Health Sciences › Medicine › Physiology (medical) › Adipose Tissue and Metabolism
- Life Sciences › Biochemistry, Genetics and Molecular Biology › Biochemistry › Lipid metabolism and biosynthesis
- Keywords
- circadian clock, white adipose tissue, lipolysis, lipid mobilization, free fatty acids, glycerol, adipose triglyceride lipase, hormone-sensitive lipase, Clock mutant mice, Bmal1, adipocyte hypertrophy, adiposity, energy homeostasis, circadian rhythm disruption
- MeSH terms
- Animals, Sterol Esterase, Circadian Rhythm, Fatty Acids, Nonesterified, Glycerol, Mice, Knockout, Adiposity, Lipid Metabolism, Mice, Adipose Tissue, White, CLOCK Proteins
About these checks
Registry, retraction, Cites and statistics results are computed, not judged, with one exception: a printed reference that no index lists is read once by a model before it counts as a citation error. Claims are extracted by a model and kept only when their quote appears verbatim in the text; each cited source is then checked, with a model’s help, for whether it says what the claim relies on. Those verdicts can be wrong — read the claim’s quote and the cited source before relying on one.
Statistics and arithmetic are recomputed, not judged.
Confidence bands are shown only for fields calibrated on our annotated test set. None is calibrated yet, so no band is shown.
What counts as a claim ›How we measure confidence ›How we check this ›
Are you an author, or do you see a problem with this page? Request a review
