Student or educator? Sign up with your school email and get 6 months of Pro free.
Cited by 15

The DOI matches its Crossref record; 4 of the 4 references it cites were found in a registry or an index.

N -6-methyladenosine (m6A) promotes the nuclear retention of mRNAs with intact 5′ splice site motifs

Lee, Eliza S, Smith, Harrison W, Wang, Yifan E, Ihn, Sean SJ, Scalize de Oliveira, Leticia, Kejiou, Nevraj S, Liang, Yijing L, Nabeel-Shah, Syed, Jomphe, Robert Y, Pu, Shuye, Greenblatt, Jack F, Palazzo, Alexander F·2025·Life Science Alliance

Published version of a preprint

Abstract

In humans, misprocessed mRNAs containing intact 5′ Splice Site (5′SS) motifs are nuclear retained and targeted for decay by ZFC3H1, a component of the Poly(A) Exosome Targeting complex, and U1-70K, a component of the U1 snRNP. In S. pombe , the ZFC3H1 homolog, Red1, binds to the YTH domain–containing protein Mmi1 and targets certain RNA transcripts to nuclear foci for nuclear retention and decay. Here we show that YTHDC1 and YTHDC2, two YTH domain-containing proteins that bind to N -6-methyladenosine (m6A) modified RNAs, interact with ZFC3H1 and U1-70K, and are required for the nuclear retention of mRNAs with intact 5′SS motifs. Disruption of m6A deposition inhibits both the nuclear retention of these transcripts and their accumulation in YTHDC1-enriched foci that are adjacent to nuclear speckles. Endogenous RNAs with intact 5′SS motifs, such as intronic poly-adenylated transcripts, tend to be m6A-modified at low levels. Thus, the m6A modification acts on a conserved quality control mechanism that targets misprocessed mRNAs for nuclear retention and decay.

Overview

The claims and statistics of this paper haven’t been checked yet.

Run the check — free, no account needed. It reads the open-access text and checks the sources it cites.

A few free checks a day · papers already verified open instantly · results are public

Integrity signals

Registry

Crossref · 10.26508/lsa.202403142

Cites

4 of 4 references verified0 citation errors · 0 not checkable

Statistics

Figures

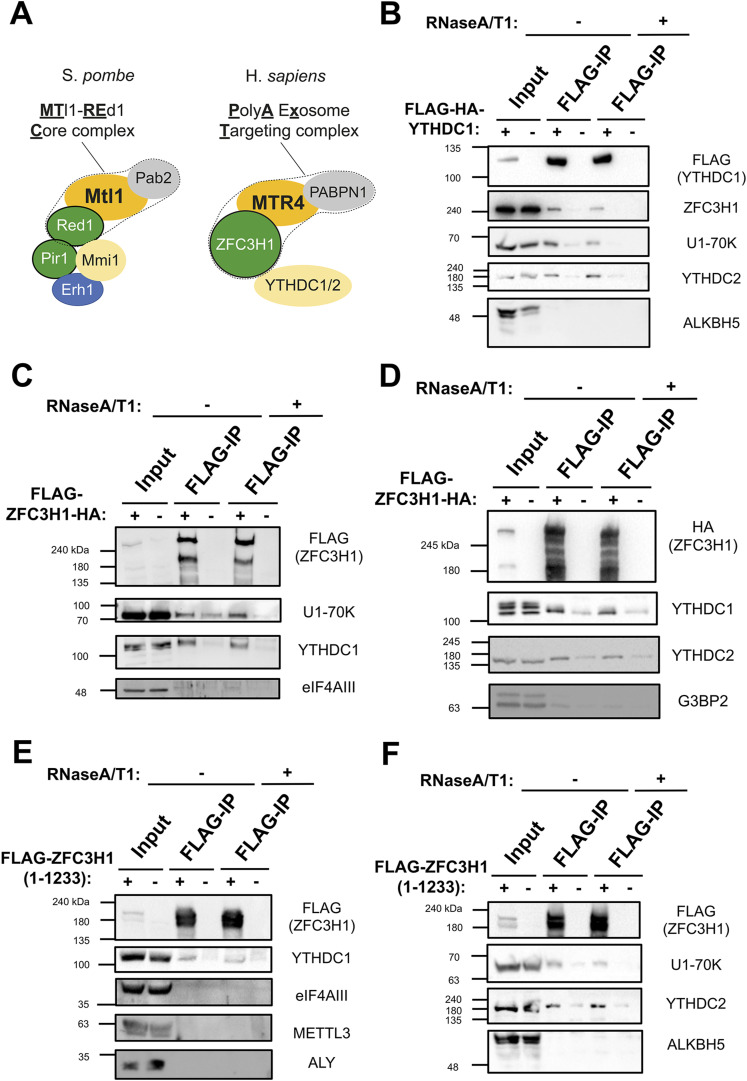
Figure 1. YTHDC1 and YTHDC2 interact with ZFC3H1 and U1-70K. (A) The main components of the MTREC complex (outlined by a dotted line) and associated factors in S. pombe (left), and their human homologs, including the PAXT complex (outlined by a dotted line) and YTH proteins (right). (B) HEK293 cells were either transfected with FLAG-tagged YTHDC1 or mock transfected. After 18–24 h, cell lysates were collected and subjected to immunoprecipitation using FLAG M2 beads. Precipitates were then treated with either buffer or a combination of RNase A and RNase T1 and reisolated to remove RNA-dependent interacting proteins. Samples were separated by SDS–PAGE and immunoblotted for the indicated proteins. Note that the inputs represent 5% of the samples used for immunoprecipitation. (C, D) Similar to (B), except that cells were transfected with FLAG/HA-tagged ZFC3H1 (FLAG-ZFC3H1-HA). (E, F) Similar to (B), except that cells were transfected with a FLAG-tagged fragment of ZFC3H1 containing amino acids 1–1,233. Source data are available for this figure.
Figure 1. YTHDC1 and YTHDC2 interact with ZFC3H1 and U1-70K. (A) The main components of the MTREC complex (outlined by a dotted line) and associated factors in S. pombe (left), and their human homologs, including the PAXT complex (outlined by a dotted line) and YTH proteins (right). (B) HEK293 cells were either transfected with FLAG-tagged YTHDC1 or mock transfected. After 18–24 h, cell lysates were collected and subjected to immunoprecipitation using FLAG M2 beads. Precipitates were then treated with either buffer or a combination of RNase A and RNase T1 and reisolated to remove RNA-dependent interacting proteins. Samples were separated by SDS–PAGE and immunoblotted for the indicated proteins. Note that the inputs represent 5% of the samples used for immunoprecipitation. (C, D) Similar to (B), except that cells were transfected with FLAG/HA-tagged ZFC3H1 (FLAG-ZFC3H1-HA). (E, F) Similar to (B), except that cells were transfected with a FLAG-tagged fragment of ZFC3H1 containing amino acids 1–1,233. Source data are available for this figure.CC BY · PubMed Central
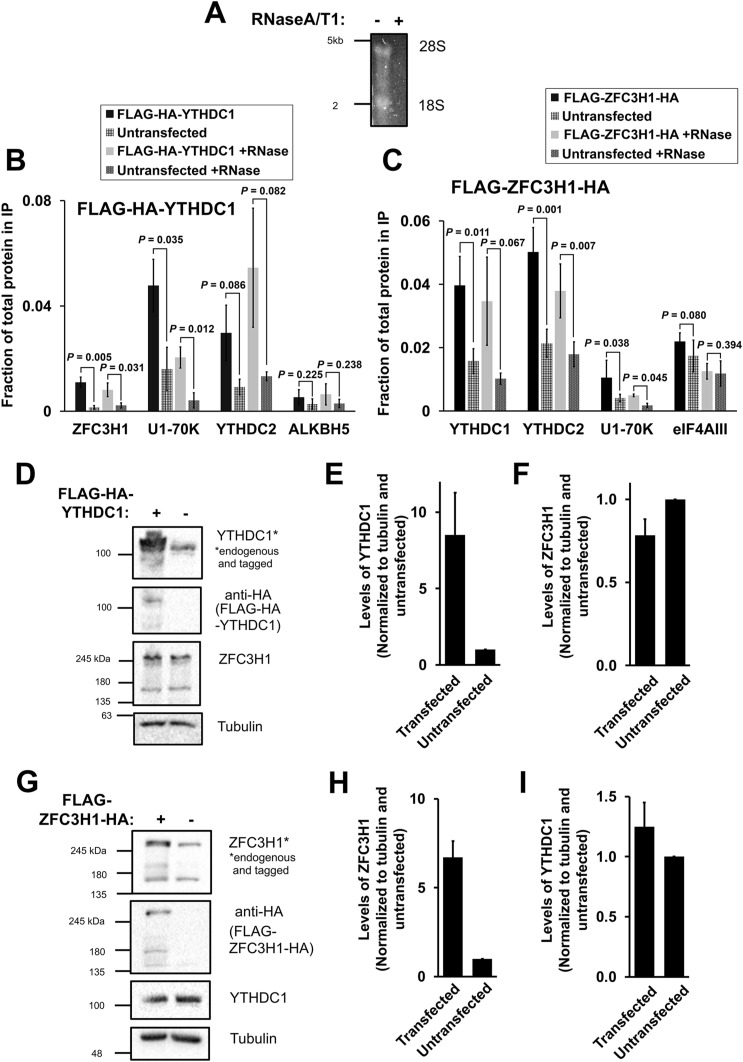
Figure S1. (Related to Fig 1). (A) Co-immunoprecipitation HEK cell lysates were treated with or without RNaseA/T1, separated on a denaturing agarose gel and stained overnight with SYBR Gold. 28S and 18S rRNA bands are visible in the mock treated samples but not present in the RNaseA/T1 treated samples. (B, C) Densitometry analysis of immunoprecipitations where the fraction of protein in the input that is present precipitate is quantified (Fig 1B–D). (D, E, F) HEK cells were transfected with FLAG-HA-YTHDC1 and lysed after 24 h. The samples were separated by SDS–PAGE and immunoblotted with antibodies against HA (which detects the tagged YTHDC1), YTHDC1 (which detects the tagged and endogenous YTHDC1), and ZFC3H1. (E) Quantification of tagged and untagged YTHDC1 levels using densitometry analysis. Levels of each protein were normalized to tubulin and to untransfected samples. (F) Quantification of endogenous ZFC3H1 levels, normalized similar to (E). (G, H, I) Similar to (D, E, F), except that FLAG-ZFC3H1-HA was transfected in HEK cells. Source data are available for this figure.
Figure S1. (Related to Fig 1). (A) Co-immunoprecipitation HEK cell lysates were treated with or without RNaseA/T1, separated on a denaturing agarose gel and stained overnight with SYBR Gold. 28S and 18S rRNA bands are visible in the mock treated samples but not present in the RNaseA/T1 treated samples. (B, C) Densitometry analysis of immunoprecipitations where the fraction of protein in the input that is present precipitate is quantified (Fig 1B–D). (D, E, F) HEK cells were transfected with FLAG-HA-YTHDC1 and lysed after 24 h. The samples were separated by SDS–PAGE and immunoblotted with antibodies against HA (which detects the tagged YTHDC1), YTHDC1 (which detects the tagged and endogenous YTHDC1), and ZFC3H1. (E) Quantification of tagged and untagged YTHDC1 levels using densitometry analysis. Levels of each protein were normalized to tubulin and to untransfected samples. (F) Quantification of endogenous ZFC3H1 levels, normalized similar to (E). (G, H, I) Similar to (D, E, F), except that FLAG-ZFC3H1-HA was transfected in HEK cells. Source data are available for this figure.CC BY · PubMed Central
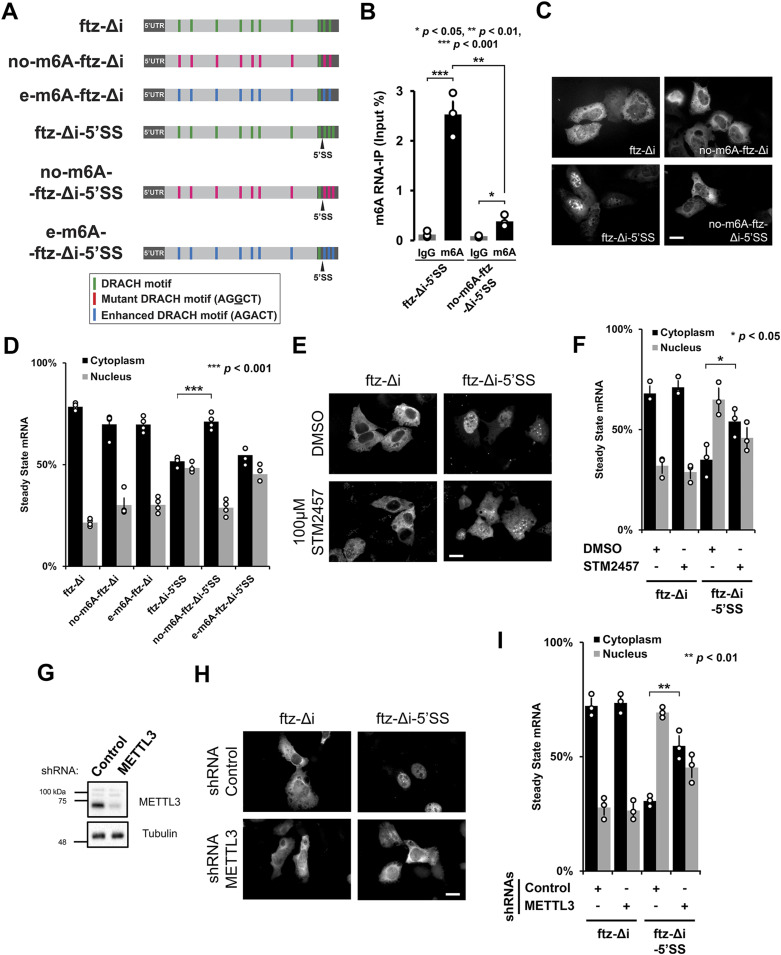
Figure 2. The m6A modification is required for nuclear retention of 5′SS motif containing mRNAs. (A) Schematic of the intronless fushi-tarazu (ftz-Δi) reporters used in this study, with and without the 5′SS motif in the 3′UTR. Note that the consensus 5′SS motif promotes nuclear retention. The positions of either consensus DRACH motifs, or their mutated forms that either eliminate the motifs (AGGCT), or enhance the motifs (AGACT) are indicated. (B) U2OS cells were transfected with the indicated ftz reporters. After 18–24 h, RNA was isolated and immunoprecipitated with anti-m6A antibodies or IgG controls. Levels of ftz in the precipitates were assessed by qRT-PCR. Each bar represents the average and standard error of three independent experiments. t test was performed, *P < 0.05 **P < 0.01 ***P < 0.001. (C, D) U2OS cells were transfected with the indicated ftz reporters. 18–24 h later the cells were fixed, and the mRNA was visualized by FISH using probes against ftz. Representative images are shown in (C), scale bar = 20 μm, and quantification is shown in (D). Each bar represents the average and standard error of at least three independent experiments, each experiment consisting of at least 30–60 cells. t test was performed, ***P < 0.001. (E, F) U2OS cells were transfected with the indicated ftz reporters. 6 h post-transfection, cells were treated with 100 μM STM2457 or DMSO. 18 h later, the cells were fixed, and the mRNA was visualized by FISH. Representative images are shown in (E), scale bar = 20 μm, and quantification shown in (F). Each bar represents the average and standard error of at least three independent experiments, each experiment consisting of at least 30–60 cells. t test was performed, *P < 0.05. (G, H, I) U2OS cells were treated with lentivirus containing four different shRNAs against METTL3 or scrambled control shRNA. (G) Lysates were collected after 96 h, separated by SDS–PAGE, and immunoprobed for METTL3 or tubulin. (H, I) Control- or METTL3-depleted cells were transfected with the indicated ftz reporters. 18–24 h later the cells were fixed and the mRNA was visualized by FISH. Representative images are shown in (H), scale bar = 20 μm, and quantification is shown in (I). Each bar represents the average and standard error of three independent experiments, each experiment consisting of at least 30–60 cells. t test was performed, **P < 0.01. Source data are available for this figure.
Figure 2. The m6A modification is required for nuclear retention of 5′SS motif containing mRNAs. (A) Schematic of the intronless fushi-tarazu (ftz-Δi) reporters used in this study, with and without the 5′SS motif in the 3′UTR. Note that the consensus 5′SS motif promotes nuclear retention. The positions of either consensus DRACH motifs, or their mutated forms that either eliminate the motifs (AGGCT), or enhance the motifs (AGACT) are indicated. (B) U2OS cells were transfected with the indicated ftz reporters. After 18–24 h, RNA was isolated and immunoprecipitated with anti-m6A antibodies or IgG controls. Levels of ftz in the precipitates were assessed by qRT-PCR. Each bar represents the average and standard error of three independent experiments. t test was performed, *P < 0.05 **P < 0.01 ***P < 0.001. (C, D) U2OS cells were transfected with the indicated ftz reporters. 18–24 h later the cells were fixed, and the mRNA was visualized by FISH using probes against ftz. Representative images are shown in (C), scale bar = 20 μm, and quantification is shown in (D). Each bar represents the average and standard error of at least three independent experiments, each experiment consisting of at least 30–60 cells. t test was performed, ***P < 0.001. (E, F) U2OS cells were transfected with the indicated ftz reporters. 6 h post-transfection, cells were treated with 100 μM STM2457 or DMSO. 18 h later, the cells were fixed, and the mRNA was visualized by FISH. Representative images are shown in (E), scale bar = 20 μm, and quantification shown in (F). Each bar represents the average and standard error of at least three independent experiments, each experiment consisting of at least 30–60 cells. t test was performed, *P < 0.05. (G, H, I) U2OS cells were treated with lentivirus containing four different shRNAs against METTL3 or scrambled control shRNA. (G) Lysates were collected after 96 h, separated by SDS–PAGE, and immunoprobed for METTL3 or tubulin. (H, I) Control- or METTL3-depleted cells were transfected with the indicated ftz reporters. 18–24 h later the cells were fixed and the mRNA was visualized by FISH. Representative images are shown in (H), scale bar = 20 μm, and quantification is shown in (I). Each bar represents the average and standard error of three independent experiments, each experiment consisting of at least 30–60 cells. t test was performed, **P < 0.01. Source data are available for this figure.CC BY · PubMed Central
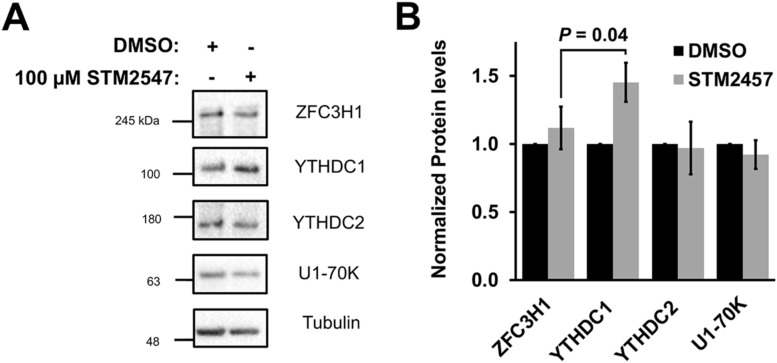
Figure S2. (Related to Fig 2E and F). (A, B) U2OS cells were treated with 100 μM STM2547 or DMSO for 24 h. Samples were separated by SDS–PAGE and immunoblotted for ZFC3H1, YTHDC1, YTHDC2, and U1-70K (A) which were then quantified by densitometry analysis (B) where protein levels are normalized to tubulin and DMSO-treated cells. Source data are available for this figure.
Figure S2. (Related to Fig 2E and F). (A, B) U2OS cells were treated with 100 μM STM2547 or DMSO for 24 h. Samples were separated by SDS–PAGE and immunoblotted for ZFC3H1, YTHDC1, YTHDC2, and U1-70K (A) which were then quantified by densitometry analysis (B) where protein levels are normalized to tubulin and DMSO-treated cells. Source data are available for this figure.CC BY · PubMed Central
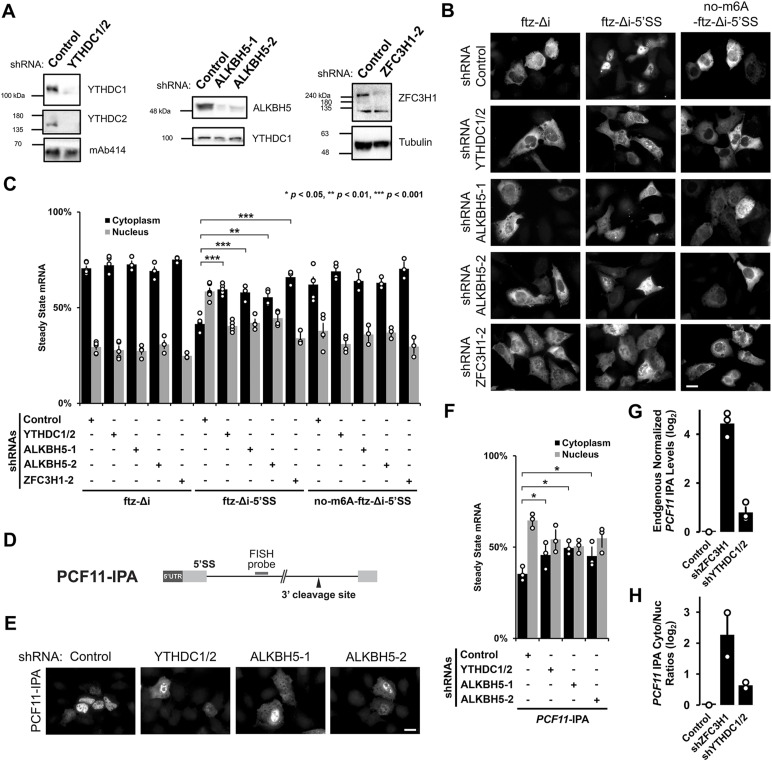
Figure 3. YTHDC1/YTHDC2 and ALKBH5 are required for the nuclear retention of 5′SS motif containing mRNAs. (A) U2OS cells were treated with different lentivirus shRNAs against YTHDC1, YTHDC2, ALKBH5, ZFC3H1, or scrambled control. Note that “ZFC3H1-2” denotes shRNA #2 against ZFC3H1 as described previously (Lee et al, 2022). Lysates were collected after 96 h, separated by SDS–PAGE and immunoprobed for YTHDC1, YTHDC2, ALKBH5, ZFC3H1, tubulin, or mAb414, which recognizes FG-nucleoporin proteins. To effectively deplete YTHDC1 and YTHDC2, cells were treated with lentivirus containing two shRNAs against YTHDC1 and another two against YTHDC2. (B, C) Control- or YTHDC1/2-, ALKBH5-, ZFC3H1-depleted U2OS cells were transfected with the intronless ftz reporter plasmid (±5′SS) and 5′SS motif containing reporter that lacks m6A methylation sites (no-m6A-ftz-Δi-5′SS). 18–24 h later the cells were fixed and the mRNA was visualized by FISH. Representative images are shown in (B), scale bar = 20 μm, and quantification is shown in (C). Each bar represents the average and standard error of three independent experiments, each experiment consisting of at least 30–60 cells. t test was performed, *P < 0.05, **P < 0.01, ***P < 0.001. (D) Schematic of PCF11-IPA RNA reporter. The position of the FISH probe used to visualize the IPA transcript is marked in gray and the position of the 3′ cleavage site in the intron is as indicated. (E, F) Similar to (B, C), except that Control-, YTHDC1/YTHDC2-, or ALKBH5-depleted cells were transfected with the PCF11-IPA RNA reporter. (G, H) Total RNA was isolated from whole cell lysates (G) or nuclear and cytoplasmic fractions (H) from control- or YTHDC1/2-, ZFC3H1-depleted U2OS cells. PCF11-IPA was assessed by qRT-PCR using oligo-dT to generate cDNA and intronic-specific primers for the amplicon. Levels were normalized to the control depletion. Note that no signal was detected in reactions lacking reverse transcriptase (not shown). Each bar represents the average and standard error of three (G) or two (H) independent experiments. Source data are available for this figure.
Figure 3. YTHDC1/YTHDC2 and ALKBH5 are required for the nuclear retention of 5′SS motif containing mRNAs. (A) U2OS cells were treated with different lentivirus shRNAs against YTHDC1, YTHDC2, ALKBH5, ZFC3H1, or scrambled control. Note that “ZFC3H1-2” denotes shRNA #2 against ZFC3H1 as described previously (Lee et al, 2022). Lysates were collected after 96 h, separated by SDS–PAGE and immunoprobed for YTHDC1, YTHDC2, ALKBH5, ZFC3H1, tubulin, or mAb414, which recognizes FG-nucleoporin proteins. To effectively deplete YTHDC1 and YTHDC2, cells were treated with lentivirus containing two shRNAs against YTHDC1 and another two against YTHDC2. (B, C) Control- or YTHDC1/2-, ALKBH5-, ZFC3H1-depleted U2OS cells were transfected with the intronless ftz reporter plasmid (±5′SS) and 5′SS motif containing reporter that lacks m6A methylation sites (no-m6A-ftz-Δi-5′SS). 18–24 h later the cells were fixed and the mRNA was visualized by FISH. Representative images are shown in (B), scale bar = 20 μm, and quantification is shown in (C). Each bar represents the average and standard error of three independent experiments, each experiment consisting of at least 30–60 cells. t test was performed, *P < 0.05, **P < 0.01, ***P < 0.001. (D) Schematic of PCF11-IPA RNA reporter. The position of the FISH probe used to visualize the IPA transcript is marked in gray and the position of the 3′ cleavage site in the intron is as indicated. (E, F) Similar to (B, C), except that Control-, YTHDC1/YTHDC2-, or ALKBH5-depleted cells were transfected with the PCF11-IPA RNA reporter. (G, H) Total RNA was isolated from whole cell lysates (G) or nuclear and cytoplasmic fractions (H) from control- or YTHDC1/2-, ZFC3H1-depleted U2OS cells. PCF11-IPA was assessed by qRT-PCR using oligo-dT to generate cDNA and intronic-specific primers for the amplicon. Levels were normalized to the control depletion. Note that no signal was detected in reactions lacking reverse transcriptase (not shown). Each bar represents the average and standard error of three (G) or two (H) independent experiments. Source data are available for this figure.CC BY · PubMed Central
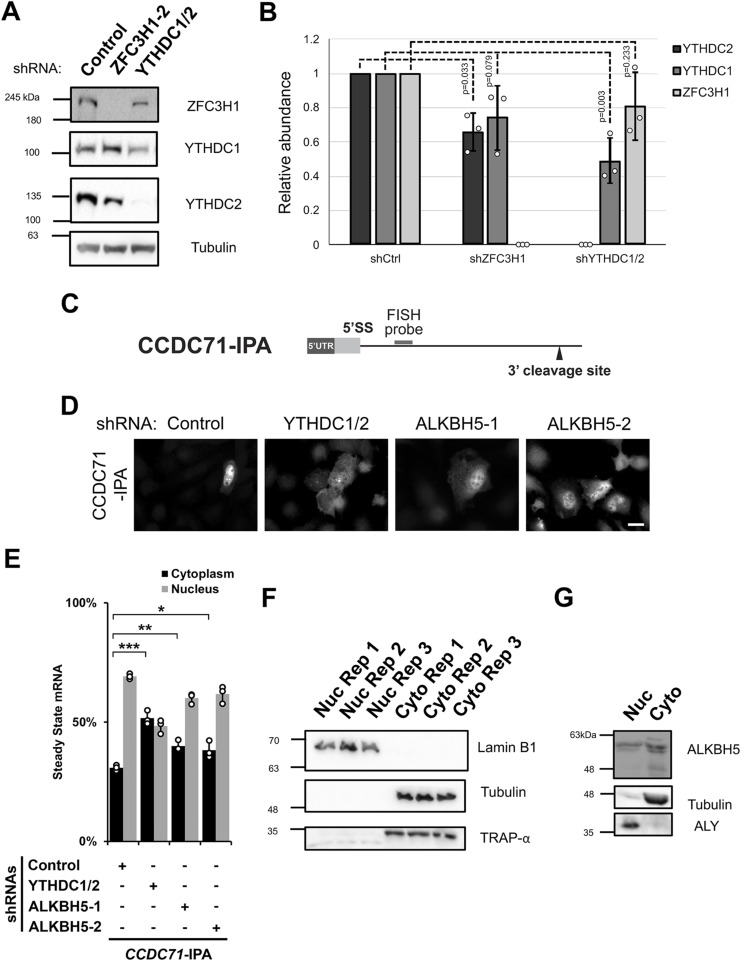
Figure S3. (Related to Fig 3). (A, B) Similar to Fig 3A, U2OS cells were treated with different lentivirus shRNAs against YTHDC1, YTHDC2, ZFC3H1, or scrambled control (shCtrl). Lysates were collected after 96 h, separated by SDS–PAGE and immunoprobed for YTHDC1, YTHDC2, and ZFC3H1 (A) and then quantified by densitometry analysis (B) where protein levels are normalized to tubulin and shCtrl samples. (C) Schematic of CCDC71-IPA RNA reporter. The position of the FISH probe used to visualize the IPA RNA is marked in gray and the position of the 3′ cleavage site in the intron is as indicated. (D, E) Control- or YTHDC1/2-, ALKBH5-, ZFC3H1-depleted U2OS cells were transfected with the CCDC71-IPA RNA reporter, which was analysed similar to Fig 3E and F. (F) U2OS cells were fractionated into nuclear and cytoplasmic fractions which were separated by SDS–PAGE and immunoprobed with various protein markers to determine the purity of each fraction; Lamin B1 (nucleus), tubulin (cytoplasm), and TRAP-α (endoplasmic reticulum). (G) Similar to (F), except immunoprobed for ALKBH5. To determine the purity of each fraction, ALY (nuclear marker) and tubulin (cytoplasmic marker) were probed. Source data are available for this figure.
Figure S3. (Related to Fig 3). (A, B) Similar to Fig 3A, U2OS cells were treated with different lentivirus shRNAs against YTHDC1, YTHDC2, ZFC3H1, or scrambled control (shCtrl). Lysates were collected after 96 h, separated by SDS–PAGE and immunoprobed for YTHDC1, YTHDC2, and ZFC3H1 (A) and then quantified by densitometry analysis (B) where protein levels are normalized to tubulin and shCtrl samples. (C) Schematic of CCDC71-IPA RNA reporter. The position of the FISH probe used to visualize the IPA RNA is marked in gray and the position of the 3′ cleavage site in the intron is as indicated. (D, E) Control- or YTHDC1/2-, ALKBH5-, ZFC3H1-depleted U2OS cells were transfected with the CCDC71-IPA RNA reporter, which was analysed similar to Fig 3E and F. (F) U2OS cells were fractionated into nuclear and cytoplasmic fractions which were separated by SDS–PAGE and immunoprobed with various protein markers to determine the purity of each fraction; Lamin B1 (nucleus), tubulin (cytoplasm), and TRAP-α (endoplasmic reticulum). (G) Similar to (F), except immunoprobed for ALKBH5. To determine the purity of each fraction, ALY (nuclear marker) and tubulin (cytoplasmic marker) were probed. Source data are available for this figure.CC BY · PubMed Central
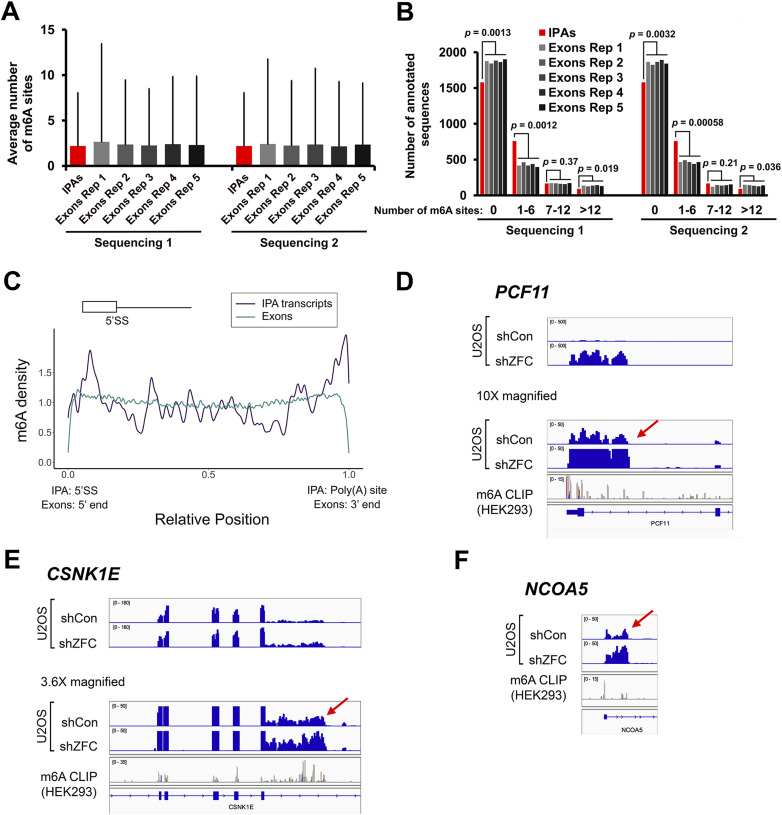
Figure 4. m6A methylation marks accumulate in IPA transcripts. (A, B) m6A deposition was assessed by m6A-miCLIP RNA-seq from HEK293 cells. For each intronic region that generates an IPA, an exon that was length (±10%) and expression (±10%) matched was randomly selected. This procedure was repeated five times to generate six sets (IPAs and exons Rep 1–5). The six sets were then compared for the average number and SD of m6A sites (A) or by stratifying them based on the number of sites (B). To ensure reproducibility, the relative expression of intronic regions that generate IPAs and exons were determined based on two independent RNA-seq experiments (“Sequencing 1” and “Sequencing 2”). (C) Meta-analysis of m6A density (as determined by m6A-miCLIP RNA-seq) along intronic portions of IPA transcripts (dark blue) and all exons (cyan). The position of the 5′SS motif and poly(A) site is indicated. In IPA transcripts, m6A methylation marks are enriched near the 5′SS motif and poly(A) sites. In exons, m6A methylation marks are depleted from the 5′ and 3′ ends (i.e., near exon-exon junctions), as documented by others. (D, E, F) Three examples of IPA transcripts that accumulate m6A marks. IGV browser tracks are shown for miCLIP density. Intronic cleavage/polyadenylation sites are indicated by the red arrows. Total RNA sequencing levels in U2OS cells from previously published work (Lee et al, 2022) are shown. Note that the levels of IPA transcripts are up-regulated after ZFC3H1 depletion (shZFC).
Figure 4. m6A methylation marks accumulate in IPA transcripts. (A, B) m6A deposition was assessed by m6A-miCLIP RNA-seq from HEK293 cells. For each intronic region that generates an IPA, an exon that was length (±10%) and expression (±10%) matched was randomly selected. This procedure was repeated five times to generate six sets (IPAs and exons Rep 1–5). The six sets were then compared for the average number and SD of m6A sites (A) or by stratifying them based on the number of sites (B). To ensure reproducibility, the relative expression of intronic regions that generate IPAs and exons were determined based on two independent RNA-seq experiments (“Sequencing 1” and “Sequencing 2”). (C) Meta-analysis of m6A density (as determined by m6A-miCLIP RNA-seq) along intronic portions of IPA transcripts (dark blue) and all exons (cyan). The position of the 5′SS motif and poly(A) site is indicated. In IPA transcripts, m6A methylation marks are enriched near the 5′SS motif and poly(A) sites. In exons, m6A methylation marks are depleted from the 5′ and 3′ ends (i.e., near exon-exon junctions), as documented by others. (D, E, F) Three examples of IPA transcripts that accumulate m6A marks. IGV browser tracks are shown for miCLIP density. Intronic cleavage/polyadenylation sites are indicated by the red arrows. Total RNA sequencing levels in U2OS cells from previously published work (Lee et al, 2022) are shown. Note that the levels of IPA transcripts are up-regulated after ZFC3H1 depletion (shZFC).CC BY · PubMed Central
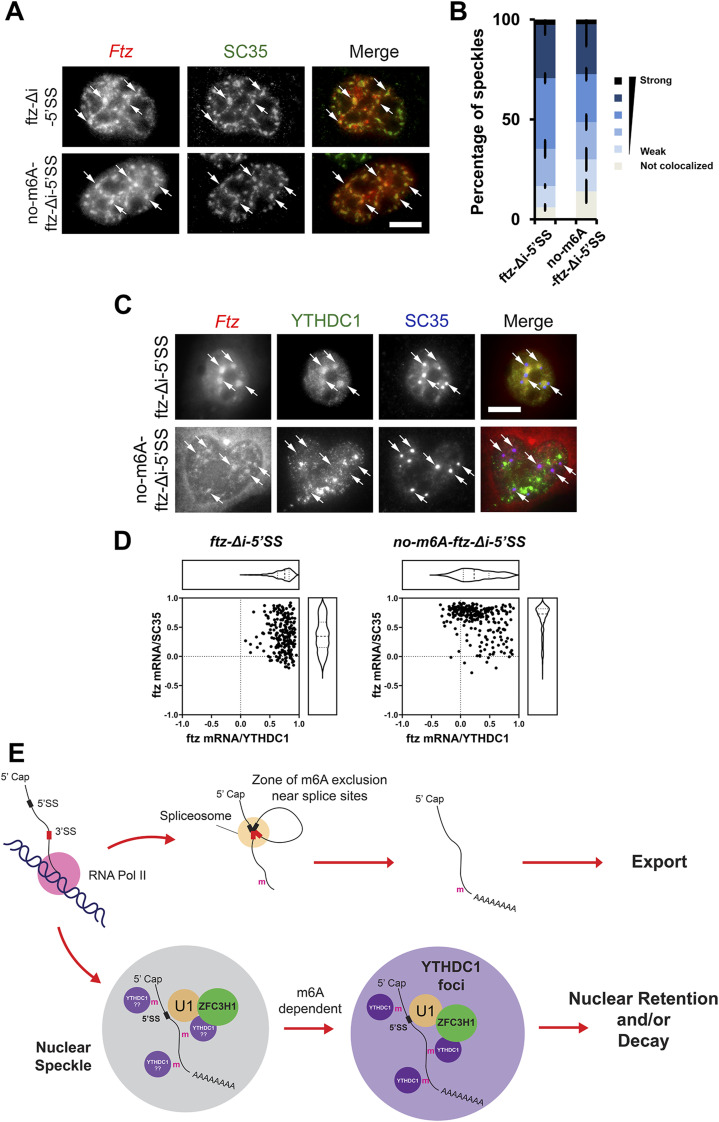
Figure 5. 5′SS motif containing mRNAs are transferred from nuclear speckles to YTHDC1-containing foci in an m6A-dependent manner. (A, B) Plasmid DNA containing the ftz-Δi-5′SS or no-m6A-ftz-Δi-5′SS reporter genes was microinjected into U2OS nuclei. One hour post-injection, cells were fixed and stained for ftz mRNA by FISH and SC35 by immunofluorescence. Representative cells are shown in (A), each row represents a single field of view. The merged image shows mRNA in red and SC35 in green. Examples of speckles containing mRNA are indicated by arrows and the scale bar = 10 μm. Individual nuclear speckles (as detected by SC35) were analysed for colocalization with ftz mRNA by Pearson’s Correlation Analysis (B) as previously described (Akef et al, 2013). Each bar is the average and standard error of the mean of three experiments; each experiment consists of 100 nuclear speckles analysed from 10 cells. (C, D) Plasmid DNA containing the ftz-Δi-5′SS or no-m6A-ftz-Δi-5′SS reporter genes was transfected into U2OS. 24 h post-transfection, cells were fixed and stained for ftz mRNA by FISH and for YTHDC1 and SC35 by immunofluorescence. Representative cells are shown in (C); each row represents a single field of view. The merged image shows mRNA in red, YTHDC1 in green and SC35 in blue. Ftz mRNA foci are indicated by arrows and the scale bar = 10 μm. Individual ftz mRNA foci were analysed for colocalization with either SC35 (y-axis) or YTHDC1 (x-axis) by Pearson’s Correlation Analysis (D). Each dot represents a single mRNA foci (each cell containing 5–10 foci, cells were obtained from two independent experiments). (E) Model of how m6A modifications are required for the nuclear surveillance of 5′SS motif containing mRNAs (see text for more details).
Figure 5. 5′SS motif containing mRNAs are transferred from nuclear speckles to YTHDC1-containing foci in an m6A-dependent manner. (A, B) Plasmid DNA containing the ftz-Δi-5′SS or no-m6A-ftz-Δi-5′SS reporter genes was microinjected into U2OS nuclei. One hour post-injection, cells were fixed and stained for ftz mRNA by FISH and SC35 by immunofluorescence. Representative cells are shown in (A), each row represents a single field of view. The merged image shows mRNA in red and SC35 in green. Examples of speckles containing mRNA are indicated by arrows and the scale bar = 10 μm. Individual nuclear speckles (as detected by SC35) were analysed for colocalization with ftz mRNA by Pearson’s Correlation Analysis (B) as previously described (Akef et al, 2013). Each bar is the average and standard error of the mean of three experiments; each experiment consists of 100 nuclear speckles analysed from 10 cells. (C, D) Plasmid DNA containing the ftz-Δi-5′SS or no-m6A-ftz-Δi-5′SS reporter genes was transfected into U2OS. 24 h post-transfection, cells were fixed and stained for ftz mRNA by FISH and for YTHDC1 and SC35 by immunofluorescence. Representative cells are shown in (C); each row represents a single field of view. The merged image shows mRNA in red, YTHDC1 in green and SC35 in blue. Ftz mRNA foci are indicated by arrows and the scale bar = 10 μm. Individual ftz mRNA foci were analysed for colocalization with either SC35 (y-axis) or YTHDC1 (x-axis) by Pearson’s Correlation Analysis (D). Each dot represents a single mRNA foci (each cell containing 5–10 foci, cells were obtained from two independent experiments). (E) Model of how m6A modifications are required for the nuclear surveillance of 5′SS motif containing mRNAs (see text for more details).CC BY · PubMed Central

Verification

Claims the paper makes

The claims and statistics of this paper haven’t been checked yet.

Run the check — free, no account needed. It reads the open-access text and checks the sources it cites.

A few free checks a day · papers already verified open instantly · results are public

Claims other papers make about this one

Each is checked against this paper’s own text: does it say what the citing paper says it does?

Self-check

Percentages, sums and reported differences re-computed from the paper’s own numbers.

The self-check needs the paper’s full text.

Citations

Cites

Research works printed but not linked: 69

  1. 10.1093/nar/gkn068 · DOI
  2. 10.4161/nucl.26052 · DOI
  3. 10.1093/bioinformatics/btu170 · DOI · Paper page
  4. 10.1016/j.celrep.2022.110861 · DOI
  5. 10.1371/journal.pone.0026804 · DOI
  6. 10.1007/s13238-021-00837-8 · DOI
  7. 10.1016/j.ccell.2021.04.017 · DOI
  8. 10.1093/gigascience/giab008 · DOI
  9. 10.1093/bioinformatics/bts635 · DOI · Paper page
  10. 10.1038/nature11112 · DOI · Paper page
  11. 10.1038/ncomms12626 · DOI
  12. 10.1073/pnas.1332669100 · DOI
  13. 10.1002/wrna.1572 · DOI
  14. 10.1038/nbt.1525 · DOI
  15. 10.1083/jcb.111.6.2283 · DOI
  16. 10.3791/2387 · DOI
  17. 10.1126/science.abj9090 · DOI
  18. 10.1038/s41467-021-23457-6 · DOI
  19. 10.1038/nchembio.687 · DOI · Paper page
  20. 10.1093/bioinformatics/btp328 · DOI
  21. 10.1371/journal.pone.0122743 · DOI
  22. 10.1093/nar/gkaa919 · DOI
  23. 10.1261/rna.079104.122 · DOI
  24. 10.1016/0092-8674(89)90127-X · DOI
  25. 10.1016/j.bbagrm.2018.09.008 · DOI
  26. 10.1038/s41598-018-32310-8 · DOI
  27. 10.1038/nchembio.1432 · DOI · Paper page
  28. 10.1126/science.aay6018 · DOI · Paper page
  29. 10.1038/s41467-023-39897-1 · DOI
  30. 10.1038/s41556-021-00725-7 · DOI
  31. 10.1016/j.molcel.2016.09.025 · DOI · Paper page
  32. 10.1016/j.cell.2012.05.003 · DOI · Paper page
  33. 10.21769/BioProtoc.4688 · DOI
  34. 10.1016/j.molcel.2024.08.037 · DOI
  35. 10.1083/jcb.150.5.949 · DOI
  36. 10.1080/15384101.2017.1377501 · DOI
  37. 10.1101/gad.302604.117 · DOI
  38. 10.3389/fgene.2018.00440 · DOI
  39. 10.1371/journal.pbio.0050322 · DOI
  40. 10.1080/15476286.2023.2293339 · DOI
  41. 10.1093/bioinformatics/btw653 · DOI
  42. 10.7554/eLife.32155 · DOI
  43. 10.1371/journal.pgen.1008598 · DOI
  44. 10.1016/j.celrep.2018.04.061 · DOI
  45. 10.1093/nar/gkz1238 · DOI
  46. 10.1101/2022.08.21.504696 · DOI · Paper page
  47. 10.1016/j.molcel.2022.06.031 · DOI
  48. 10.1002/j.1460-2075.1991.tb04911.x · DOI
  49. 10.1038/emboj.2011.32 · DOI
  50. 10.1016/j.molcel.2016.01.029 · DOI
  51. 10.1016/j.molcel.2024.07.017 · DOI
  52. 10.1101/gr.5532707 · DOI
  53. 10.1093/bioinformatics/btp120 · DOI
  54. 10.1038/srep42271 · DOI
  55. 10.1016/j.molcel.2022.12.026 · DOI
  56. 10.1105/tpc.107.055053 · DOI
  57. 10.1016/j.celrep.2019.05.107 · DOI
  58. 10.1038/nature12730 · DOI · Paper page
  59. 10.1093/nar/gkv1382 · DOI
  60. 10.1093/nar/gkab774 · DOI
  61. 10.1038/s41556-021-00631-y · DOI
  62. Wickham H (2009) Ggplot2: Elegant Graphics for Data Analysis. New York: Springer. · DOI · Paper page
  63. 10.1038/nchembio.1654 · DOI
  64. 10.3389/fonc.2021.629560 · DOI
  65. 10.1038/s41467-022-35643-1 · DOI
  66. 10.1038/s41586-021-03536-w · DOI
  67. 10.1016/j.molcel.2012.10.015 · DOI · Paper page
  68. 10.1038/35030160 · DOI
  69. 10.1038/ncomms8050 · DOI

Cited by

See all 15

Metadata

Authors
Lee, E. S., Smith, H. W., Wang, Y. E., Ihn, S. S., Scalize de Oliveira, L., Kejiou, N. S., Liang, Y. L., Nabeel-Shah, S., Jomphe, R. Y., Pu, S., Greenblatt, J. F., & Palazzo, A. F.
Venue
Life Science Alliance
Published
2024-12-03
Volume
8
Issue
2
Pages
e202403142
ISSN
2575-1077
Cited by
15
References
4
Language
en
Funders
Canadian Government | Natural Sciences and Engineering Research Council of Canada (FN 492860)

About these checks

Registry, retraction, Cites and statistics results are computed, not judged, with one exception: a printed reference that no index lists is read once by a model before it counts as a citation error. Claims are extracted by a model and kept only when their quote appears verbatim in the text; each cited source is then checked, with a model’s help, for whether it says what the claim relies on. Those verdicts can be wrong — read the claim’s quote and the cited source before relying on one.

Statistics and arithmetic are recomputed, not judged.

Confidence bands are shown only for fields calibrated on our annotated test set. None is calibrated yet, so no band is shown.

What counts as a claim ›How we measure confidence ›How we check this ›

Are you an author, or do you see a problem with this page? Request a review

Data sources

Bibliographic data: Semantic Scholar, OpenAlex, Crossref.

Contains information from the Semantic Scholar Academic Graph Datasets, made available under the ODC Attribution License (ODC-BY 1.0).

Semantic Scholar’s data is described in: Kinney, R., et al. (2023). The Semantic Scholar Open Data Platform. arXiv:2301.10140.