

The DOI matches its Crossref record; 35 of the 35 references it cites were found in a registry or an index.
Identification of Human Plasma Metabolites Exhibiting Time-of-Day Variation Using an Untargeted Liquid Chromatography–Mass Spectrometry Metabolomic Approach
Open accessAbstract
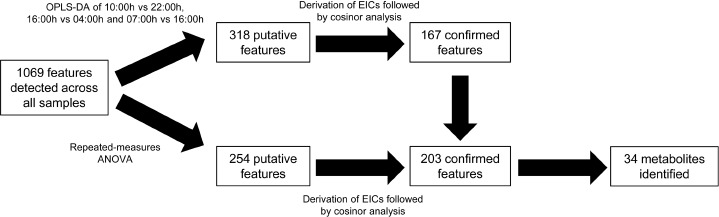
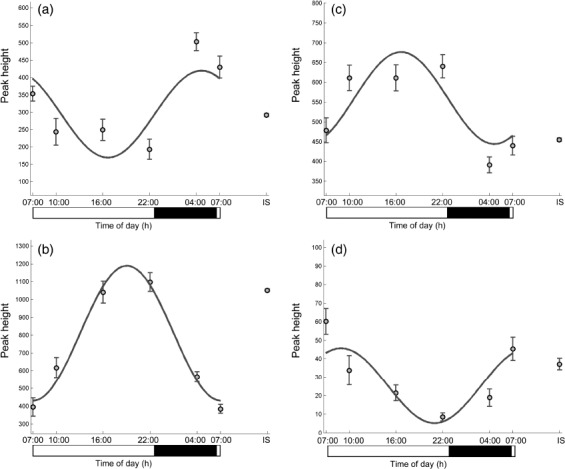
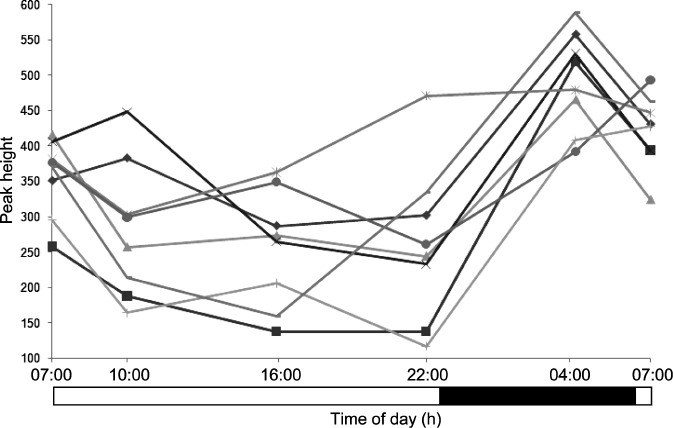
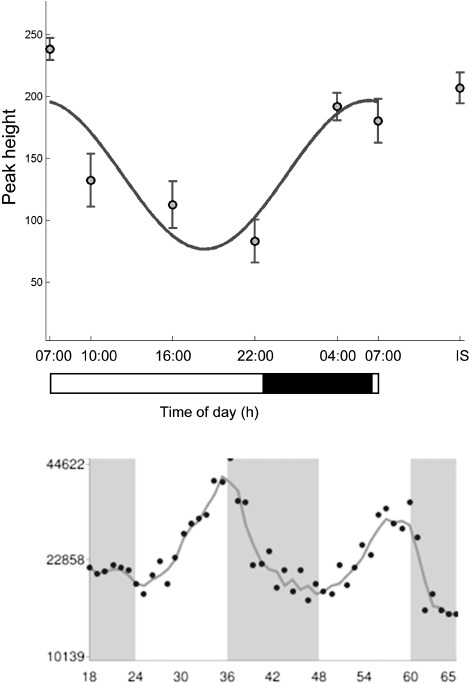
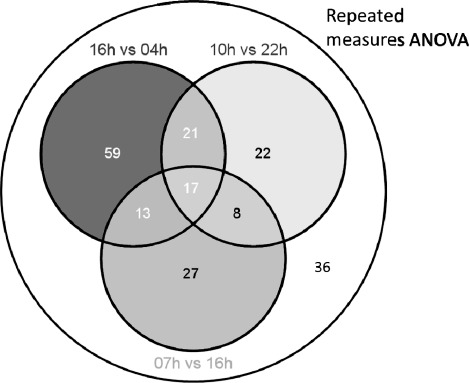
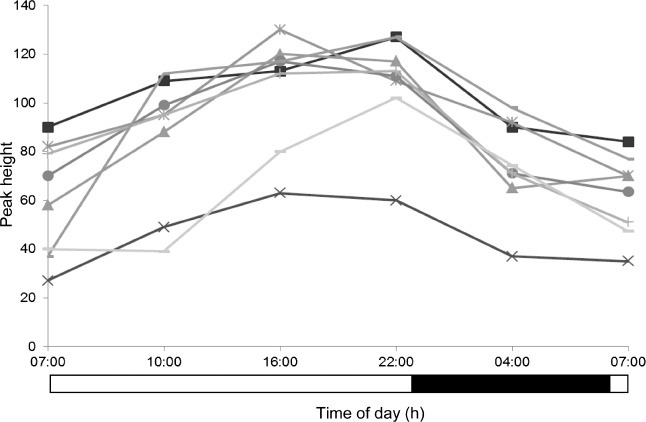
Although daily rhythms regulate multiple aspects of human physiology, rhythmic control of the metabolome remains poorly understood. The primary objective of this proof-of-concept study was identification of metabolites in human plasma that exhibit significant 24-h variation. This was assessed via an untargeted metabolomic approach using liquid chromatography-mass spectrometry (LC-MS). Eight lean, healthy, and unmedicated men, mean age 53.6 (SD ± 6.0) yrs, maintained a fixed sleep/wake schedule and dietary regime for 1 wk at home prior to an adaptation night and followed by a 25-h experimental session in the laboratory where the light/dark cycle, sleep/wake, posture, and calorific intake were strictly controlled. Plasma samples from each individual at selected time points were prepared using liquid-phase extraction followed by reverse-phase LC coupled to quadrupole time-of-flight MS analysis in positive ionization mode. Time-of-day variation in the metabolites was screened for using orthogonal partial least square discrimination between selected time points of 10:00 vs. 22:00 h, 16:00 vs. 04:00 h, and 07:00 (d 1) vs. 16:00 h, as well as repeated-measures analysis of variance with time as an independent variable. Subsequently, cosinor analysis was performed on all the sampled time points across the 24-h day to assess for significant daily variation. In this study, analytical variability, assessed using known internal standards, was low with coefficients of variation <10%. A total of 1069 metabolite features were detected and 203 (19%) showed significant time-of-day variation. Of these, 34 metabolites were identified using a combination of accurate mass, tandem MS, and online database searches. These metabolites include corticosteroids, bilirubin, amino acids, acylcarnitines, and phospholipids; of note, the magnitude of the 24-h variation of these identified metabolites was large, with the mean ratio of oscillation range over MESOR (24-h time series mean) of 65% (95% confidence interval [CI]: 49-81%). Importantly, several of these human plasma metabolites, including specific acylcarnitines and phospholipids, were hitherto not known to be 24-h variant. These findings represent an important baseline and will be useful in guiding the design and interpretation of future metabolite-based studies.
Overview
The claims and statistics of this paper haven’t been checked yet.
Run the check — free, no account needed. It reads the open-access text and checks the sources it cites.
Integrity signals
Registry
Cites
Statistics
Figures
Verification
Claims the paper makes
The claims and statistics of this paper haven’t been checked yet.
Run the check — free, no account needed. It reads the open-access text and checks the sources it cites.
Claims other papers make about this one
Each is checked against this paper’s own text: does it say what the citing paper says it does?
In the citing paper
“Ang et al. (13) found 25 of 34 to be lipid species, with lysoPCs (18:2, 20:3) acylcarnitine (12:0 and 18:0) and Phe overlapping with our results.”
From Oxalic acid and diacylglycerol 36:3 are cross-species markers of sleep debt (2015) · cites this paper as [13]
In the citing paper
“In addition to these mouse studies, human metabolome analyses also reveal that up to 20% of detectable metabolites in matrices such as plasma and saliva exhibit daily rhythms (44)(45)(46).”
From Circadian rhythms, metabolism, and chrononutrition in rodents and humans (2016) · cites this paper as [45]
Self-check
Percentages, sums and reported differences re-computed from the paper’s own numbers.
The self-check needs the paper’s full text.
Citations
Cites
A self-assessment questionnaire to determine morningness- eveningness in human circadian rhythms
Home, J. K. (1976) · Medical Entomology and Zoology · Cited by 4,783
(1976) · PubMed · Cited by 3,979
Predicting basal metabolic rate, new standards and review of previous work.
Wn, S. (1985) · PubMed · Cited by 2,955
Metabonomics: a platform for studying drug toxicity and gene function
Nicholson, J. K., Connelly, J. C., Lindon, J. C., & Holmes, E. C. (2002) · Nature Reviews Drug Discovery · doi:10.1038/nrd728 · Cited by 1,915
Psychogios, N., Hau, D., Peng, J., Guo, A. C., Mandal, R., Bouatra, S., Sinelnikov, I. V., Krishnamurthy, R., Eisner, R., Gautam, B., et al. (2011) · PLoS ONE · doi:10.1371/journal.pone.0016957 · Cited by 1,779
Methods for cosinor-rhythmometry.
Nelson, W. E., Tong, Y. L., Lee, J. K., & Franz Halberg, A. (1979) · PubMed · Cited by 1,701
Wiklund, S., Johansson, E., Sjöström, L., Mellerowicz, E. J., Edlund, U. G., Shockcor, J. P., Gottfries, J., Möritz, T., & Trygg, J. (2007) · Analytical Chemistry · doi:10.1021/ac0713510 · Cited by 1,234
ETHICS AND METHODS FOR BIOLOGICAL RHYTHM RESEARCH ON ANIMALS AND HUMAN BEINGS
Portaluppi, F., Smolensky, M. H., & Touitou, Y. (2010) · Chronobiology International · doi:10.3109/07420528.2010.516381 · Cited by 1,125
Harmonics of Circadian Gene Transcription in Mammals
Hughes, M. E., DiTacchio, L., Hayes, K. R., Vollmers, C., Pulivarthy, S. R., Baggs, J. E., Panda, S., & Hogenesch, J. B. (2009) · PLoS Genetics · doi:10.1371/journal.pgen.1000442 · Cited by 689
The human circadian metabolome
Dallmann, R., Viola, A. U., Tarokh, L., Cajochen, C., & Brown, S. A. (2012) · Proceedings of the National Academy of Sciences · doi:10.1073/pnas.1114410109 · Cited by 566
Research works printed but not linked: 4
- Horne JA, 1976, Int. J. Chronobiol, 4, 97
- Nelson W, 1979, Chronobiologia, 6, 305
- Pandher R, 2012, Metabolomics., 317
- Schofield WN, 1985, Hum. Nutr. Clin. Nutr., 39, 5
Cited by
Sorted by citations
Time for food: the intimate interplay between nutrition, metabolism, and the circadian clock
Asher, G., & Sassone-Corsi, P. (2015) · Cell · doi:10.1016/j.cell.2015.03.015 · Cited by 844
Circadian regulation of glucose, lipid, and energy metabolism in humans
Poggiogalle, E., Jamshed, H., & Peterson, C. M. (2017) · Metabolism · doi:10.1016/j.metabol.2017.11.017 · Cited by 743
Effect of sleep deprivation on the human metabolome
Davies, S. K., Ang, J. E., Revell, V. L., Holmes, B., Mann, A., Robertson, F. P., Cui, N., Middleton, B., Ackermann, K., Kayser, M., et al. (2014) · Proceedings of the National Academy of Sciences · doi:10.1073/pnas.1402663111 · Cited by 527
Self-citationCircadian rhythms, sleep deprivation, and human performance
Goel, N., Basner, M., Rao, H., & Dinges, D. F. (2013) · Progress in Molecular Biology and Translational Science · doi:10.1016/b978-0-12-396971-2.00007-5 · Cited by 400
“Recently, the constant routine protocol has been used to examine metabolites in saliva and plasma at different times of day to identify those that are under circadian control and are independent of sleep.(78,79) Remarkably, one study found that metabolites from blood taken every 2 h, which”
Quality assurance procedures for mass spectrometry untargeted metabolomics. a review
Dudzik, D., Barbas-Bernardos, C., Garcı́a, A., & Barbas, C. (2017) · Journal of Pharmaceutical and Biomedical Analysis · doi:10.1016/j.jpba.2017.07.044 · Cited by 361
Circadian Control of DRP1 Activity Regulates Mitochondrial Dynamics and Bioenergetics
Schmitt, K., Grimm, A., Dallmann, R., Oettinghaus, B., Restelli, L. M., Witzig, M., Ishihara, N., Mihara, K., Ripperger, J. A., Albrecht, U., et al. (2018) · Cell Metabolism · doi:10.1016/j.cmet.2018.01.011 · Cited by 346
Effects of pre-analytical processes on blood samples used in metabolomics studies
Yin, P., Lehmann, R., & Xu, G. (2015) · Analytical and Bioanalytical Chemistry · doi:10.1007/s00216-015-8565-x · Cited by 284
Neufeld-Cohen, A., Robles, M. S., Aviram, R., Manella, G., Adamovich, Y., Ladeuix, B., Nir, D., Rousso-Noori, L., Kuperman, Y., Golik, M., et al. (2016) · Proceedings of the National Academy of Sciences · doi:10.1073/pnas.1519650113 · Cited by 262
Circadian rhythms, metabolism, and chrononutrition in rodents and humans
Johnston, J. D., Ordovás, J. M., Scheer, F. A., & Turek, F. W. (2016) · Advances in Nutrition · doi:10.3945/an.115.010777 · Cited by 258
Self-citationDetection and analysis of chiral molecules as disease biomarkers
Liu, Y., Wu, Z., Armstrong, D. W., Wolosker, H., & Zheng, Y. (2023) · Nature Reviews Chemistry · doi:10.1038/s41570-023-00476-z · Cited by 261
Circadian timing of metabolism in animal models and humans
Dibner, C., & Schibler, U. (2015) · Journal of Internal Medicine · doi:10.1111/joim.12347 · Cited by 237
Pre-Analytical Factors that Affect Metabolite Stability in Human Urine, Plasma, and Serum: A Review
Stevens, V. L., Hoover, E., Wang, Y., & Zanetti, K. A. (2019) · Metabolites · doi:10.3390/metabo9080156 · Cited by 189
Circadian regulation of lipid metabolism
Gooley, J. J. (2016) · Proceedings of The Nutrition Society · doi:10.1017/s0029665116000288 · Cited by 194
Oxalic acid and diacylglycerol 36:3 are cross-species markers of sleep debt
Weljie, A. M., Meerlo, P., Goel, N., Sengupta, A., Kayser, M. S., Abel, T., Birnbaum, M. J., Dinges, D. F., & Sehgal, A. (2015) · Proceedings of the National Academy of Sciences · doi:10.1073/pnas.1417432112 · Cited by 158
Physiological responses to food intake throughout the day
Johnston, J. D. (2014) · Nutrition Research Reviews · doi:10.1017/s0954422414000055 · Cited by 158
Self-citationDiurnal Regulation of Lipid Metabolism and Applications of Circadian Lipidomics
Gooley, J. J., & Chua, E. C.-P. (2014) · Journal of genetics and genomics/Journal of Genetics and Genomics · doi:10.1016/j.jgg.2014.04.001 · Cited by 140
Aho, V., Ollila, H. M., Kronholm, E., Bondia-Pons, I., Soininen, P., Kangas, A. J., Hilvo, M., Seppälä, I., Kettunen, J., Oikonen, M., et al. (2016) · Scientific Reports · doi:10.1038/srep24828 · Cited by 126
Novel Approaches for Assessing Circadian Rhythmicity in Humans: A Review
Dijk, D., & Duffy, J. F. (2020) · Journal of Biological Rhythms · doi:10.1177/0748730420940483 · Cited by 138
Clinical lipidomics: realizing the potential of lipid profiling
Meikle, T. G., Huynh, K., Giles, C., & Meikle, P. J. (2021) · Journal of Lipid Research · doi:10.1016/j.jlr.2021.100127 · Cited by 121
Circadian Metabolism: From Mechanisms to Metabolomics and Medicine
Brown, S. A. (2016) · Trends in Endocrinology and Metabolism · doi:10.1016/j.tem.2016.03.015 · Cited by 122
Cerebral Metabolic Changes During Sleep
Aalling, N. N., Nedergaard, M., & DiNuzzo, M. (2018) · Current Neurology and Neuroscience Reports · doi:10.1007/s11910-018-0868-9 · Cited by 101
Optimizing the lipidomics workflow for clinical studies—practical considerations
Hyötyläinen, T., & Orešič, M. (2015) · Analytical and Bioanalytical Chemistry · doi:10.1007/s00216-015-8633-2 · Cited by 94
Melatonin: Countering Chaotic Time Cues
Arendt, J. (2019) · Frontiers in Endocrinology · doi:10.3389/fendo.2019.00391 · Cited by 90
Davis, R., Rogers, M., Coates, A. M., Leung, G. K. W., & Bonham, M. P. (2022) · Current Diabetes Reports · doi:10.1007/s11892-022-01457-0 · Cited by 85
The emerging roles of lipids in circadian control
Adamovich, Y., Aviram, R., & Asher, G. (2014) · Biochimica et Biophysica Acta (BBA) - Molecular and Cell Biology of Lipids · doi:10.1016/j.bbalip.2014.11.013 · Cited by 78
Individual metabolomic signatures of circadian misalignment during simulated night shifts in humans
Kervezee, L., Cermakian, N., & Boivin, D. B. (2019) · PLoS Biology · doi:10.1371/journal.pbio.3000303 · Cited by 78
Circadian Variation of the Human Metabolome Captured by Real-Time Breath Analysis
Sinues, P., Tarokh, L., Li, X., Kohler, M., Brown, S. A., Zenobi, R., & Dallmann, R. (2014) · PLoS ONE · doi:10.1371/journal.pone.0114422 · Cited by 75
Honma, A., Revell, V. L., Gunn, P. J., Davies, S. K., Middleton, B., Raynaud, F. I., & Skene, D. J. (2019) · European Journal of Neuroscience · doi:10.1111/ejn.14411 · Cited by 75
Self-citationJohnston, J. D., & Skene, D. J. (2015) · Journal of Endocrinology · doi:10.1530/joe-15-0119 · Cited by 66
Self-citationTwenty‐four‐hour rhythmicity of circulating metabolites: effect of body mass and type 2 diabetes
Isherwood, C., van der Veen, D. R., Johnston, J. D., & Skene, D. J. (2017) · The FASEB Journal · doi:10.1096/fj.201700323r · Cited by 67
Self-citationDiurnal Variation of Hormonal and Lipid Biomarkers in a Molecular Epidemiology-Like Setting
van Kerkhof, L. W. M., Dycke, K. C. G. V., Jansen, E. H. J. M., Beekhof, P., van Oostrom, C. T. M., Ruskovska, T., Velickova, N., Kamcev, N., Pennings, J. L. A., STEEG, H. V., et al. (2015) · PLoS ONE · doi:10.1371/journal.pone.0135652 · Cited by 66
Habitual sleep and human plasma metabolomics
Xiao, Q., Derkach, A., Moore, S. C., Zheng, W., Shu, X., Gu, F., Caporaso, N. E., Sampson, J. N., & Matthews, C. E. (2017) · Metabolomics · doi:10.1007/s11306-017-1205-z · Cited by 64
Crosstalk between circadian rhythms and the microbiota
Pearson, J. A., Wong, F. S., & Li, W. (2020) · Immunology · doi:10.1111/imm.13278 · Cited by 60
Impact of Pre-analytic Blood Sample Collection Factors on Metabolomics
Townsend, M. K., Bao, Y., Poole, E. M., Bertrand, K. A., Kraft, P., Wolpin, B. M., Clish, C. B., & Tworoger, S. S. (2016) · Cancer Epidemiology Biomarkers & Prevention · doi:10.1158/1055-9965.epi-15-1206 · Cited by 59
Vuckovic, D. (2018) · Chemical Communications · doi:10.1039/c8cc02592d · Cited by 60
Circadian and Sleep Metabolomics Across Species
Malik, D. M., Paschos, G. K., Sehgal, A., & Weljie, A. M. (2020) · Journal of Molecular Biology · doi:10.1016/j.jmb.2020.04.027 · Cited by 54
Rapid and reversible control of human metabolism by individual sleep states
Nowak, N., Gaisl, T., Miladinovic, D., Marcinkevičs, R., Osswald, M., Bauer, S., Buhmann, J. M., Zenobi, R., Sinues, P., Brown, S. A., et al. (2021) · Cell Reports · doi:10.1016/j.celrep.2021.109903 · Cited by 51
Nutrient timing and metabolic regulation
Smith, H. A., & Betts, J. A. (2022) · The Journal of Physiology · doi:10.1113/jp280756 · Cited by 54
Wefers, J., Connell, N. J., Fealy, C. E., Andriessen, C., de Wit‐Verheggen, V. H. W., van Moorsel, D., Moonen‐Kornips, E., Jörgensen, J. A., Hesselink, M. K. C., Havekes, B., et al. (2020) · Molecular Metabolism · doi:10.1016/j.molmet.2020.101050 · Cited by 51
Joyce, J. B., Grant, C. W., Liu, D., MahmoudianDehkordi, S., Kaddurah‐Daouk, R., Skime, M. K., Biernacka, J. M., Frye, M. A., Mayes, T. L., Carmody, T. J., et al. (2021) · Translational Psychiatry · doi:10.1038/s41398-021-01632-z · Cited by 48
Find the Needle in the Haystack, Then Find It Again: Replication and Validation in the ‘Omics Era
Perng, W., & Aslibekyan, S. W. (2020) · Metabolites · doi:10.3390/metabo10070286 · Cited by 47
Challenges in the Metabolomics-Based Biomarker Validation Pipeline
Li, S., Looby, N., Chandran, V., & Kulasingam, V. (2024) · Metabolites · doi:10.3390/metabo14040200 · Cited by 55
Grant, L. K., Ftouni, S., Nijagal, B., Souza, D. P. D., Tull, D., McConville, M. J., Rajaratnam, S. M. W., Lockley, S. W., & Anderson, C. (2019) · Scientific Reports · doi:10.1038/s41598-019-40353-8 · Cited by 48
Circadian rhythm of lipid metabolism
Sinturel, F., Spaleniak, W., & Dibner, C. (2022) · Biochemical Society Transactions · doi:10.1042/bst20210508 · Cited by 43
Developing preliminary blood metabolomics-based biomarkers of insufficient sleep in humans
Depner, C. M., Cogswell, D. T., Bisesi, P. J., Markwald, R. R., Cruickshank-Quinn, C. I., Quinn, K. D., Melanson, E. L., Reisdorph, N. A., & Wright, K. P. (2020) · SLEEP · doi:10.1093/sleep/zsz321 · Cited by 46
Circadian- and Light-driven Metabolic Rhythms in Drosophila melanogaster
Rhoades, S. D., Nayak, K., Zhang, S., Sehgal, A., & Weljie, A. M. (2018) · Journal of Biological Rhythms · doi:10.1177/0748730417753003 · Cited by 39
Ladva, C. N., Golan, R., Greenwald, R., Yu, T., Sarnat, S. E., Flanders, W. D., Uppal, K., Walker, D. I., Tran, V., Liang, D., et al. (2017) · Journal of Breath Research · doi:10.1088/1752-7163/aa863c · Cited by 41
Kent, B. A., Rahman, S. A., Hilaire, M. A. S., Grant, L. K., Rüger, M., Czeisler, C. A., & Lockley, S. W. (2022) · Nature Communications · doi:10.1038/s41467-022-28308-6 · Cited by 42
Bioanalytical Techniques in Nontargeted Clinical Lipidomics
Hyötyläinen, T., & Orešič, M. (2016) · Bioanalysis · doi:10.4155/bio.15.244 · Cited by 38
Bub, A., Kriebel, A., Dörr, C., Bandt, S., Rist, M. J., Röth, A., Hummel, E., Kulling, S. E., Hoffmann, I., & Watzl, B. (2016) · JMIR Research Protocols · doi:10.2196/resprot.5792 · Cited by 38
Modulation of sleep by trafficking of lipids through the Drosophila blood-brain barrier
Artiushin, G., Li, F., & Sehgal, A. (2023) · eLife · doi:10.7554/elife.86336 · Cited by 37
Emwas, A.-H. M., Zacharias, H. U., Alborghetti, M. R., Gowda, G. A. N., Raftery, D., McKay, R. T., Chang, C., Saccenti, E., Gronwald, W., Schuchardt, S., et al. (2025) · Metabolomics · doi:10.1007/s11306-025-02259-7 · Cited by 42
Gogna, N., Singh, V. J., Sheeba, V., & Dorai, K. (2015) · Molecular BioSystems · doi:10.1039/c5mb00386e · Cited by 35
Roy‐Lachapelle, A., Solliec, M., Sauvé, S., & Gagnon, C. (2019) · Toxins · doi:10.3390/toxins11110619 · Cited by 37
Sleep restriction induced energy, methylation and lipogenesis metabolic switches in rat liver
Sengupta, A., Rhoades, S. D., Kim, E. J., Nayak, S., Grant, G. R., Meerlo, P., & Weljie, A. M. (2017) · The International Journal of Biochemistry & Cell Biology · doi:10.1016/j.biocel.2017.08.014 · Cited by 35
Population Screening for Biological and Environmental Properties of the Human Metabolic Phenotype
Walker, D. I., Go, Y., Liu, K., Pennell, K. D., & Jones, D. P. (2016) · Elsevier eBooks · doi:10.1016/b978-0-12-800344-2.00007-0 · Cited by 34
Schäbler, S., Amatobi, K. M., Horn, M., Rieger, D., Helfrich‐Förster, C., Mueller, M. J., Wegener, C., & Fekete, Á. (2020) · Cellular and Molecular Life Sciences · doi:10.1007/s00018-019-03441-6 · Cited by 31
Bränn, E., Malavaki, C. J., Fransson, E., Ioannidi, M.-K., Henriksson, H. E., Papadopoulos, F. C., Chrousos, G. P., Klapa, M. I., & Skalkidou, A. (2021) · Frontiers in Psychiatry · doi:10.3389/fpsyt.2021.685656 · Cited by 32
Metabolic Impairment in Coronary Artery Disease: Elevated Serum Acylcarnitines Under the Spotlights
Gander, J., Carrard, J., Gallart‐Ayala, H., Borreggine, R., Teav, T., Infanger, D., Colledge, F., Streese, L., Wagner, J., Klenk, C., et al. (2021) · Frontiers in Cardiovascular Medicine · doi:10.3389/fcvm.2021.792350 · Cited by 36
Wei, Y., Wang, Z., Chang, C.-Y., Fan, T., Su, L., Chen, F., & Christiani, D. C. (2013) · PLoS ONE · doi:10.1371/journal.pone.0077413 · Cited by 32
An, Z., Shi, C., Li, P., & Liu, L. (2021) · Biology Open · doi:10.1242/bio.055020 · Cited by 32
Hancox, T. P. M., Skene, D. J., Dallmann, R., & Dunn, W. B. (2021) · Metabolites · doi:10.3390/metabo11050328 · Cited by 34
Self-citationConsiderations on how to light the night-shift
Löwden, A., & Kecklund, G. (2021) · Lighting Research & Technology · doi:10.1177/14771535211012251 · Cited by 30
Circadian Rhythms Versus Daily Patterns in Human Physiology and Behavior
Broussard, J. L., Reynolds, A. C., Depner, C. M., Ferguson, S. A., Dawson, D. E., & Wright, K. P. (2017) · Springer eBooks · doi:10.1007/978-81-322-3688-7_13 · Cited by 33
Fasting blood triglycerides vary with circadian phase in both young and older people
Yuan, R. K., Zitting, K., Wang, W., Buxton, O. M., Williams, J. S., Duffy, J. F., & Czeisler, C. A. (2020) · Physiological Reports · doi:10.14814/phy2.14453 · Cited by 27
Li, H., & Seugnet, L. (2024) · Neural Regeneration Research · doi:10.4103/nrr.nrr-d-23-02020 · Cited by 29
Identification of a Preliminary Plasma Metabolome-based Biomarker for Circadian Phase in Humans
Cogswell, D. T., Bisesi, P. J., Markwald, R. R., Cruickshank-Quinn, C. I., Quinn, K. D., McHill, A. W., Melanson, E. L., Reisdorph, N. A., Wright, K. P., & Depner, C. M. (2021) · Journal of Biological Rhythms · doi:10.1177/07487304211025402 · Cited by 27
Systems Biology-Derived Discoveries of Intrinsic Clocks
Millius, A., & Ueda, H. R. (2017) · Frontiers in Neurology · doi:10.3389/fneur.2017.00025 · Cited by 27
Dynamic behavior of cell-free mitochondrial DNA in human saliva
Trumpff, C., Rausser, S., Haahr, R., Karan, K. R., Gouspillou, G., Puterman, E. M., Kirschbaum, C., & Picard, M. A. (2021) · Psychoneuroendocrinology · doi:10.1016/j.psyneuen.2022.105852 · Cited by 26
Chewing the fat: How lipidomics is changing our understanding of human health and disease in 2022
Géhin, C., Fowler, S. J., & Trivedi, D. K. (2023) · Analytical Science Advances · doi:10.1002/ansa.202300009 · Cited by 22
Time-restricted feeding mice a high-fat diet induces a unique lipidomic profile
Mehus, A. A., RUST, B. M., Idso, J. P., Hanson, B., Zeng, H., Yan, L., Bukowski, M. R., & Picklo, M. J. (2020) · The Journal of Nutritional Biochemistry · doi:10.1016/j.jnutbio.2020.108531 · Cited by 23
Hodek, O., Henderson, J., Argemi‐Muntadas, L., Khan, A., & Möritz, T. (2023) · Journal of Chromatography B · doi:10.1016/j.jchromb.2023.123719 · Cited by 22
Short-Term Stability of Serum and Liver Extracts for Untargeted Metabolomics and Lipidomics
Hričko, J., Kulhavá, L., Paucova, M., Nováková, M., Kuda, O., Fiehn, O., & Čajka, T. (2023) · Antioxidants · doi:10.3390/antiox12050986 · Cited by 22
Oishi, K., Yamamoto, S., Itoh, N., Miyazaki, K., Nemoto, T., Nakakita, Y., & Kaneda, H. (2014) · Biochemical and Biophysical Research Communications · doi:10.1016/j.bbrc.2014.06.083 · Cited by 22
Daily fluctuation of colonic microbiome in response to nutrient substrates in a pig model
Wang, H., Xu, R., Li, Q., Su, Y., & Zhu, W. (2023) · npj Biofilms and Microbiomes · doi:10.1038/s41522-023-00453-w · Cited by 23
Metabolomics reveal circadian control of cellular metabolism
Ch, R., Chevallier, O. P., & Elliott, C. T. (2020) · TrAC Trends in Analytical Chemistry · doi:10.1016/j.trac.2020.115986 · Cited by 22
Ang, J., Pandher, R., Ang, J. C., Asad, Y., Henley, A., Valenti, M., Box, G., Brandon, A. K. D. H., Baird, R., Friedman, L., et al. (2016) · Molecular Cancer Therapeutics · doi:10.1158/1535-7163.mct-15-0815 · Cited by 19
Self-citationCircadian variations in the liver metabolites of medaka (Oryzias latipes)
Fujisawa, K., Takami, T., Kimoto, Y., Matsumoto, T., Yamamoto, N., Terai, S., & Sakaida, I. (2016) · Scientific Reports · doi:10.1038/srep20916 · Cited by 19
Time is ripe: maturation of metabolomics in chronobiology
Rhoades, S. D., Sengupta, A., & Weljie, A. M. (2016) · Current Opinion in Biotechnology · doi:10.1016/j.copbio.2016.09.007 · Cited by 19
Reproducibility of non-fasting plasma metabolomics measurements across processing delays
Wang, Y., Carter, B. D., Gapstur, S. M., McCullough, M. L., Gaudet, M. M., & Stevens, V. L. (2018) · Metabolomics · doi:10.1007/s11306-018-1429-6 · Cited by 21
Goel, N. (2015) · Current Sleep Medicine Reports · doi:10.1007/s40675-014-0003-7 · Cited by 21
Diurnal rhythm of plasma EPA and DHA in healthy adults
Jackson, P. A., Husberg, C., Hustvedt, S. O., Calder, P. C., Khan, J., Avery, H., Forster, J. S., & Kennedy, D. O. (2020) · Prostaglandins Leukotrienes and Essential Fatty Acids · doi:10.1016/j.plefa.2020.102054 · Cited by 18
Schmidt, R. J., Liang, D., Busgang, S. A., Curtin, P. C. P., & Giulivi, C. (2021) · Metabolites · doi:10.3390/metabo11080545 · Cited by 18
Multi-Omics Reveal Interplay between Circadian Dysfunction and Type2 Diabetes
Tiwari, A., Rathor, P., Trivedi, P. K., & Ch, R. (2023) · Biology · doi:10.3390/biology12020301 · Cited by 18
Lipidomics in Health and Diseases - Beyond the Analysis of Lipids
Fan, M. L. P. (2015) · Journal of Glycomics & Lipidomics · doi:10.4172/2153-0637.1000126 · Cited by 17
Amatobi, K. M., Ozbek-Unal, A. G., Schäbler, S., Deppisch, P., Helfrich‐Förster, C., Mueller, M. J., Wegener, C., & Fekete, Á. (2023) · Journal of Lipid Research · doi:10.1016/j.jlr.2023.100417 · Cited by 16
The foodomics approach for discovering biomarkers of food consumption in nutrition studies
Bordoni, A., & Capozzi, F. (2015) · Current Opinion in Food Science · doi:10.1016/j.cofs.2015.07.005 · Cited by 17
Memik, N. Ç., Hunç, F., Kalayci, S., DEMİR, N., Şentürk, E., Gündoğdu, Ö. Y., & Dillioğlugil, M. Ö. (2022) · Archives of Suicide Research · doi:10.1080/13811118.2022.2066494 · Cited by 16
Omics Approaches in Sleep-Wake Regulation
O’Callaghan, E. K., Green, E. W., Franken, P., & Mongrain, V. (2018) · Handbook of experimental pharmacology · doi:10.1007/164_2018_125 · Cited by 18
Rusilowicz, M. J., Dickinson, M., Charlton, A. J., O’Keefe, S., & Wilson, J. C. (2018) · PLoS ONE · doi:10.1371/journal.pone.0205968 · Cited by 16
Investigation of metabolites for estimating blood deposition time
Lech, K., Liu, F., Davies, S. K., Ackermann, K., Ang, J. E., Middleton, B., Revell, V. L., Raynaud, F. I., Hoveijn, I., Hut, R. A., et al. (2017) · International Journal of Legal Medicine · doi:10.1007/s00414-017-1638-y · Cited by 16
Self-citationMetabolic Basis of Circadian Dysfunction in Parkinson’s Disease
Rathor, P., & Ch, R. (2023) · Biology · doi:10.3390/biology12101294 · Cited by 17
Monitoring changes in the healthy female metabolome across the menstrual cycle using GC × GC-TOFMS
Eshima, J., Ong, S., Davis, T. J., Miranda, C., Krishnamurthy, D., Nachtsheim, A. C., Stufken, J., Plaisier, C. L., Fricks, J., Bean, H. D., et al. (2019) · Journal of Chromatography B · doi:10.1016/j.jchromb.2019.04.046 · Cited by 15
Diurnal variation of metabolites in three individual participants
Gu, F., Klerman, E. B., Kim, S., Moore, S., Yu, K. F., Albert, P. S., & Caporaso, N. E. (2018) · Chronobiology International · doi:10.1080/07420528.2018.1541901 · Cited by 13
Circadian orchestration of host and gut microbiota in infection
Xia, Y., Ding, X., Wang, S., & Ren, W. (2022) · Biological reviews/Biological reviews of the Cambridge Philosophical Society · doi:10.1111/brv.12898 · Cited by 16
An Overview of the Latest Metabolomics Studies on Atopic Eczema with New Directions for Study
Afghani, J., Traidl‐Hoffmann, C., Schmitt‐Kopplin, P., Reiger, M., & Mueller, C. (2022) · International Journal of Molecular Sciences · doi:10.3390/ijms23158791 · Cited by 13
Metabolomic Profiling of Tumor-Bearing Mice
Wettersten, H. I., Ganti, S. N., & Weiss, R. H. (2014) · Methods in enzymology on CD-ROM/Methods in enzymology · doi:10.1016/b978-0-12-801329-8.00014-3 · Cited by 13
Ang, J. E., Pál, Á., Asad, Y. J., Henley, A. T., Valenti, M. R., Box, G., Brandon, A. D. H., Revell, V. L., Skene, D. J., Venturi, M., et al. (2017) · Molecular Cancer Therapeutics · doi:10.1158/1535-7163.mct-16-0881 · Cited by 12
Self-citationSmith, H., Templeman, I., Davis, M., Slater, T., Clayton, D. J., Varley, I., James, L. J., Middleton, B., Johnston, J. D., Karagounis, L. G., et al. (2024) · The Journal of Clinical Endocrinology & Metabolism · doi:10.1210/clinem/dgae350 · Cited by 12
Self-citationMetabolomic profiles in night shift workers: A cross-sectional study on hospital female nurses
Borroni, E., Frigerio, G., Polledri, E., Mercadante, R., Maggioni, C., Fedrizzi, L., Pesatori, A. C., Fustinoni, S., & Carugno, M. (2023) · Frontiers in Public Health · doi:10.3389/fpubh.2023.1082074 · Cited by 11
Metadata
- Authors
- Ang, J. E., Revell, V., Mann, A., Mäntele, S., Otway, D. T., Johnston, J. D., Thumser, A. E., Skene, D. J., & Raynaud, F.
- Affiliations
- Institute of Cancer Research (GB)
- University of Surrey (GB)
- Corresponding author
- Ang, Joo Ern
- Raynaud, Florence
- ORCID
- Venue
- Chronobiology International
- Publisher
- Informa UK Limited
- Published
- 2012-07-23
- Volume
- 29
- Issue
- 7
- Pages
- 868-881
- ISSN
- 0742-0528 (ISSN-L)
- 1525-6073
- PMC
- PMC3433180
- OpenAlex
- W2043615829
- Cited by
- 138
- References
- 35
- Citations by year
- 2026: 5 · 2025: 6 · 2024: 8 · 2023: 14 · 2022: 12 · 2021: 14 · 2020: 14 · 2019: 9 · 2018: 8 · 2017: 10 · 2016: 12 · 2015: 13 · 2014: 9 · 2013: 4
- FWCI
- 3.47
- Type
- journal article
- Language
- en
- Open access
- green
- www.ncbi.nlm.nih.gov
- Licence
- cc-by
- Locations
- Chronobiology International (publishedVersion)
- Europe PMC (PubMed Central) (publishedVersion, cc-by)
- PubMed Central (publishedVersion, cc-by)
- PubMed (publishedVersion)
- Surrey Research Insight Open Access (The University of Surrey) (submittedVersion)
- Funders
- Wellcome Trust (090952/Z/09/Z)
- Cancer Research UK (11566, C309/A8274, C309/A2187)
- Biotechnology and Biological Sciences Research Council (BB/I019405/1, BB/D526853/1)
- Topics
- Life Sciences › Biochemistry, Genetics and Molecular Biology › Molecular Biology › Metabolomics and Mass Spectrometry Studies
- Life Sciences › Neuroscience › Endocrine and Autonomic Systems › Circadian rhythm and melatonin
- Social Sciences › Psychology › Experimental and Cognitive Psychology › Sleep and Work-Related Fatigue
- Keywords
- circadian rhythm, diurnal variation, plasma metabolites, acylcarnitines, phospholipids, corticosteroids, bilirubin, amino acids, daily rhythms, cosinor analysis, untargeted metabolomics, sleep timing, metabolite identification
- MeSH terms
- Acetylcarnitine, Blood Chemical Analysis, Chromatography, Liquid, Circadian Rhythm, Humans, Hydrocortisone, Lysophospholipids, Male, Middle Aged, Proline, Mass Spectrometry, Metabolomics, Metabolome
About these checks
Registry, retraction, Cites and statistics results are computed, not judged, with one exception: a printed reference that no index lists is read once by a model before it counts as a citation error. Claims are extracted by a model and kept only when their quote appears verbatim in the text; each cited source is then checked, with a model’s help, for whether it says what the claim relies on. Those verdicts can be wrong — read the claim’s quote and the cited source before relying on one.
Statistics and arithmetic are recomputed, not judged.
Confidence bands are shown only for fields calibrated on our annotated test set. None is calibrated yet, so no band is shown.
What counts as a claim ›How we measure confidence ›How we check this ›
Are you an author, or do you see a problem with this page? Request a review
