

The DOI matches its Crossref record; 23 of the 23 references it cites were found in a registry or an index.
Simulation-based Active Learning for Systematic Reviews: A Scoping Review of Literature
Abstract
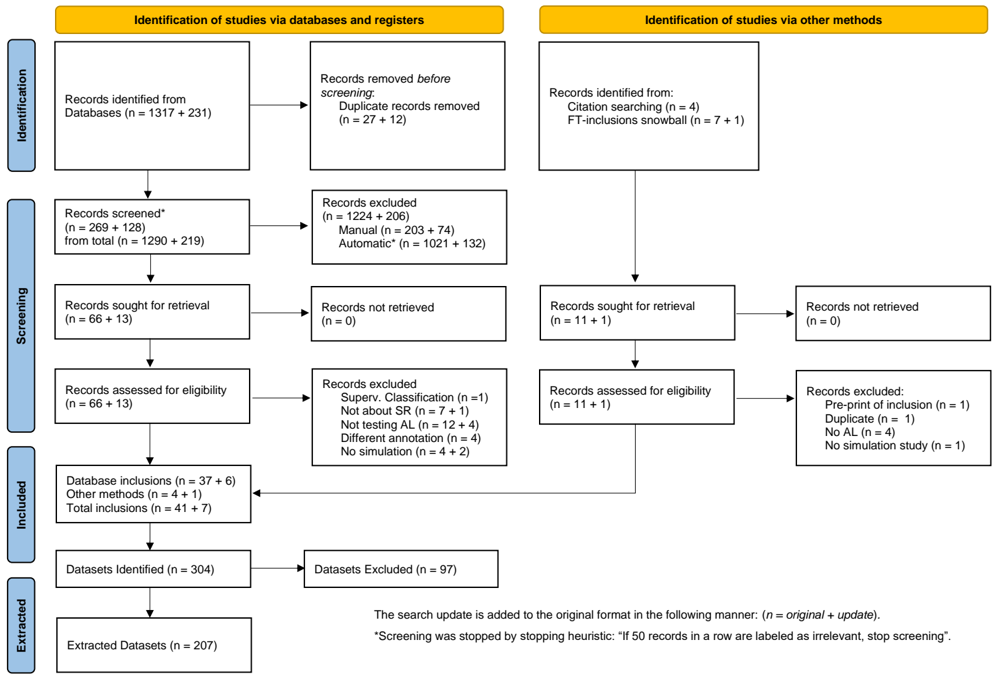
This scoping review investigated the utility of active learning in accelerating the systematic review process. We reviewed literature from 2006 onwards and selected 60 relevant articles out of 1887 screened, while incorporating 238 out of 336 collected datasets. Our analysis of the articles found that, despite some limitations, all 60 articles provided positive recommendations for using active learning to improve the efficiency of the screening phase in systematic reviews. Future research should focus on standardizing metrics, promoting open data, and diversifying models to advance active learning in systematic reviews.
Overview
The claims and statistics of this paper haven’t been checked yet.
Run the check — free, no account needed. It reads the open-access text and checks the sources it cites.
Integrity signals
Registry
Cites
Statistics
Figures
Verification
Claims the paper makes
The claims and statistics of this paper haven’t been checked yet.
Run the check — free, no account needed. It reads the open-access text and checks the sources it cites.
Claims other papers make about this one
Each is checked against this paper’s own text: does it say what the citing paper says it does?
In the citing paper
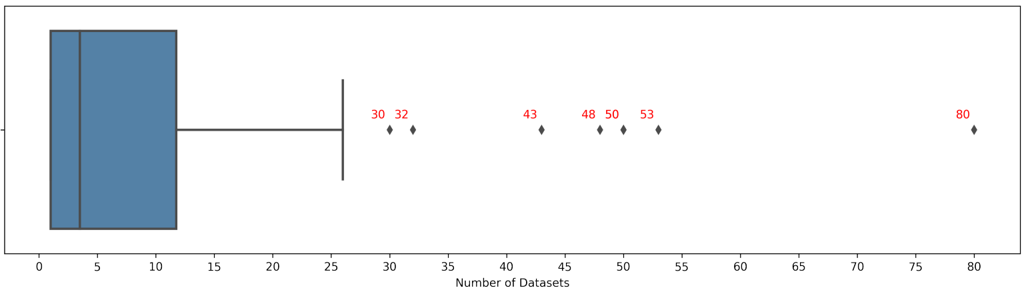
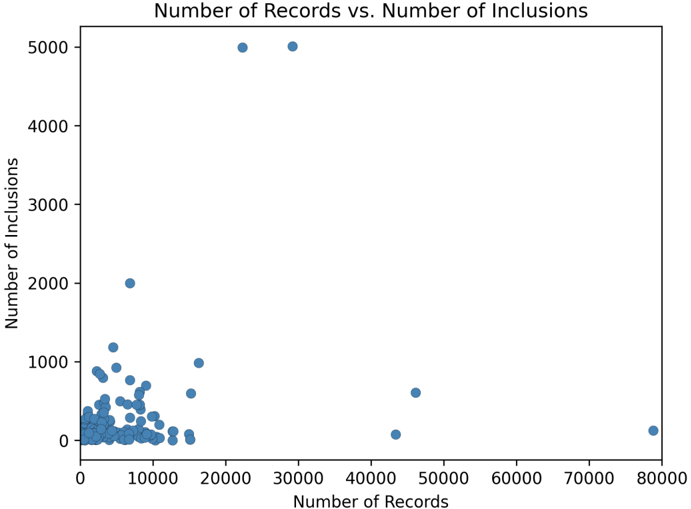
“First, the median number of datasets used in simulation studies evaluating the performance of multiple active learning models was under four datasets.”
From Large-scale simulation study of active learning models for systematic reviews (2025) · cites this paper as [55]
In the citing paper
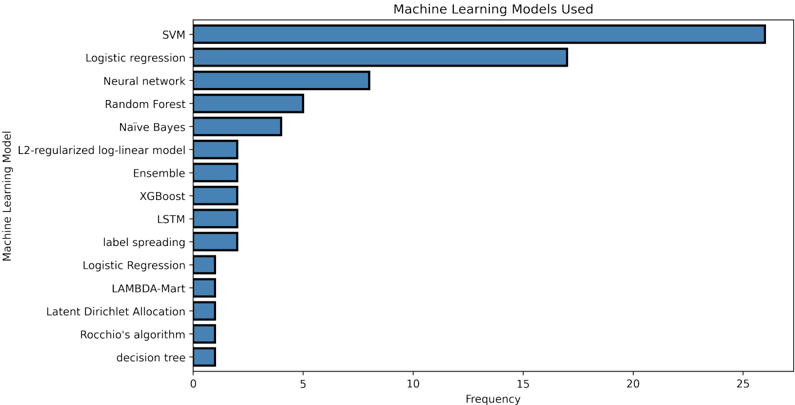
“Third, it was found that most simulation studies that compared active learning models typically involved no more than three distinct models.”
From Large-scale simulation study of active learning models for systematic reviews (2025) · cites this paper as [55]
In the citing paper
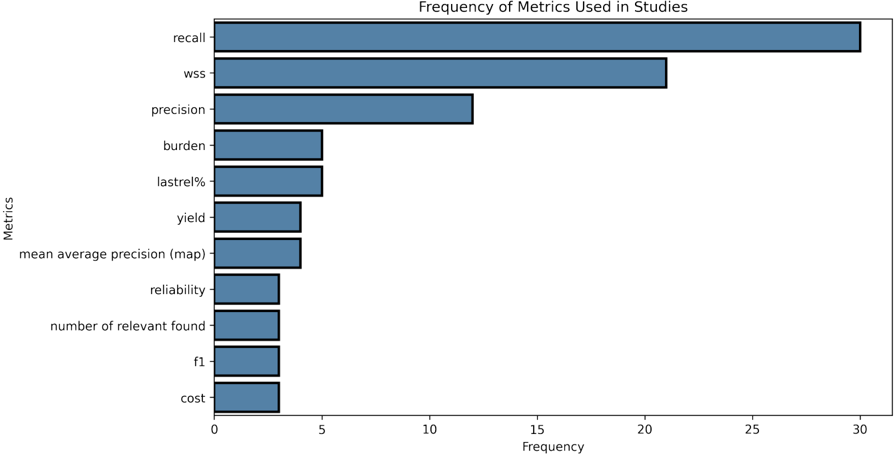
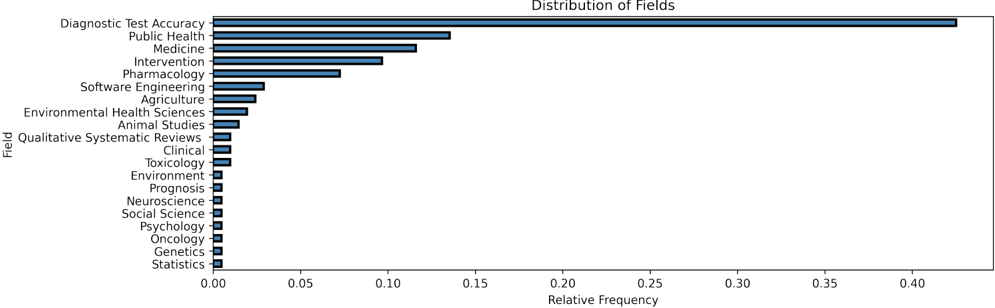
“However, performance simulation studies in this field face several limitations, including minimal use of data, a lack of diversity in studied domains, limited model comparisons, and the use of non-standardized metrics, as shown in the systematic review by [55].”
From Large-scale simulation study of active learning models for systematic reviews (2025) · cites this paper as [55]
Self-check
Percentages, sums and reported differences re-computed from the paper’s own numbers.
The self-check needs the paper’s full text.
Citations
Cites
An open source machine learning framework for efficient and transparent systematic reviews
van de Schoot, R., de Bruin, J., Schram, R., Zahedi, P., de Boer, J., Weijdema, F., Kramer, B., Huijts, M., Hoogerwerf, M., Ferdinands, G., et al. (2021) · Nature Machine Intelligence · doi:10.1038/s42256-020-00287-7 · Cited by 1,157
Self-citationO’Mara-Eves, A., Thomas, J., McNaught, J., Miwa, M., & Ananiadou, S. (2015) · Systematic Reviews · doi:10.1186/2046-4053-4-5 · Cited by 681
Systematic review automation technologies
Tsafnat, G., Glasziou, P., Choong, M. K., Dunn, A., Galgani, F., & Coiera, E. (2014) · Systematic Reviews · doi:10.1186/2046-4053-3-74 · Cited by 472
Automation of systematic literature reviews: A systematic literature review
van Dinter, R., Tekinerdogan, B., & Catal, C. (2021) · Information and Software Technology · doi:10.1016/j.infsof.2021.106589 · Cited by 432
Reducing Workload in Systematic Review Preparation Using Automated Citation Classification
Cohen, A. M., Hersh, W. R., Peterson, K., & Yen, P.-Y. (2006) · Journal of the American Medical Informatics Association · doi:10.1197/jamia.m1929 · Cited by 411 · cited 1×
“Noteworthy collections evaluated in this study include the Cohen dataset [71] and the CLEF datasets [39, 47], which are frequently employed in simulation research.”
Semi-automated screening of biomedical citations for systematic reviews
Wallace, B. C., Trikalinos, T. A., Lau, J., Brodley, C., & Schmid, C. H. (2010) · BMC Bioinformatics · doi:10.1186/1471-2105-11-55 · Cited by 351
Applications of text mining within systematic reviews
Thomas, J., McNaught, J., & Ananiadou, S. (2011) · Research Synthesis Methods · doi:10.1002/jrsm.27 · Cited by 212
Tools to support the automation of systematic reviews: a scoping review.
Khalil, H., Ameen, D., & Zarnegar, A. (2022) · Journal of Clinical Epidemiology · doi:10.1016/j.jclinepi.2021.12.005 · Cited by 190
Rathbone, J., Hoffmann, T., & Glasziou, P. (2015) · Systematic Reviews · doi:10.1186/s13643-015-0067-6 · Cited by 184
Howard, B. E., Phillips, J., Tandon, A., Maharana, A., Elmore, R., Mav, D., Sedykh, A., Thayer, K., Merrick, B. A., Walker, V., et al. (2020) · Environment International · doi:10.1016/j.envint.2020.105623 · Cited by 157
Prioritising references for systematic reviews with RobotAnalyst: A user study
Przybyła, P., Brockmeier, A. J., Kontonatsios, G., Le Pogam, M., McNaught, J., von Elm, E., Nolan, K., & Ananiadou, S. (2018) · Research Synthesis Methods · doi:10.1002/jrsm.1311 · Cited by 148
Hamel, C., Kelly, S. E., Thavorn, K., Rice, D. B., Wells, G. A., & Hutton, B. (2020) · BMC Medical Research Methodology · doi:10.1186/s12874-020-01129-1 · Cited by 140
Tsou, A. Y., Treadwell, J. R., Erinoff, E., & Schoelles, K. (2020) · Systematic Reviews · doi:10.1186/s13643-020-01324-7 · Cited by 122
Statistical stopping criteria for automated screening in systematic reviews
Callaghan, M. W., & Müller-Hansen, F. (2020) · Systematic Reviews · doi:10.1186/s13643-020-01521-4 · Cited by 121
Cierco Jimenez, R., Lee, T., Rosillo, N., Cordova, R., Cree, I. A., Gonzalez, A., & Indave Ruiz, B. I. (2022) · BMC Medical Research Methodology · doi:10.1186/s12874-022-01805-4 · Cited by 85
Finding better active learners for faster literature reviews
Yu, Z., Kraft, N. A., & Menzies, T. (2018) · Empirical Software Engineering · doi:10.1007/s10664-017-9587-0 · Cited by 83
Scott, A. M., Forbes, C., Clark, J., Carter, M., Glasziou, P., & Munn, Z. (2021) · Journal of Clinical Epidemiology · doi:10.1016/j.jclinepi.2021.06.030 · Cited by 81 · cited 1×
“Active learning is already incorporated into numerous software tools[7, 5, 8, 9, 10, 11, 12, 13, 14, 15, 16, 17, 18] 1 , and there’s an extensive field where the performance of active learning is assessed using simulation studies.”
Robledo, S., Grisales Aguirre, A. M., Hughes, M., & Eggers, F. (2023) · Journal of Small Business Management · doi:10.1080/00472778.2021.1955125 · Cited by 80
FAST2: An intelligent assistant for finding relevant papers
Yu, Z., & Menzies, T. (2019) · Expert Systems with Applications · doi:10.1016/j.eswa.2018.11.021 · Cited by 80
Cowie, K., Rahmatullah, A., Hardy, N., Holub, K., & Kallmes, K. (2022) · JMIR Medical Informatics · doi:10.2196/33219 · Cited by 68
Evaluating software tools to conduct systematic reviews: a feature analysis and user survey
Pellegrini, M., & Marsili, F. (2021) · Form@re - Open Journal per la formazione in rete · doi:10.36253/form-11343 · Cited by 17
Teijema, J. J., Hofstee, L., Brouwer, M., de Bruin, J., Ferdinands, G., de Boer, J., Siso, P. V., van den Brand, S. A. G. E., Bockting, C., van de Schoot, R., et al. (2022) · doi:10.31234/osf.io/t7bpd · Cited by 14
Self-citationNieto González, D. M. (2022) · doi:10.11144/javeriana.10554.58492 · Cited by 6
Research works printed but not linked: 44
- I. J. Marshall and B. C. Wallace. "Toward systematic review automation: a practical guide to using machine learning tools in research synthesis". In: Syst Rev 8.1 (2019), p. 163. issn: 2046-4053 (Electronic) 2046-4053 (Linking). doi: 10.1186/s13643-019-1074-9. · DOI · Paper page
- Julian PT Higgins et al. Cochrane handbook for systematic reviews of interventions. John Wiley & Sons, 2019.
- Gaelen P. Adam, Byron C. Wallace, and Thomas A. Trikalinos. "Semi-automated Tools for Systematic Searches". In: Methods in Molecular Biology. Springer US, Sept. 2021, pp. 17-40. doi: 10.1007/978-1-0716-1566-9_2. url: https://doi.org/10.1007/978-1-0716-1566-9_2. · DOI · Paper page
- Gerit Wagner, Roman Lukyanenko, and Guy Paré. "Artificial intelligence and the conduct of literature reviews". In: Journal of Information Technology 37.2 (2022), pp. 209-226.
- Lucy Lu Wang and Kyle Lo. "Text mining approaches for dealing with the rapidly expanding literature on COVID-19". In: Briefings in Bioinformatics 22.2 (2021), pp. 781-799.
- Q. Xuan et al. "Application of natural language processing in systematic reviews". In: Chinese Journal of Evidence-Based Medicine 21(6) (2021), 715-720. doi: 10.7507/1672-2531.202012150. url: https://doi. org/10.7507/1672-2531.202012150. · DOI
- Lauke Stoel, Gijs Mourits, and Rens van de Schoot. Procedure and Results for the Initial Selection of Software for Systematically Screening Large Amounts of Textual Data Implementing Active Learning. 2023. doi: 10. 17605/OSF.IO/G3NKZ. url: osf.io/g3nkz. · DOI
- Makoto Miwa et al. "Reducing systematic review workload through certainty-based screening". In: Journal of Biomedical Informatics 51 (2014), pp. 242-253. issn: 15320464. doi: 10.1016/j.jbi.2014.06.005. · DOI · Paper page
- James Thomas et al. "Living systematic reviews: 2. Combining human and machine effort". In: Journal of clinical epidemiology 91 (2017), pp. 31-37. issn: 0895-4356.
- Sofie A G E van den Brand, Rens van de Schoot, and J J Teijema. A Systematic Review on Studies Evaluating the Performance of Active Learning Compared to Human Reading for Systematic Review Data. July 2021. doi: 10.17605/OSF.IO/T9HGM. url: osf.io/t9hgm. · DOI
- Sathish Muthu. "The efficiency of machine learning-assisted platform for article screening in systematic reviews in orthopaedics". In: International Orthopaedics (2022), pp. 1-6.
- Gerbrich Ferdinands. "AI-Assisted systematic reviewing: selecting studies to compare Bayesian versus Frequen- tist SEM for small sample sizes". In: Multivariate Behavioral Research 56.1 (2021), pp. 153-154.
- B. C. Wallace et al. "Modeling annotation time to reduce workload in comparative effectiveness reviews". In: pp. 28-35. doi: 10.1145/1882992.1882999. · DOI · Paper page
- B. C. Wallace et al. "Active learning for biomedical citation screening". In: pp. 173-181. doi: 10 . 1145 / 1835804.1835829. · DOI · Paper page
- B. C. Wallace et al. "Who should label what? instance allocation in multiple expert active learning". In: pp. 176-187. doi: 10.1137/1.9781611972818.16. · DOI
- Byron C. Wallace et al. "Deploying an interactive machine learning system in an evidence-based practice center: abstrackr". In: the 2nd ACM SIGHIT symposium. Miami, Florida, USA: ACM Press, p. 819. isbn: 978-1-4503-0781-9. doi: 10.1145/2110363.2110464. · DOI · Paper page
- K. H. Ambert et al. "Virk: An active learning-based system for bootstrapping knowledge base development in the neurosciences". In: Frontiers in Neuroinformatics 7.DEC (2013). doi: 10.3389/fninf.2013.00038. · DOI · Paper page
- Gordon V. Cormack and Maura R. Grossman. "Autonomy and Reliability of Continuous Active Learning for Technology-Assisted Review". In: arXiv:1504.06868 [cs] (2015). · arXiv
- P. Timsina, O. El-Gayar, and J. Liu. "Active learning for the automation of medical systematic review creation". In.
- Kazuma Hashimoto et al. "Topic detection using paragraph vectors to support active learning in systematic reviews". In: JOURNAL OF BIOMEDICAL INFORMATICS 62 (2016), pp. 59-65. issn: 1532-0464. doi: 10.1016/j.jbi.2016.06.001. · DOI
- Gordon V. Cormack and Maura R. Grossman. "Scalability of Continuous Active Learning for Reliable High- Recall Text Classification". In: CIKM'16: ACM Conference on Information and Knowledge Management. Indianapolis Indiana USA: ACM, pp. 1039-1048. isbn: 978-1-4503-4073-1. doi: 10.1145/2983323.2983776. · DOI
- G. V. Cormack and M. R. Grossman. "Technology-assisted review in empirical medicine: Waterloo participation in CLEF eHealth 2017". In: vol. 1866.
- Z. Yu and T. Menzies. "Data balancing for technologically assisted reviews: Undersampling or reweighting". In: vol. 1866.
- Rasmus Ros, Elizabeth Bjarnason, and Per Runeson. "A machine learning approach for semi-automated search and selection in literature studies". In: Proceedings of the 21st International Conference on Evaluation and Assessment in Software Engineering. 2017, pp. 118-127.
- C. Norman, M. Leeflang, and A. Névéol. "LIMSI@CLEF eHealth 2018 Task 2: Technology assisted reviews by stacking active and static learning". In: vol. 2125.
- Jun Liu, Prem Timsina, and Omar El-Gayar. "A comparative analysis of semi-supervised learning: The case of article selection for medical systematic reviews". In: INFORMATION SYSTEMS FRONTIERS 20.2, SI (2018), pp. 195-207. issn: 1387-3326. doi: 10.1007/s10796-016-9724-0. · DOI
- G. V. Cormack and M. R. Grossman. "Technology-assisted review in empirical medicine: Waterloo participation in CLEF eHealth 2018". In: vol. 2125.
- G. M. Di Nunzio. "Finding all the needles in a haystack: A System to estimate the costs of e-discovery and systematic reviews". In: vol. 2167, p. 106.
- E. Kanoulas et al. "CLEF 2019 technology assisted reviews in empirical medicine overview". In: vol. 2380.
- Christopher R. Norman et al. "Measuring the impact of screening automation on meta-analyses of diagnostic test accuracy". In: SYSTEMATIC REVIEWS 8.1 (2019). doi: 10.1186/s13643-019-1162-x. · DOI
- A. Carvallo and D. Parra. "Comparing word embeddings for document screening based on active learning". In: vol. 2414, pp. 100-107.
- A. Varghese et al. "Active learning in automated text classification: a case study exploring bias in predicted model performance metrics". In: Environment Systems and Decisions 39.3 (2019), pp. 269-280. doi: 10.1007/ s10669-019-09717-3. · DOI
- N. Halfpenny et al. "PNS335: Using Machine Learning for Efficiency Improvements in Systematic Literature Reviews of Clinical Efficacy and Safety". In: Value in Health 22.(Halfpenny N.; Eaton J.) Pharmerit Interna- tional, York, United Kingdom (2019), S821. issn: 1524-4733. doi: 10.1016/j.jval.2019.09.2235. · DOI
- J. Zou and E. Kanoulas. "Towards Question-based High-recall Information Retrieval". In: ACM Transactions on Information Systems 38.3 (2020). doi: 10.1145/3388640. · DOI
- H. Zhang et al. "Evaluating sentence-level relevance feedback for high-recall information retrieval". In: Infor- mation Retrieval Journal 23.1 (2020). doi: 10.1007/s10791-019-09361-0. · DOI
- Tomohide Yamada et al. "Deep Neural Network for Reducing the Screening Workload in Systematic Reviews for Clinical Guidelines: Algorithm Validation Study". In: Journal of Medical Internet Research 22.12 (2020), e22422. issn: 1438-8871. doi: 10.2196/22422. · DOI
- Andres Carvallo et al. "Automatic document screening of medical literature using word and text embeddings in an active learning setting". In: SCIENTOMETRICS 125.3 (2020), pp. 3047-3084. issn: 0138-9130. doi: 10.1007/s11192-020-03648-6. · DOI
- D. Li, P. Zafeiriadis, and E. Kanoulas. "APS: An Active PubMed Search System for Technology Assisted Reviews". In: pp. 2137-2140. doi: 10.1145/3397271.3401401. · DOI
- Rebecca Elmore et al. "Risk and Protective Factors in the COVID-19 Pandemic: A Rapid Evidence Map". In: FRONTIERS IN PUBLIC HEALTH 8 (2020). doi: 10.3389/fpubh.2020.582205. · DOI
- Zhichao Li et al. "Semi-Supervised Text Classification Framework: An Overview of Dengue Landscape Factors and Satellite Earth Observation". In: INTERNATIONAL JOURNAL OF ENVIRONMENTAL RESEARCH AND PUBLIC HEALTH 17.12 (2020). doi: 10.3390/ijerph17124509. · DOI
- Niamh Carey, Marie Harte, and Laura McCullagh. "The Use Of A Text-Mining Screening Tool For Systematic Review Of Treatments For Relapsed/Refractory Diffuse Large B-Cell Lymphoma". In: International Journal of Technology Assessment in Health Care 37.S1 (2021), pp. 2-2.
- Jingwen Hou et al. "Extreme Systematic Reviews: A Large Literature Screening Dataset to Support Environ- mental Policymaking". In: Proceedings of the 31st ACM International Conference on Information & Knowledge Management. 2022, pp. 4029-4033.
- Guilherme Dal Bianco, Denio Duarte, and Marcos André Gonçalves. "Reducing the user labeling effort in effective high recall tasks by fine-tuning active learning". In: Journal of Intelligent Information Systems (2023), pp. 1-20.
- B. K. Olorisade, P. Brereton, and P. Andras. "Reproducibility of studies on text mining for citation screening in systematic reviews: Evaluation and checklist". In: J Biomed Inform 73 (2017). Olorisade, Babatunde Kazeem Brereton, Pearl Andras, Peter eng 2017/07/18 J Biomed Inform. 2017 Sep;73:1-13. doi: 10.1016/j.jbi.2017.07.010. Epub 2017 Jul 12., pp. 1-13. issn: 1532-0480 (Electronic) 1532-0464 (Linking). doi: 10.1016/j.jbi.2017. 07.010. · DOI · Paper page
Cited by
ASReview LAB v.2: Open-source text screening with multiple agents and a crowd of experts
de Bruin, J., Lombaers, P., Kaandorp, C., Teijema, J., van der Kuil, T., Yazan, B., Dong, A., & van de Schoot, R. (2025) · Patterns · doi:10.1016/j.patter.2025.101318 · Cited by 27
Self-citationMachine learning to optimize literature screening in medical guideline development
Harmsen, W., de Groot, J., Harkema, A., van Dusseldorp, I., de Bruin, J., van den Brand, S., & van de Schoot, R. (2024) · Systematic Reviews · doi:10.1186/s13643-024-02590-5 · Cited by 21
Self-citationLarge-scale simulation study of active learning models for systematic reviews
Teijema, J. J., de Bruin, J., Bagheri, A., & van de Schoot, R. (2025) · International Journal of Data Science and Analytics · doi:10.1007/s41060-025-00777-0 · Cited by 13
Self-citation
Metadata
- Authors
- Teijema, J. J., Ribeiro, G., Seuren, S., Anadria, D., Bagheri, A., & van de Schoot, R.
- Publisher
- Center for Open Science
- Published
- 2023-06-29
- Cited by
- 10
- References
- 23
- Type
- Preprint
About these checks
Registry, retraction, Cites and statistics results are computed, not judged, with one exception: a printed reference that no index lists is read once by a model before it counts as a citation error. Claims are extracted by a model and kept only when their quote appears verbatim in the text; each cited source is then checked, with a model’s help, for whether it says what the claim relies on. Those verdicts can be wrong — read the claim’s quote and the cited source before relying on one.
Statistics and arithmetic are recomputed, not judged.
Confidence bands are shown only for fields calibrated on our annotated test set. None is calibrated yet, so no band is shown.
What counts as a claim ›How we measure confidence ›How we check this ›
Are you an author, or do you see a problem with this page? Request a review
Data sources
Bibliographic data: Semantic Scholar, OpenAlex, Crossref.
Contains information from the Semantic Scholar Academic Graph Datasets, made available under the ODC Attribution License (ODC-BY 1.0).
Semantic Scholar’s data is described in: Kinney, R., et al. (2023). The Semantic Scholar Open Data Platform. arXiv:2301.10140.
