

The DOI matches its Crossref record; 63 of the 63 references it cites were found in a registry or an index; none of the 32 sources its claims cite is checked for support yet.
Large-scale simulation study of active learning models for systematic reviews
Open accessAbstract
Despite progress in active learning, evaluation remains limited by constraints in simulation size, infrastructure, and dataset availability. This study advocates for large-scale simulations as the gold standard for evaluating active learning models in systematic review screening. Two large-scale simulations, totaling over 29 thousand runs, assessed active learning solutions. The first study evaluated 13 combinations of classification models and feature extraction techniques using high-quality datasets from the SYNERGY dataset. The second expanded this to 92 model combinations with additional classifiers and feature extractors. In every scenario tested, active learning outperformed random screening. The performance gained varied across datasets, models, and screening progression, ranging from considerable to near-flawless results. The findings demonstrate that active learning consistently outperforms random screening in systematic review tasks, offering significant efficiency gains. While the extent of improvement varies depending on the dataset, model choice, and screening stage, the overall advantage is clear. Since model performance differs, active learning systems should remain adaptable to accommodate new classifiers and feature extraction techniques. The publicly available results underscore the importance of open benchmarking to ensure reproducibility and the development of robust, generalizable active learning strategies.
Overview
CoChat Summary
TL;DR
This large-scale simulation study evaluated active learning for systematic review screening across 26 SYNERGY datasets, using 13 common model combinations in study 1 and 92 expanded combinations in study 2. Active learning consistently outperformed random screening, but no single classifier–feature extractor combination was universally best across datasets or screening stages.
Key findings
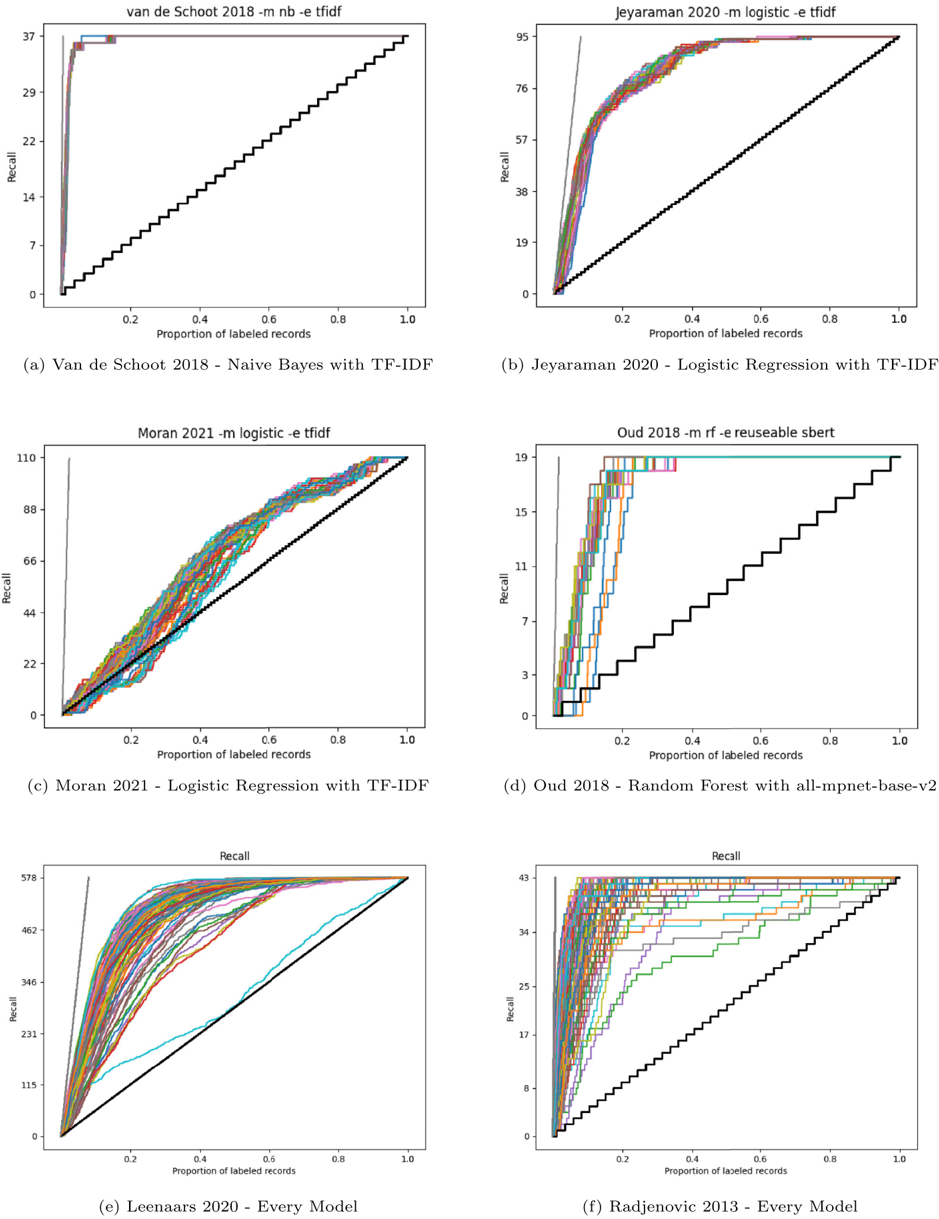
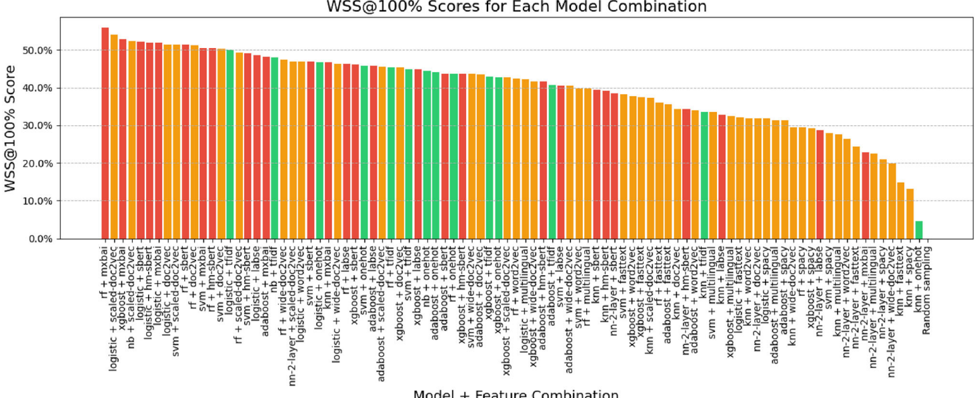
- Across all tested scenarios, active learning outperformed random screening; performance gains ranged from marginal to near-flawless depending on dataset, model, and screening stage.
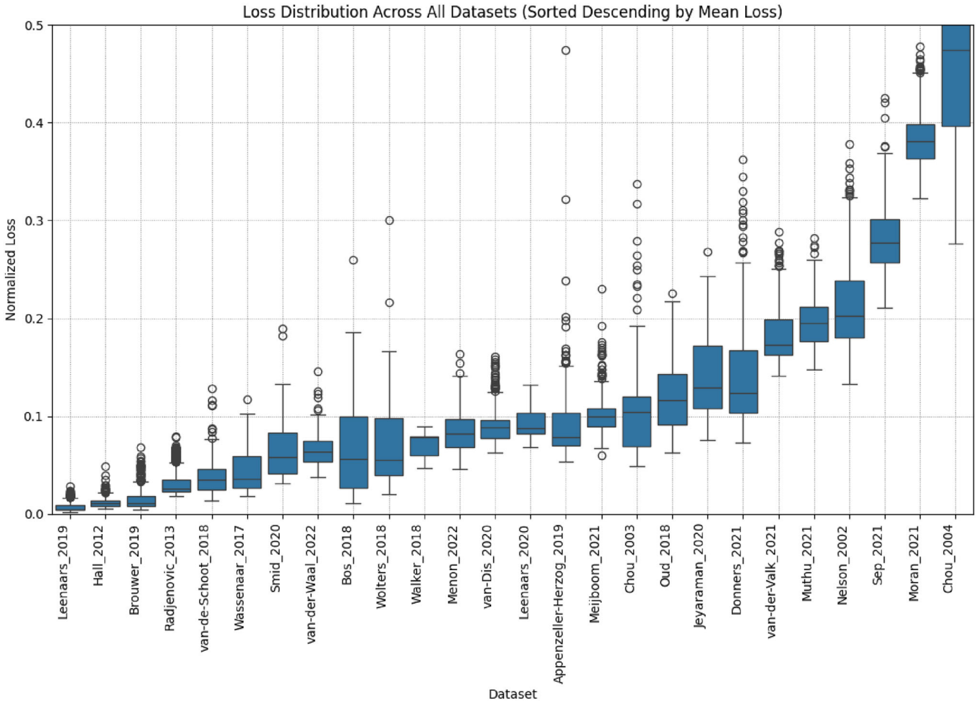
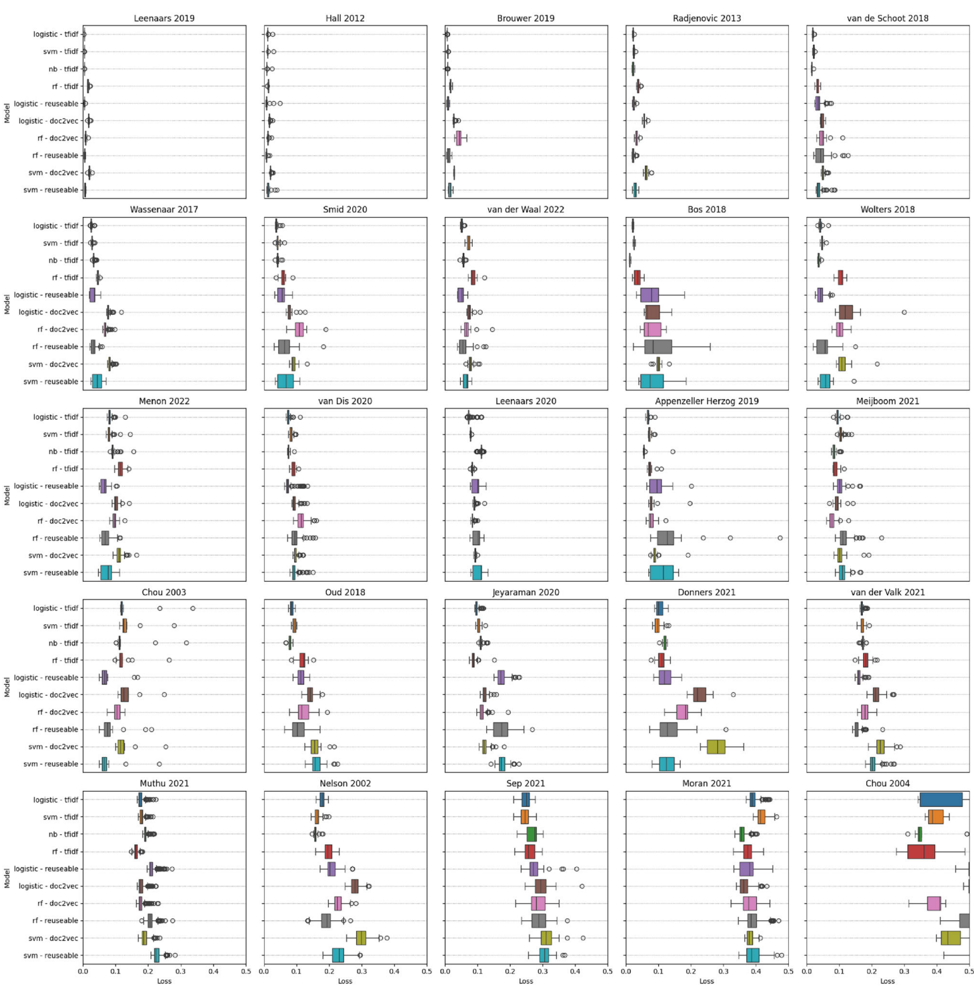
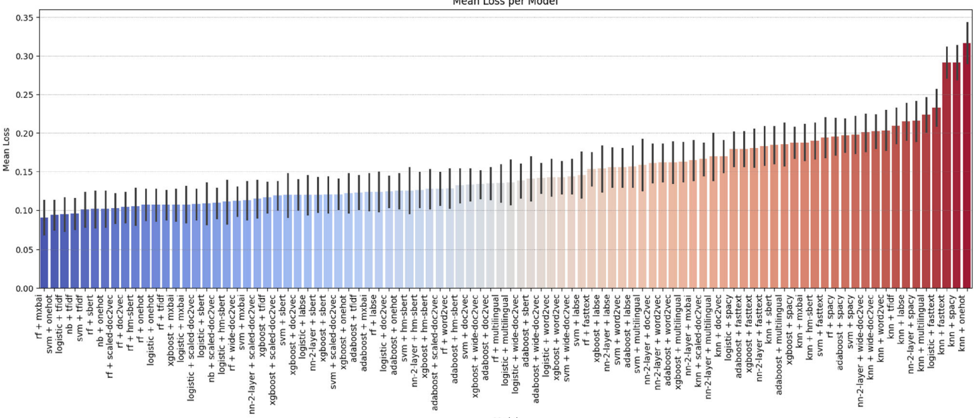
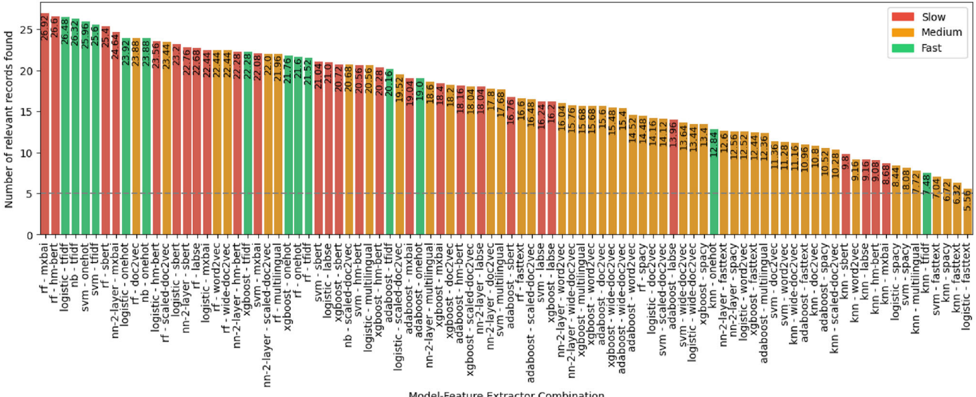
- No model was universally optimal: out of 26 datasets, 14 different classifier–feature extractor combinations achieved the lowest loss at least once, and the most frequent top performer, “mxbai-embed-large-v1 transformer with Random Forest,” was best in only 7 of 26 cases.
- For starting performance, the best models identified an average of 27 relevant records within the first 100 screened records, against a theoretical maximum of 51; 44 of 92 models reached the top-performing spot at least once.
- For last-to-find records, advanced models significantly outperformed simpler models, and Random Forest with mxbai-embed-large-v1 was recommended for identifying difficult final records.
Methods
- Two simulation studies used 26 prelabeled systematic review datasets from SYNERGY, spanning medicine, psychology, computational sciences, and biology, with dataset sizes from 238 to 48,375 records and relevance densities from <0.25% to >20%.
- Study 1 evaluated 13 classifier–feature extractor combinations using the ARFI template with one relevant record plus 10 fixed irrelevant records as prior knowledge; study 2 evaluated 92 combinations using the MultiModel template with 5 relevant and 10 irrelevant prior records.
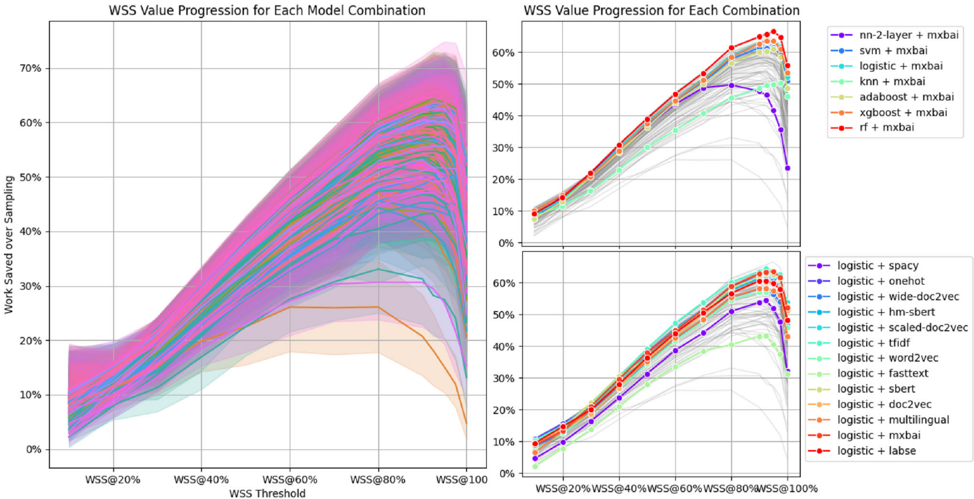
- Analyses used Normalized Recall Regret (Loss), Work Saved over Sampling (WSS@10%–WSS@100%), starting performance within the first 100 records, last-to-find performance, and Average Pair Distance heatmaps; simulations ran via ASReview on a Kubernetes cluster.
Limitations
- The paper states that not all possible configurations were covered: samplers and balancers were unexplored, models were treated as feature extractor–classifier combinations rather than separately, and hyperparameter optimization was not performed.
- The paper states that dataset characteristics such as size or topic showed no significant correlation with model preference, but 26 datasets were insufficient to draw conclusions, and SYNERGY remains 50% “medicine, NOS.”
- Evident from the text: the study relies on prelabeled retrospective datasets and simulated screening, so real-world reviewer behavior, stopping-rule interactions, and LLM-based classification remain outside the tested scope.
Model-written summary. Check it against the paper before relying on it.
Integrity signals
Registry
Cites
Statistics
Figures
Verification
Claims the paper makes
36 Own result · 26 Own interpretation · 20 Not checked yet · 6 Own method · 2 Check pending · 1 No full text of the sources
A result the paper reports from its own data — it cites no other source for it, so there is none to check. The quote shows it is in the paper.
In the paper
“Instead, the optimal model varies depending on the specific dataset, highlighting the need for a flexible, adaptable approach when creating active learning software.”
§ Large-scale simulation study of active learning models for systematic reviews > 4 Discussion
plainstates an association- Asserted: passes — The authors put it forward as true.
- Checkable: passes — It can be checked against evidence.
- Load-bearing: passes — The paper’s conclusions depend on it.
- Based: passes — The paper gives a reason why it holds.
A result the paper reports from its own data — it cites no other source for it, so there is none to check. The quote shows it is in the paper.
In the paper
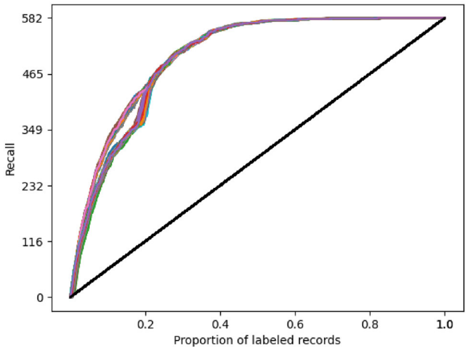
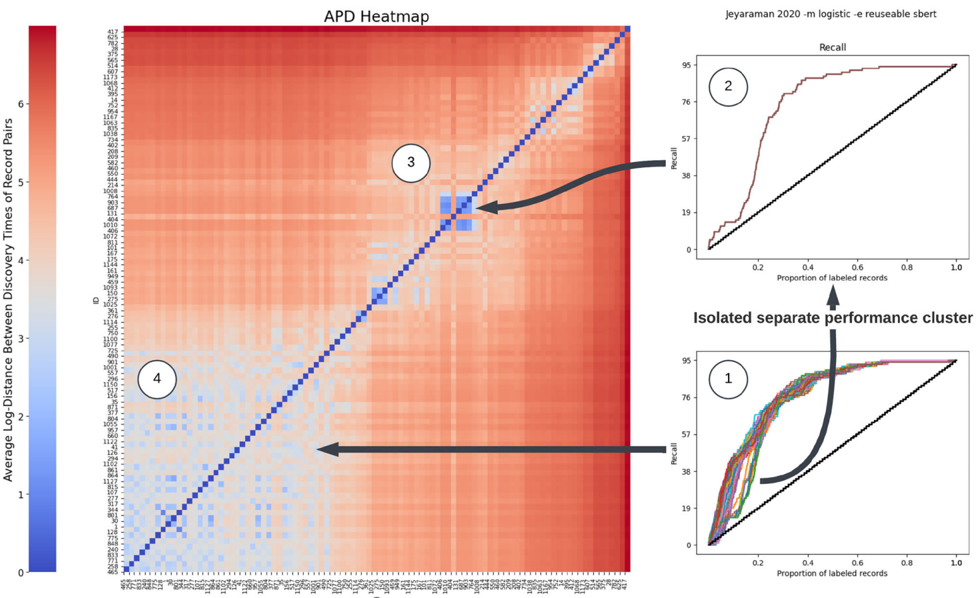
“When examining the documents from the subset, we find a significant overlap between the subcluster of identified records from the recall curve and the observed subcluster in the APD heatmap.”
§ Large-scale simulation study of active learning models for systematic reviews > Average Pair Distance Heatmap
plainstates an association- Asserted: passes — The authors put it forward as true.
- Checkable: passes — It can be checked against evidence.
- Load-bearing: passes — The paper’s conclusions depend on it.
- Based: passes — The paper gives a reason why it holds.
A result the paper reports from its own data — it cites no other source for it, so there is none to check. The quote shows it is in the paper.
In the paper
“Out of 92 models evaluated, 44 models reached the top-performing spot at least once.”
§ Large-scale simulation study of active learning models for systematic reviews > 3.2 Simulation Study 2
plain- Asserted: passes — The authors put it forward as true.
- Checkable: passes — It can be checked against evidence.
- Load-bearing: unclear — It is unclear whether the paper’s conclusions depend on it.
- Based: passes — The paper gives a reason why it holds.
A result the paper reports from its own data — it cites no other source for it, so there is none to check. The quote shows it is in the paper.
In the paper
“However, the current study shows that even the weakest models generally detect enough of a pattern to slightly outperform random sampling.”
§ Large-scale simulation study of active learning models for systematic reviews > 4 Discussion
plainstates a cause- Asserted: passes — The authors put it forward as true.
- Checkable: passes — It can be checked against evidence.
- Load-bearing: passes — The paper’s conclusions depend on it.
- Based: passes — The paper gives a reason why it holds.
A result the paper reports from its own data — it cites no other source for it, so there is none to check. The quote shows it is in the paper.
In the paper
“No model achieved superior performance across all datasets.”
§ Large-scale simulation study of active learning models for systematic reviews > 4 Discussion
plain- Asserted: passes — The authors put it forward as true.
- Checkable: passes — It can be checked against evidence.
- Load-bearing: passes — The paper’s conclusions depend on it.
- Based: passes — The paper gives a reason why it holds.
57 more claims
Create a free account to see all 91 claims and to verify the 29 references still open.
- It may state two separate claims as one. 14
- Probably not a substantial claim. 16
- The quote only partly states this claim. 2
Self-check
Percentages, sums and reported differences re-computed from the paper’s own numbers.
Each contradiction between two passages listed here was confirmed by an independent check.
Rated major: it would touch a result — a value a result rests on, reported and recomputed p-values on opposite sides of the significance level, two passages that conflict with no sign which is right, or a cited work retracted before this paper was published.
In the paper
§ Large-scale simulation study of active learning models for systematic reviews > 1 Introduction
“These simulations use only two records to start the active learning cycle.One relevant and one irrelevant document, which together, are known as the Prior Knowledge.”
§ Large-scale simulation study of active learning models for systematic reviews > 2.4 Prior knowledge
“In our first simulation study, we conduct one simulation for each relevant record, together with 10 fixed irrelevant records, using the ARFI (All Relevant -Fixed Irrelevant) template from ASReview-Makita [56] to minimize inter-dataset variation.”
Rated minor: it would not touch a result — a value no result rests on, a p-value that stays on the same side of the significance level, or a conflict that is clerical, resolved elsewhere in the paper, or outside its own findings.
In the paper
“Valk_2021 Medicine, Psychology 725 89 0.8%”
§ Large-scale simulation study of active learning models for systematic reviews > 2.3 Models
Reported 0.8 · recomputed 12.275862
Citations
Cites
XGBoost: A Scalable Tree Boosting System
Chen, T., & Guestrin, C. (2016) · Proceedings of the 22nd ACM SIGKDD International Conference on Knowledge Discovery and Data Mining · doi:10.1145/2939672.2939785 · Cited by 54,569
PRISMA-P Group, Moher, D., Shamseer, L., Clarke, M., Ghersi, D., Liberati, A., Petticrew, M., Shekelle, P., & Stewart, L. A. (2015) · Systematic Reviews · doi:10.1186/2046-4053-4-1 · Cited by 26,223
Page, M. J., Moher, D., Bossuyt, P. M., Boutron, I., Hoffmann, T. C., Mulrow, C. D., Shamseer, L., Tetzlaff, J. M., Akl, E. A., Brennan, S. E., et al. (2021) · BMJ · doi:10.1136/bmj.n160 · Cited by 13,262
Sentence-BERT: Sentence Embeddings using Siamese BERT-Networks
Reimers, N., & Gurevych, I. (2019) · Proceedings of the 2019 Conference on Empirical Methods in Natural Language Processing and the 9th International Joint Conference on Natural Language Processing (EMNLP-IJCNLP) · doi:10.18653/v1/d19-1410 · Cited by 12,778
Enriching Word Vectors with Subword Information
Bojanowski, P., Grave, E., Joulin, A., & Mikolov, T. (2017) · Transactions of the Association for Computational Linguistics · doi:10.1162/tacl_a_00051 · Cited by 9,645
Cumpston, M., Li, T., Page, M. J., Chandler, J., Welch, V. A., Higgins, J. P., & Thomas, J. (2019) · Cochrane Database of Systematic Reviews · doi:10.1002/14651858.ed000142 · Cited by 7,218
How to Fine-Tune BERT for Text Classification?
Sun, C., Qiu, X., Xu, Y., & Huang, X. (2019) · Lecture Notes in Computer Science · doi:10.1007/978-3-030-32381-3_16 · Cited by 1,534
An open source machine learning framework for efficient and transparent systematic reviews
van de Schoot, R., de Bruin, J., Schram, R., Zahedi, P., de Boer, J., Weijdema, F., Kramer, B., Huijts, M., Hoogerwerf, M., Ferdinands, G., et al. (2021) · Nature Machine Intelligence · doi:10.1038/s42256-020-00287-7 · Cited by 1,157
A Systematic Literature Review on Fault Prediction Performance in Software Engineering
Hall, T., Beecham, S., Bowes, D., Gray, D., & Counsell, S. (2012) · IEEE Transactions on Software Engineering · doi:10.1109/tse.2011.103 · Cited by 1,154
Language-agnostic BERT Sentence Embedding
Feng, F., Yang, Y., Cer, D., Arivazhagan, N., & Wang, W. (2022) · Proceedings of the 60th Annual Meeting of the Association for Computational Linguistics (Volume 1: Long Papers) · doi:10.18653/v1/2022.acl-long.62 · Cited by 758
Research works printed but not linked: 2
- Molinari, A., Kanoulas, E.: Transferring knowledge between topics in systematic reviews. Intell. Syst. Appl. 16, 200150 (2022)
- Xuan, Q., Jiali, L., Yuning, W., et al.: Application of natural language processing in systematic reviews. Chin. J. Evid.-Based Med. 21(6), 715–720 (2021). https://doi.org/10.7507/1672-2531.202012150 · DOI
Cited by
LLM-Guided Weak Supervision Improves Active Learning for Abstract ScreeningPreprint
Akinseloyin, O., Jiang, X., & Palade, V. (2025) · medRxiv · doi:10.1101/2025.08.24.25334314 · Cited by 6
ASReview Dory: Bringing new and exciting models to ASReview LAB
van der Kuil, T., Teijema, J. J., Bruin, J. D., & van de Schoot, R. (2026) · Software Impacts · doi:10.1016/j.simpa.2025.100809 · Cited by 2
Self-citationActive Learning for Medical Article Classification with Bag of Words and Bag of Concepts Embeddings
Pytlak, R., Cichosz, P., Fajdek, B., & Jastrzębski, B. (2025) · Applied Sciences · doi:10.3390/app15147955 · Cited by 1
Screenathon 2.0: human–AI collaborative screening applied to patient-generated health data
Bergmann, J. G., Azzi, T. D. S., Neeleman, R. C., Monschau, K., Yazan, B., Jalsovec, E., Westerbeek, E., Weijdema, F., Bruin, J. D., Fang, Q., et al. (2026) · Scientific Reports · doi:10.1038/s41598-026-45385-5 · Cited by 1
Empowered XR through Generative AI: Balancing Superpowers and Risks
Tang, Y., Wu, M., Situ, J., Liu, J., Cui, A. Y., & Huang, Y. (2026) · CHI Conference on Human Factors in Computing Systems · doi:10.1145/3772318.3791307 · Cited by 1
Metadata
- Authors
- Teijema, J. J., de Bruin, J., Bagheri, A., & van de Schoot, R.
- Affiliations
- Utrecht University (NL)
- Corresponding author
- Teijema, Jelle Jasper
- Venue
- International Journal of Data Science and Analytics
- Published
- 2025-05-02
- Volume
- 20
- Issue
- 6
- Pages
- 5435-5456
- ISSN
- 2364-4168 (ISSN-L)
- 2364-415X
- OpenAlex
- W4410030482
- Semantic Scholar
- a1024997e1ec0350279625c7185443a1bd3d0c2d
- Cited by
- 13
- References
- 63
- Citations by year
- 2026: 10 · 2025: 3
- FWCI
- 0.72
- Type
- journal article
- Language
- en
- Open access
- hybrid
- doi.org
- Locations
- International Journal of Data Science and Analytics (publishedVersion, cc-by)
- PsyArXiv (OSF Preprints) (submittedVersion, cc-by)
- Funders
- OCRE
- Topics
- Physical Sciences › Computer Science › Artificial Intelligence › Machine Learning and Algorithms
- Social Sciences › Decision Sciences › Statistics, Probability and Uncertainty › Meta-analysis and systematic reviews
- Physical Sciences › Computer Science › Information Systems › Information Retrieval and Search Behavior
- Keywords
- active learning (machine learning), systematic review screening, large-scale simulation, classifier comparison, feature extraction, random screening, benchmarking, reproducibility, screening efficiency
About these checks
Registry, retraction, Cites and statistics results are computed, not judged, with one exception: a printed reference that no index lists is read once by a model before it counts as a citation error. Claims are extracted by a model and kept only when their quote appears verbatim in the text; each cited source is then checked, with a model’s help, for whether it says what the claim relies on. Those verdicts can be wrong — read the claim’s quote and the cited source before relying on one.
A language model drew the claims from the paper on 2026-11-12, under version 3 of the claim definition (model deepseek-v4.1-flash, prompt extract-v3).
A second model labelled each claim on 2026-11-12 (model jev-1.13-20260917, definition revision gold-guideline-v0.2).
Statistics and arithmetic are recomputed, not judged.
Confidence bands are shown only for fields calibrated on our annotated test set. None is calibrated yet, so no band is shown.
What counts as a claim ›How we measure confidence ›How we check this ›
Are you an author, or do you see a problem with this page? Request a review
How to cite
Cite CoChat for the checks on this page, and the paper for its own findings.
- This page
- CoChat. (2026). Citation check: Large-scale simulation study of active learning models for systematic reviews. https://app.cochat.ai/papers/10.1007/s41060-025-00777-0
- The paper
- Teijema, J. J., de Bruin, J., Bagheri, A., & van de Schoot, R. (2025). Large-scale simulation study of active learning models for systematic reviews. International Journal of Data Science and Analytics. https://doi.org/10.1007/s41060-025-00777-0
Data sources
Bibliographic data: Semantic Scholar, OpenAlex, Crossref.
Contains information from the Semantic Scholar Academic Graph Datasets, made available under the ODC Attribution License (ODC-BY 1.0).
Semantic Scholar’s data is described in: Kinney, R., et al. (2023). The Semantic Scholar Open Data Platform. arXiv:2301.10140.
