

did2s: Two-Stage Difference-in-Differences
Open accessThe DOI matches its Crossref record; 17 of the 17 references it cites were found in a registry or an index; 10 of the 25 sources its claims cite were checked for support.
Abstract
Recent work has highlighted the difficulties of estimating difference-in-differences models when the treatment is adopted at different times for different units. This article introduces the R package did2s which implements the estimator introduced in @Gardner_2021. The article provides an approachable review of the underlying econometric theory and introduces the syntax for the function `did2s`. Further, the package introduces functions, event_study and plot_event_study, which uses a common syntax to implement all of the modern event-study estimators.
Overview
CoChat Summary
TL;DR
This article introduces the R package `did2s`, which implements Gardner’s (2022) two-stage difference-in-differences estimator for two-way fixed-effects models with staggered treatment timing and heterogeneous treatment effects. It also provides `event_study` and `plot_event_study` functions for estimating and plotting modern event-study estimators under a common syntax.
Key findings
- The two-stage estimator first estimates group and time fixed effects using untreated/not-yet-treated observations, then regresses adjusted outcomes on treatment; this avoids the negative weighting problem in static and event-study TWFE when treatment effects are heterogeneous across groups and time.
- In the simulated `df_het` static example, `did2s` estimates the overall treatment effect as 2.23048 (SE = 0.021408, t = 104.19, p < 2.2e-16) with 46,500 observations; the text says this is close to the true value.
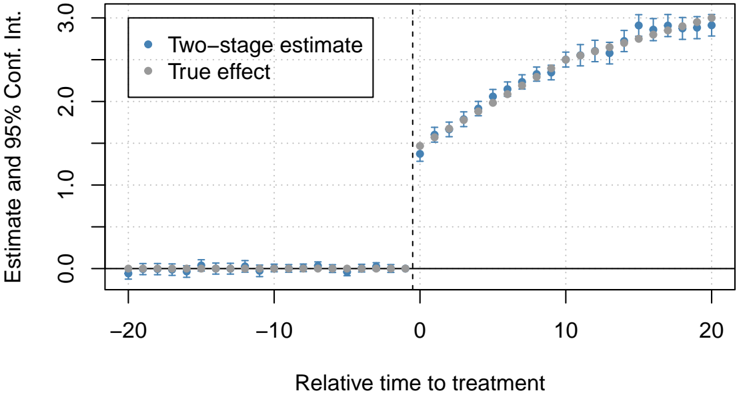
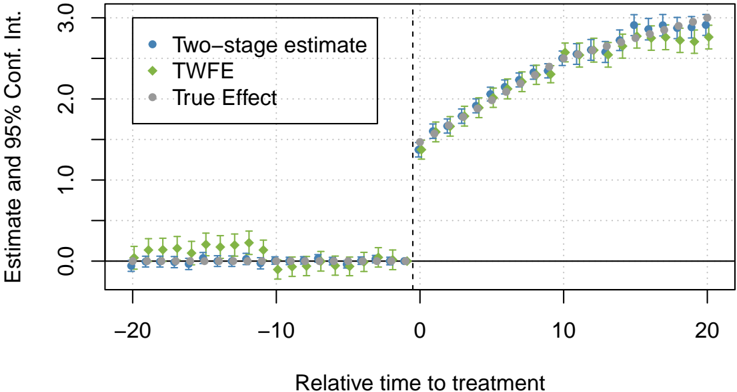
- Event-study estimates from `did2s` closely track the true effects: the true post-treatment effect starts at 1.5 and grows to 3 by post-period 20; OLS TWFE estimates show apparent pre-trend violations even though the data were simulated under parallel pre-trends.
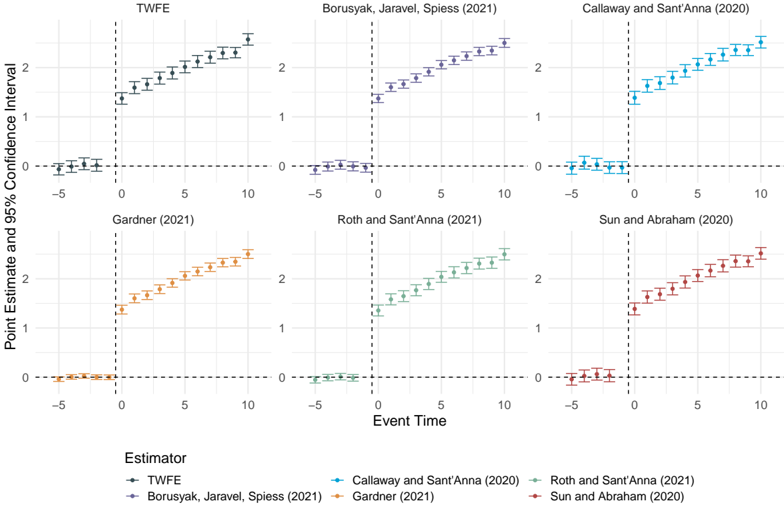
- `event_study` returns a tidy data frame of estimates and standard errors for multiple estimators, and `plot_event_study` produces ggplot comparisons; Table 2 summarizes assumptions including comparison group, parallel trends, limited anticipation, and correct specification of Y(0) for imputation estimators.
Methods
- Design: package/software article reviewing modern DiD theory and introducing `did2s`, which implements Gardner (2022); also `event_study` and `plot_event_study` for robust event-study estimators.
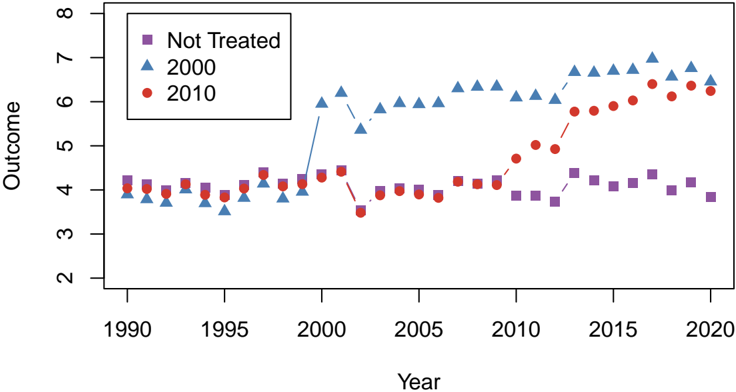
- Data: simulated dataset `df_het` with two treated groups and a never-treated group; the static example uses 46,500 observations, and event-study examples use the same simulated data.
- Analysis: first stage estimates group and time fixed effects on `Dgt = 0` observations; second stage regresses adjusted outcomes on treatment or event-study leads/lags; inference uses GMM asymptotic variance; `event_study` compares estimators via a common syntax.
Limitations
- The paper states further research is needed to determine which estimators work best in different settings, potentially via data-driven methods to assess assumption plausibility; more work is needed to formalize flexible covariate use, and no software yet exists for Caetano et al. (2022).
- Evident from the text: the empirical illustration is based on simulated data (`df_het`), not a real-world application, so performance evidence is simulation-based.
- Evident: the article notes the standard second-stage variance-covariance matrix would be incorrect without adjustment; it addresses this with GMM, but the text does not provide extensive finite-sample simulation evidence beyond the examples.
Model-written summary. Check it against the paper before relying on it.
Integrity signals
Registry
Cites
Statistics
Figures
Verification
Claims the paper makes
10 Valid · 4 Not valid · 9 Not checked · 50 Own results and interpretations
The cited sources support only part of this claim — read each source’s verdict below.
In the paper
“The natural question is, 'does the static TWFE model, (1), produce a consistent estimate for the overall average treatment effect?' Except for a few specific scenarios, the answer is no (Sun and Abraham 2020; Goodman-Bacon 2018; Borusyak, Jaravel, and Spiess 2021; Chaisemartin and D'Haultfoeuille 2019).”
What the sources say
- Not matchedcites Sun and Abraham 2020
An author–year citation the paper’s reference list doesn’t settle. We don’t search these by name.
- Supportedcites Goodman-Bacon 2018 matched to “Difference-in-Differences with Variation in Treatment Timing” (2018) source
In “Effects that vary across units but not over time” (page not provided), the paper says the TWFE estimand generally does not equal the sample average treatment effect because it weights groups by treatment variance rather than just sample shares. The same section explains that time-varying effects can bias comparisons between treatment-timing groups. These findings support the claim that static TWFE does not generally estimate the overall average treatment effect consistently. (LLM, conf=0.92)
- Not matchedcites Borusyak, Jaravel, and Spiess 2021
An author–year citation the paper’s reference list doesn’t settle. We don’t search these by name.
- Asserted: passes — The authors put it forward as true.
- Checkable: passes — It can be checked against evidence.
- Load-bearing: passes — The paper’s conclusions depend on it.
- Based: passes — The paper gives a reason why it holds.
- Not matched
The sources with a verdict support this claim; the rest weren’t checked yet, have no full text we could read, or their verdicts aren’t rated yet.
In the paper
“Results of Gardner (2022), Borusyak, Jaravel, and Spiess (2021), and Chaisemartin and D'Haultfoeuille (2019) all characterize the weights wgt from this regression.”
What the sources say
- Supportedcites Gardner (2022) matched to “Two-stage differences in differences” (2022) source
In “The regression DD estimand (3)” (page not provided), Gardner defines the weight on each group-by-period treatment effect as a coefficient from the regression with group and period fixed effects. Section 2.2 (page not provided) further explains how treatment duration, period-level treatment prevalence, and group size affect those weights. This supports the claim as it pertains to Gardner (2022). (LLM, conf=0.92)
- Not matchedcites Borusyak, Jaravel, and Spiess (2021)
An author–year citation the paper’s reference list doesn’t settle. We don’t search these by name.
- Not checked — no full text of the sourcecites Chaisemartin and D'Haultfoeuille (2019) matched to “Two-way Fixed Effects Estimators with Heterogeneous Treatment Effects” (2019) source
plain- Asserted: passes — The authors put it forward as true.
- Checkable: passes — It can be checked against evidence.
- Load-bearing: passes — The paper’s conclusions depend on it.
- Based: passes — The paper gives a reason why it holds.
- Supported
The cited sources support only part of this claim — read each source’s verdict below.
In the paper
“Arapidly growing econometric literature has identified difficulties in traditional difference-in-differences estimation when treatment turns on at different times for different groups and when the effects of treatment vary across groups and over time (Callaway and Sant'Anna 2020; Sun and Abraham 2020; Goodman-Bacon 2018; Borusyak, Jaravel, and Spiess 2021; Chaisemartin and D'Haultfoeuille 2019).”
What the sources say
- Not matchedcites Callaway and Sant'Anna 2020
An author–year citation the paper’s reference list doesn’t settle. We don’t search these by name.
- Not matchedcites Sun and Abraham 2020
An author–year citation the paper’s reference list doesn’t settle. We don’t search these by name.
- Supportedcites Goodman-Bacon 2018 matched to “Difference-in-Differences with Variation in Treatment Timing” (2018) source
The Abstract (page not specified) says that difference-in-differences applications commonly use groups treated at different times and that the resulting estimator averages heterogeneous treatment effects and is biased when effects change over time. The paper’s discussion of effects varying across units (page not specified) further explains how treatment-timing groups can act as controls for one another. These passages support the attributed methodological difficulty. (LLM, conf=0.92)
plainstates an association- Asserted: passes — The authors put it forward as true.
- Checkable: passes — It can be checked against evidence.
- Load-bearing: passes — The paper’s conclusions depend on it.
- Based: passes — The paper gives a reason why it holds.
- Not matched
A result the paper states — it cites no source for it, so there is none to check. The quote shows it is in the paper.
In the paper
“These two estimators return identical point estimates for post-treatment effects, but differ in their asymptotic regime and hence their standard errors.”
plainstates a cause- Asserted: passes — The authors put it forward as true.
- Checkable: passes — It can be checked against evidence.
- Load-bearing: unclear — It is unclear whether the paper’s conclusions depend on it.
- Based: passes — The paper gives a reason why it holds.
A result the paper states — it cites no source for it, so there is none to check. The quote shows it is in the paper.
In the paper
“These two estimators return identical point estimates for post-treatment effects, but differ in their asymptotic regime and hence their standard errors.”
plain- Asserted: passes — The authors put it forward as true.
- Checkable: passes — It can be checked against evidence.
- Load-bearing: unclear — It is unclear whether the paper’s conclusions depend on it.
- Based: passes — The paper gives a reason why it holds.
27 more claims
Create a free account to see all 73 claims and to verify the 2 references still open.
- Probably not a substantial claim. 32
- It may state two separate claims as one. 15
- The quote only partly states this claim. 1
Citations
Cites
ggplot2: Elegant Graphics for Data Analysis
Ginestet, C. (2011) · Journal of the Royal Statistical Society Series A: Statistics in Society · doi:10.1111/j.1467-985x.2010.00676_9.x · Cited by 13,726
Difference-in-Differences with multiple time periods
Callaway, B., & Sant’Anna, P. H. C. (2021) · Journal of Econometrics · doi:10.1016/j.jeconom.2020.12.001 · Cited by 9,126
Estimating dynamic treatment effects in event studies with heterogeneous treatment effects
Sun, L., & Abraham, S. (2021) · Journal of Econometrics · doi:10.1016/j.jeconom.2020.09.006 · Cited by 5,518
Chapter 36 Large sample estimation and hypothesis testing
Newey, W. K., & McFadden, D. (1994) · Handbook of Econometrics · doi:10.1016/s1573-4412(05)80005-4 · Cited by 1,743
Difference-in-Differences with Variation in Treatment Timing
Goodman-Bacon, A. (2018) · doi:10.3386/w25018 · Cited by 757
Partial Time Regressions as Compared with Individual Trends
Frisch, R., & Waugh, F. V. (1933) · Econometrica · doi:10.2307/1907330 · Cited by 629
Revisiting event study designs: robust and efficient estimation
(2022) · arXiv (preprint) · doi:10.47004/wp.cem.2022.1122 · Cited by 607
Two-way Fixed Effects Estimators with Heterogeneous Treatment Effects
de Chaisemartin, C., & D'Haultfoeuille, X. (2019) · doi:10.3386/w25904 · Cited by 350
Two-stage differences in differences
Gardner, J. (2022) · arXiv · doi:10.48550/arxiv.2207.05943 · Cited by 333
Self-citationbroom: Convert Statistical Objects into Tidy Tibbles
Robinson, D., Hayes, A., Couch, S., & Hvitfeldt, E. (2014) · CRAN: Contributed Packages · doi:10.32614/cran.package.broom · Cited by 244
Cited by
Difference-in-Differences for Policy Evaluation
Callaway, B. (2022) · Springer eBooks · doi:10.1007/978-3-319-57365-6_352-1 · Cited by 129
did2s: Two-Stage Difference-in-Differences Following Gardner (2021)
(2021) · doi:10.32614/cran.package.did2s · Cited by 32
Self-citationForeign bank entry and the outward foreign direct investment of companies: evidence from China
Liu, H., Yi, Z., Shang, H., & Liu, Z. (2024) · Journal of International Business Studies · doi:10.1057/s41267-024-00693-8 · Cited by 23
Unleashing Fintech’s potential: A catalyst for green bonds issuance
Huang, J., Liu, R., Wang, W., Wang, Z., Wang, C., & Jin, Y. J. (2024) · Journal of International Financial Markets Institutions and Money · doi:10.1016/j.intfin.2024.102009 · Cited by 31
“Recognizing the current discussion on heterogeneity in treatment effects within staggered DiD models, following Zhou et al. (2023) and Butts and Gardner (2021), we have incorporated a two-stage DiD model to verify the robustness of our findings and also assess the validity of the parallel trend…”
MethodLee, H., & Liu, Y. (2024) · Journal of Public Administration Research and Theory · doi:10.1093/jopart/muae006 · Cited by 26
Metadata
- Authors
- Butts, K., & Gardner, J.
- Affiliations
- University of Colorado Boulder (US)
- University of Mississippi (US)
- Venue
- The R Journal
- Publisher
- The R Foundation
- Published
- 2022-12-20
- Volume
- 14
- Issue
- 3
- Pages
- 162-173
- ISSN
- 2073-4859 (ISSN-L)
- OpenAlex
- W3199325769
- Semantic Scholar
- 7d78231e9e2f7f3d8a0a9e731900436f61ff0f36
- Cited by
- 133
- References
- 7
- Citations by year
- 2026: 44 · 2025: 37 · 2024: 24 · 2023: 18 · 2022: 7
- FWCI
- 13.62
- Type
- journal article
- Language
- en
- Open access
- diamond
- doi.org
- Licence
- cc-by
- Locations
- The R Journal (publishedVersion, cc-by)
- RePEc: Research Papers in Economics (submittedVersion)
- arXiv (Cornell University) (submittedVersion)
- arXiv (Cornell University) (cc-by)
- Topics
- Physical Sciences › Mathematics › Statistics and Probability › Advanced Causal Inference Techniques
- Physical Sciences › Mathematics › Statistics and Probability › Data Analysis with R
- Social Sciences › Economics, Econometrics and Finance › Economics and Econometrics › Spatial and Panel Data Analysis
- Keywords
- staggered treatment adoption, treatment effect estimation
About these checks
Registry, retraction, Cites and statistics results are computed, not judged, with one exception: a printed reference that no index lists is read once by a model before it counts as a citation error. Claims are extracted by a model and kept only when their quote appears verbatim in the text; each cited source is then checked, with a model’s help, for whether it says what the claim relies on. Those verdicts can be wrong — read the claim’s quote and the cited source before relying on one.
The claim verdicts this report counts are experimental: their accuracy is not yet measured.
A language model drew the claims from the paper on 2026-09-30, under version 3 of the claim definition (model deepseek-v4.1-flash, prompt extract-v3).
A second model labelled each claim on 2026-09-30 (model jev-1.13-20260917, definition revision gold-guideline-v0.2).
Cited sources are checked with a language model’s help (gpt-6-sol).
Statistics and arithmetic are recomputed, not judged.
Confidence bands are shown only for fields calibrated on our annotated test set. None is calibrated yet, so no band is shown.
What counts as a claim ›How we measure confidence ›How we check this ›
Are you an author, or do you see a problem with this page? Request a review
How to cite
Cite CoChat for the checks on this page, and the paper for its own findings.
- This page
- CoChat. (2026). Citation check: did2s: Two-Stage Difference-in-Differences. https://app.cochat.ai/papers/10.32614/rj-2022-048
- The paper
- Butts, K., & Gardner, J. (2022). did2s: Two-Stage Difference-in-Differences. The R Journal. https://doi.org/10.32614/rj-2022-048
Data sources
Bibliographic data: Semantic Scholar, OpenAlex, Crossref.
Contains information from the Semantic Scholar Academic Graph Datasets, made available under the ODC Attribution License (ODC-BY 1.0).
Semantic Scholar’s data is described in: Kinney, R., et al. (2023). The Semantic Scholar Open Data Platform. arXiv:2301.10140.
