

The DOI matches its Crossref record; 42 of the 42 references it cites were found in a registry or an index.
MiR-132-3p Modulates MEKK3-Dependent NF-κB and p38/JNK Signaling Pathways to Alleviate Spinal Cord Ischemia-Reperfusion Injury by Hindering M1 Polarization of Macrophages
Abstract
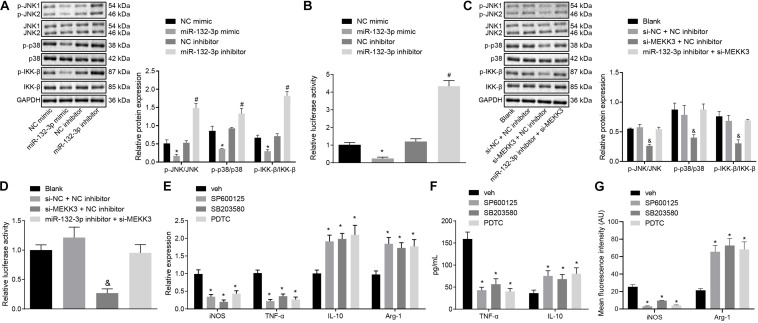
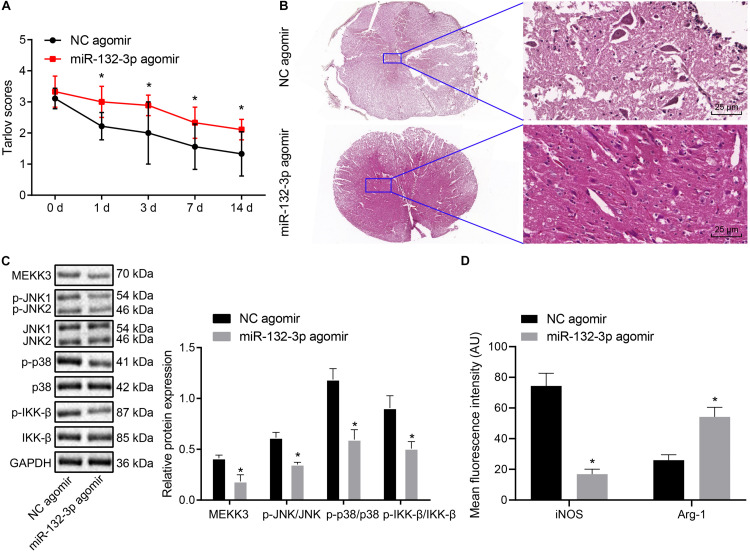
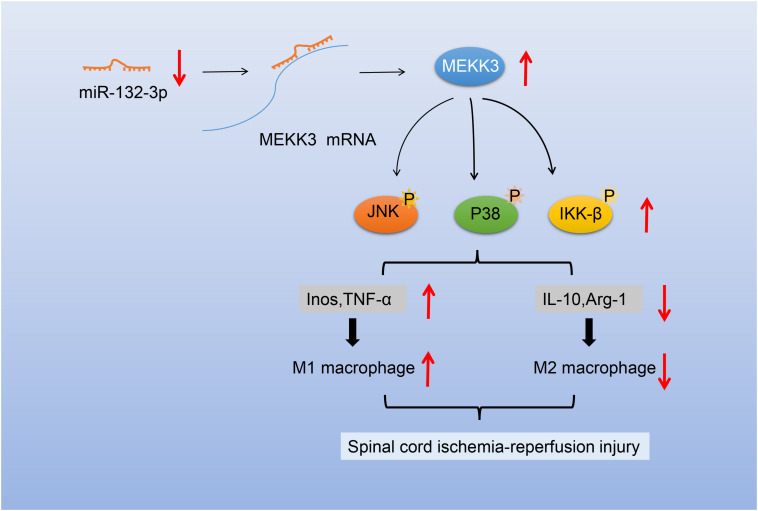
Spinal cord ischemia-reperfusion (SCIR) injury is a serious complication of open surgical and endovascular aortic procedures. MicroRNA-132-3p (miR-132-3p) has been reported to be involved in the progression of various diseases, but its role in SCIR injury is unclear. Thus, we aimed in this study to investigate the mechanism of miR-132-3p in SCIR injury and explore its pathway as a therapeutic target for SCIR injury. We first constructed a SCIR injury rat model and documented motor function in the model. Reverse transcription quantitative polymerase chain reaction (RT-qPC)R and Western blot analysis were used to detect the expression of miR-132-3p and mitogen-activated protein kinase kinase kinase 3 (MEKK3) in SCIR injury rats. The interaction between miR-132-3p and MEKK3 was identified by dual-luciferase reporter gene assay. Then, the effects of miR-132-3p and MEKK3 on macrophage M1 polarization were evaluated in vitro and in vivo by altering their expression in macrophages of SCIR injury rats, with treatments altering the nuclear factor-kappaB (NF-κB) and c-Jun N-terminal kinase (JNK)/p38 signaling pathways using SP600125, SB203580, or PDTC. The SCIR injury rats had a high Tarlov score and low miR-132-3p expression along with high MEKK3 expression. miR-132-3p could directly bind to MEKK3, and that macrophage M1 polarization and inflammation could be inhibited by overexpression of miR-132-3p through downregulating MEKK3 and inactivating the NF-κB and p38/JNK signaling pathways. Besides, increased miR-132-3p expression could decrease the injured rat Tarlov score. Overall, our study demonstrated that miR-132-3p can suppress M1 polarization of macrophages and alleviate SCIR injury by blocking the MEKK3-dependent activation of the NF-κB and p38/JNK signaling pathway. Thus, miR-132-3p and its downstream pathways may be useful targets to alleviate the symptoms of SCIR injury.
Overview
The claims and statistics of this paper haven’t been checked yet.
Run the check — free, no account needed. It reads the open-access text and checks the sources it cites.
Integrity signals
Registry
Cites
Statistics
Figures
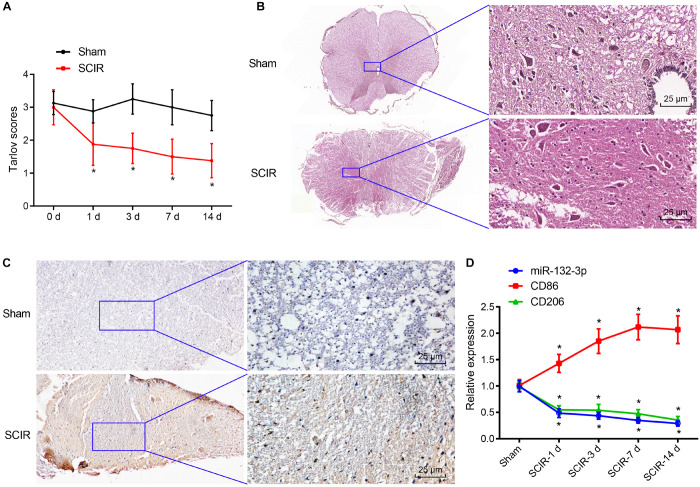
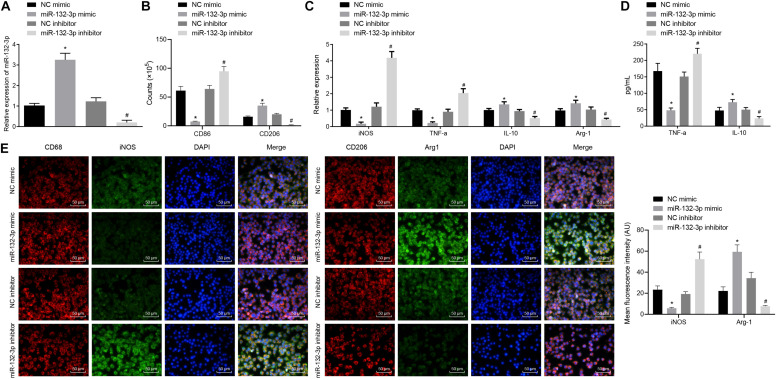
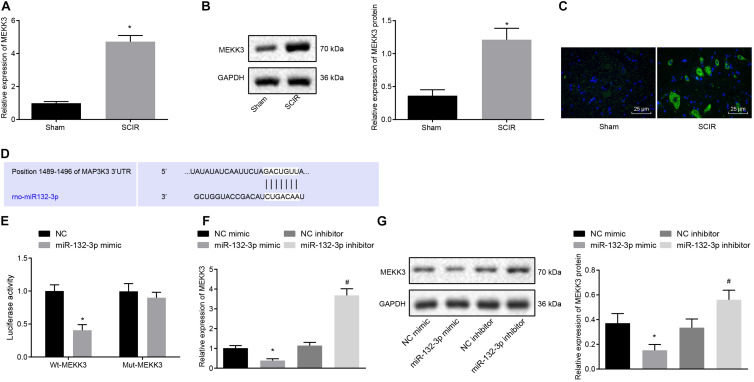
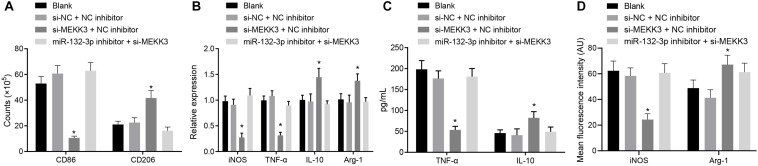
Verification
Claims the paper makes
The claims and statistics of this paper haven’t been checked yet.
Run the check — free, no account needed. It reads the open-access text and checks the sources it cites.
Claims other papers make about this one
Each is checked against this paper’s own text: does it say what the citing paper says it does?
The source backs part of the claim, not all of it — or backs it for a different population, condition or comparison.
In the citing paper
“Anti-inflammatory properties of miR-132 have been demonstrated in multiple independent in vitro and in vivo studies, including its direct targeting of acetylcholinesterase (which leads to increased levels of acetylcholine and, thereby, inhibits the release of pro-inflammatory cytokines), and its regulation over key inflammatory pathways, like TLR4 and NF-kB, which we also observed in our study [41”
From microRNA-132 attenuates inflammation in induced pluripotent stem cell-derived microglia from Alzheimer’s disease patients (2026) · cites this paper as [132]
Experimental — accuracy not yet measured
Self-check
Percentages, sums and reported differences re-computed from the paper’s own numbers.
The self-check needs the paper’s full text.
Citations
Cites
2 retracted
Xu, M. Q., Wang, H., Zhang, Y., & Zhuang, H.-W. (2016) · Biomedicine & Pharmacotherapy · doi:10.1016/j.biopha.2016.04.028 · Cited by 20
RetractedKong, Y., Wang, Y., Zhu, Z., Deng, Z., Chen, J., Zhang, D., Jiang, Q.-H., Zhao, S., & Zhang, Y. (2019) · Molecular Therapy — Nucleic Acids · doi:10.1016/j.omtn.2019.05.014 · Cited by 15
RetractedRepertoire of microglial and macrophage responses after spinal cord injury
David, S., & Kroner, A. (2011) · Nature Reviews Neuroscience · doi:10.1038/nrn3053 · Cited by 1,297
Zhou, D., Huang, C., Lin, Z., Zhan, S., Kong, L., Fang, C., & Li, J. (2014) · Cellular Signalling · doi:10.1016/j.cellsig.2013.11.004 · Cited by 778
Kroner, A., Greenhalgh, A. D., Zarruk, J. G., Passos dos Santos, R., Gaestel, M., & David, S. (2014) · Neuron · doi:10.1016/j.neuron.2014.07.027 · Cited by 655
Essandoh, K., Li, Y., Huo, J., & Fan, G.-C. (2016) · Shock · doi:10.1097/shk.0000000000000604 · Cited by 606
Differential regulation of interleukin 1 receptor and Toll-like receptor signaling by MEKK3
Huang, Q., Yang, J., Lin, Y., Walker, C., Cheng, J., Liu, Z.-G., & Su, B. (2004) · Nature Immunology · doi:10.1038/ni1014 · Cited by 266
microRNAs as Developmental RegulatorsPreprint
Ivey, K. N., & Srivastava, D. (2015) · Cold Spring Harbor Perspectives in Biology · doi:10.1101/cshperspect.a008144 · Cited by 256
Yao, L., Ye, Y., Mao, H., Lu, F., He, X., Lu, G., & Zhang, S. (2018) · Journal of Neuroinflammation · doi:10.1186/s12974-018-1053-4 · Cited by 165
PB1 Domain Interaction of p62/Sequestosome 1 and MEKK3 Regulates NF-κB Activation
Nakamura, K., Kimple, A. J., Siderovski, D. P., & Johnson, G. L. (2009) · Journal of Biological Chemistry · doi:10.1074/jbc.m109.065102 · Cited by 137
MicroRNA dysregulation in spinal cord injury: causes, consequences and therapeutics
Nieto‐Díaz, M., Esteban, F. J., Reigada, D., Muñoz‐Galdeano, T., Yunta, M., Caballero-López, M. J., Navarro-Ruíz, R., del Águila, Á., & Maza, R. M. (2014) · Frontiers in Cellular Neuroscience · doi:10.3389/fncel.2014.00053 · Cited by 137
Biophysical regulation of macrophages in health and disease
Meli, V. S., Veerasubramanian, P. K., Atcha, H., Reitz, Z., Downing, T. L., & Liu, W. F. (2019) · Journal of Leukocyte Biology · doi:10.1002/jlb.mr0318-126r · Cited by 133
MicroRNA Dysregulation in the Spinal Cord following Traumatic Injury
Yunta, M., Nieto-Díaz, M., Esteban, F. J., Caballero-López, M., Navarro-Ruíz, R., Reigada, D., Pita-Thomas, D. W., Águila, Á. D., Muñoz-Galdeano, T., & Maza, R. M. (2012) · PLoS ONE · doi:10.1371/journal.pone.0034534 · Cited by 122
Li, X., Huang-wei, L., Tan, W., Fang, B., Wang, H., & Ma, H. (2014) · Journal of Neuroinflammation · doi:10.1186/1742-2094-11-62 · Cited by 110
Responses of microRNAs 124a and 223 following spinal cord injury in mice
Nakanishi, K., Nakasa, T., Tanaka, N., Ishikawa, M., Yamada, K., Yamasaki, K., Kamei, N., Izumi, B., Adachi, N., Miyaki, S., et al. (2009) · Spinal Cord · doi:10.1038/sc.2009.89 · Cited by 106
Bell, M. T., Puskás, F., Ágoston, V. A., Cleveland, J. C., Freeman, K. A., Gamboni, F., Herson, P. S., Meng, X., Smith, P. D., Weyant, M. J., et al. (2013) · Circulation · doi:10.1161/circulationaha.112.000024 · Cited by 105
Xu, S., Zhu, W. P., Shao, M., Zhang, F., Guo, J., Xu, H., Jiang, J., Ma, X., Xia, X., Zhi, X., et al. (2018) · Journal of Neuroinflammation · doi:10.1186/s12974-018-1183-8 · Cited by 102
Increased miR-132-3p expression is associated with chronic neuropathic pain
Leinders, M., Üçeyler, N., Pritchard, R. A., Sommer, C., & Sorkin, L. S. (2016) · Experimental Neurology · doi:10.1016/j.expneurol.2016.06.025 · Cited by 98
Zhu, P., Li, J., Fujino, M., Zhuang, J., & Li, X. (2013) · Mediators of Inflammation · doi:10.1155/2013/701970 · Cited by 92
Zhong, J., Wang, H., Chen, W., Sun, Z., Chen, J., Xu, Y., Weng, M., Shi, Q., Ma, D., & Miao, C. (2017) · Cell Death and Disease · doi:10.1038/cddis.2017.102 · Cited by 89
Li, X.-Q., Chen, F.-S., Tan, W.-F., Fang, B., Zhang, Z.-L., & Ma, H. (2017) · Journal of Neuroinflammation · doi:10.1186/s12974-017-0977-4 · Cited by 88
Ning, N., Dang, X., Bai, C., Zhang, C., & Wang, K. (2011) · Journal of Ethnopharmacology · doi:10.1016/j.jep.2011.11.040 · Cited by 79
Culleré, X., Plovie, E. R., Bennett, P. M., MacRae, C. A., & Mayadas, T. N. (2015) · Proceedings of the National Academy of Sciences · doi:10.1073/pnas.1510495112 · Cited by 77
Li, X.-Q., Lv, H.-W., Wang, Z.-L., Tan, W.-F., Fang, B., & Ma, H. (2015) · Journal of Neuroinflammation · doi:10.1186/s12974-015-0246-3 · Cited by 77
Zhang, D., Qin, H., Leng, Y., Li, X., Zhang, L., Bai, D., Meng, Y., & Wang, J. (2018) · Experimental and Therapeutic Medicine · doi:10.3892/etm.2018.6451 · Cited by 68
Zhu, H., Xie, R., Liu, X., Shou, J., Gu, W., Gu, S., & Che, X. (2017) · Biomedicine & Pharmacotherapy · doi:10.1016/j.biopha.2017.05.143 · Cited by 67
Yin, F., Guo, L., Meng, C., Liu, Y.-J., Lu, R., Li, P., & Zhou, Y.-B. (2014) · Brain Research · doi:10.1016/j.brainres.2014.02.047 · Cited by 58
Mao, Y., Wang, B., Xu, X., Du, W., Li, W., & Wang, Y. (2015) · Mediators of Inflammation · doi:10.1155/2015/372931 · Cited by 56
Li, J., Liu, Y., Xu, H., & Fu, Q. (2016) · Inflammation · doi:10.1007/s10753-016-0405-4 · Cited by 51
Resveratrol alleviates lipopolysaccharide-induced inflammation in PC-12 cells and in rat model
Zhang, G., Liu, Y., Xu, L., Sha, C., Zhang, H., & Xu, W. (2019) · BMC Biotechnology · doi:10.1186/s12896-019-0502-1 · Cited by 49
Fang, B., Li, X., Sun, X.-J., Bao, N. T. Y., Ren, X., Huang-wei, L., & Ma, H. (2013) · International Journal of Molecular Sciences · doi:10.3390/ijms140510343 · Cited by 48
Fu, A., Wang, Y., Wu, Y., Chen, H., Zheng, S., Li, Y., Xu, X., & Li, W. (2017) · Journal of Cellular Biochemistry · doi:10.1002/jcb.25875 · Cited by 42
MicroRNA regulatory pattern in spinal cord ischemia-reperfusion injury
Liu, Z., Li, Y., Jiao, J., Long, H., Xin, Z.-Y., & Yang, X. (2020) · Neural Regeneration Research · doi:10.4103/1673-5374.280323 · Cited by 39
Kim, K., Duramad, O., Qin, X., & Su, B. (2007) · Immunology · doi:10.1111/j.1365-2567.2006.02495.x · Cited by 32
MicroRNAs as potential therapeutics for treating spinal cord injury.
Yan, H., Hong, P., Jiang, M. H., & Li, H. (2012) · PubMed Central · doi:10.3969/j.issn.1673-5374.2012.17.011 · Cited by 30
Self-citationChen, J., Wang, Q., Zhou, W., Zhou, Z., Tang, P., Xu, T., Liu, W., Li, L., Cheng, L., Zhou, Z., et al. (2018) · The FASEB Journal · doi:10.1096/fj.201800548 · Cited by 26
Self-citationSun, W., Wang, H., Zhao, X., Yu, Y., Fan, Y., Wang, H., Wang, X., Lu, X., Zhang, G., Fu, S., et al. (2010) · Journal of Biological Chemistry · doi:10.1074/jbc.m110.104224 · Cited by 20
Guo, S. (2011) · Oncology Reports · doi:10.3892/or.2011.1509 · Cited by 9
Dai, R. ‐., Xu, J. ‐., Tao, L., Li, L., Li, Z. ‐., & Zhang, J. ‐. (2007) · Acta Anaesthesiologica Scandinavica · doi:10.1111/j.1399-6576.2006.01218.x · Cited by 7
Self-citationMyocardial Uptake and Pharmacodynamics of Quinidine and Propafenone in Isolated Rabbit Hearts
Glllls, A. M., & Keashly, R. (1991) · Journal of Cardiovascular Pharmacology · doi:10.1097/00005344-199104000-00002 · Cited by 7
Wang, L., Yan, W.-J., & Wang, J. (2019) · Journal of Cellular Physiology · doi:10.1002/jcp.28162 · Cited by 6
Studies on protection against ischemia reperfusion injury after SCI
Wyndaele, J. (2016) · Spinal Cord · doi:10.1038/sc.2016.40 · Cited by 3
Cited by
Wang, Y., Zhao, J., Guo, Q., Yin, Y., Tian, W., Wang, X., Deng, G., Pan, Q., & Ma, X. (2025) · Experimental Neurology · doi:10.1016/j.expneurol.2025.115224 · Cited by 10
Self-citationPenning, A., Snoeck, S., Ormaechea, O. R., Ayyildiz, D., Polzer, O., Buitrago-Arango, M., Capobianco, R., de Winter, F., Balusu, S., Verhaagen, J., et al. (2026) · Acta Neuropathologica Communications · doi:10.1186/s40478-026-02228-8 · Cited by 6
Metadata
- Authors
- Fang, H., Li, H.-F., Pan, Q., Jin, H.-L., Yang, M., Wang, R.-R., Wang, Q.-Y., & Zhang, J.-P.
- Venue
- Frontiers in Cell and Developmental Biology
- Publisher
- Frontiers Media SA
- Published
- 2021-02-11
- Volume
- 9
- ISSN
- 2296-634X
- PMC
- PMC7905026
- Cited by
- 26
- References
- 42
About these checks
Registry, retraction, Cites and statistics results are computed, not judged, with one exception: a printed reference that no index lists is read once by a model before it counts as a citation error. Claims are extracted by a model and kept only when their quote appears verbatim in the text; each cited source is then checked, with a model’s help, for whether it says what the claim relies on. Those verdicts can be wrong — read the claim’s quote and the cited source before relying on one.
Statistics and arithmetic are recomputed, not judged.
Confidence bands are shown only for fields calibrated on our annotated test set. None is calibrated yet, so no band is shown.
What counts as a claim ›How we measure confidence ›How we check this ›
Are you an author, or do you see a problem with this page? Request a review
Data sources
Bibliographic data: Semantic Scholar, OpenAlex, Crossref.
Contains information from the Semantic Scholar Academic Graph Datasets, made available under the ODC Attribution License (ODC-BY 1.0).
Semantic Scholar’s data is described in: Kinney, R., et al. (2023). The Semantic Scholar Open Data Platform. arXiv:2301.10140.
