

Applications and implementation considerations for stepped-wedge designs in sub-Saharan Africa: a systematic review
Open accessThe DOI matches its Crossref record; 122 of the 122 references it cites were found in a registry or an index; 340 of the 364 sources its claims cite were checked for support.
Abstract
Systematic review of 85 stepped-wedge design (SWD) studies in sub-Saharan Africa from 2000 to 2024 evaluating public health, clinical, and social interventions, highlighting methodological rigor, logistical phasing advantages in resource-limited health facilities, and the necessity of accounting for underlying secular time trends and cluster correlation.
Overview
CoChat Summary
TL;DR
This systematic review synthesizes 85 stepped-wedge design studies conducted in sub-Saharan Africa from 2000–2024, covering 1,895,788 participants across HIV/AIDS, maternal and child health, tuberculosis, malaria, and other domains. It finds SWD is used mainly for ethical and logistical phased implementation, but reporting of design and implementation details is inconsistent.
Key findings
- 85 studies were included, involving 1,895,788 participants; sample sizes ranged from 17 to 780,000. Most studies were facility-based (72, 84.7%), while 13 (15.3%) were community-based.
- HIV/AIDS was the largest health domain (34 studies, 40%), followed by maternal and child health (17, 20%), tuberculosis (11, 12.9%), malaria (7, 8.2%), and general health (7, 8.2%).
- Studies were concentrated in Uganda (16, 18.8%), Kenya (14, 15.3%), and South Africa (11, 12.9%), with fewer from West and Central Africa.
- Design parameters varied widely: the abstract reports 2–12 steps and 4–54 clusters, while the narrative reports 1–27 steps and 3–142 clusters; study duration ranged from 2 to 60 months.
Methods
- Systematic review following PRISMA and MOOSE, registered with PROSPERO (CRD42024530774); searched PubMed, Web of Science, CINAHL, PsycINFO, Cochrane Library, Google Scholar, and citation tracking from January 2000 to March 2024.
- Included original research trials using SWD in SSA with clusters, randomization, and controls; excluded non-SWD, non-SSA, individual-randomized, retrospective SWD, editorials, commentaries, and non-peer-reviewed articles. Screening yielded 873 titles/abstracts, 93 full texts, and 85 included studies.
- Data were extracted on study characteristics, SWD implementation, statistical methods, and sample size calculations; no meta-analysis was performed.
Limitations
- Stated: geographic concentration in a few countries, variability in methodological reporting, limited representation of non-communicable diseases, inconsistent reporting of study durations and intervals, and absence of a meta-analysis limiting quantitative synthesis.
- Evident: the PRISMA flow numbers conflict with the text (2,562 vs 1,565 records; 93 vs 132 full texts), and cluster/step ranges differ between the abstract and narrative.
- Evident: the search was restricted to English-language publications for feasibility, despite the eligibility criteria mentioning English or French.
Model-written summary. Check it against the paper before relying on it.
Integrity signals
Registry
Cites
Statistics
Figures




Verification
Claims the paper makes
209 Valid · 35 Not valid · 41 Not checked · 166 Own results and interpretations
Some cited sources support this claim and some don’t — read each source’s verdict below.
In the paper
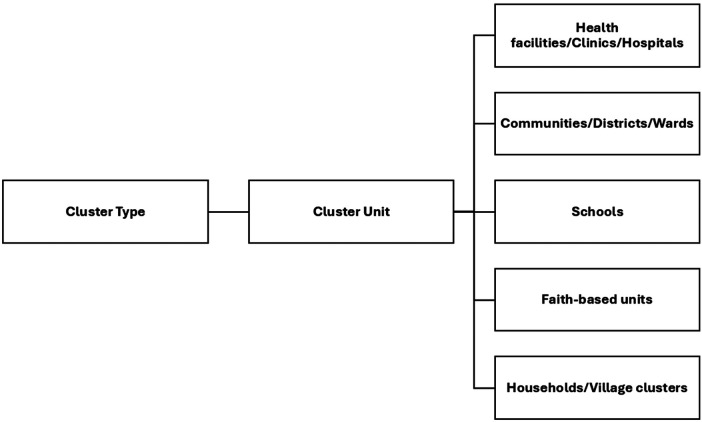
“Studies that integrated health facility-based interventions with community outreach often used mixed-setting clusters (33–36, 38, 48, 54, 61, 67, 72, 76, 78, 80, 92, 99, 103, 106–108).”
§ Applications and implementation considerations for stepped-wedge designs in sub-Saharan Africa: a systematic review > Results > Cluster definitions
What the sources say
- Partly supportedcites [33] Cockcroft, 2022, Universal home visits improve male knowledge and attitudes about maternal and child health in bauchi state, Nigeria: secondary outcome analysis of a stepped wedge cluster randomised controlled trial, J Glob Health sourceExperimental — accuracy not yet measured
The Methods (Design of the trial; Intervention; Statistical methods, page unavailable) describe ward-level clusters, community home visits, and urban or rural residence as a participant characteristic. They do not describe a health facility-based intervention integrated with the visits or identify the wards as mixed-setting clusters. This paper therefore supports the community-outreach and clustering elements, but not the full characterization attributed to it. (LLM, conf=0.84)
- Supportedcites [34] Cissé, 2016, Effectiveness of seasonal malaria chemoprevention in children under ten years of age in Senegal: a stepped-wedge cluster-randomised trial, PLoS Med source
The Methods > Randomisation section identifies health posts and their community catchment areas as the trial clusters. Methods > Delivery says health posts organised SMC delivery through community health workers visiting households. This supports the paper as an example of a study combining a health-post structure with community outreach; the word “often” describes the cited studies collectively, not this paper alone. (LLM, conf=0.87)
- Disputedcites [35] Davey, 2015, Re-analysis of health and educational impacts of a school-based deworming programme in western Kenya: a statistical replication of a cluster quasi-randomized stepped-wedge trial, Int J Epidemiol sourceExperimental — accuracy not yet measured
The Methods sections ‘Trial design’ and ‘The intervention’ describe a school-based deworming programme allocated by primary school, with treatment and health education delivered in schools. The paper does not describe health-facility delivery or mixed-setting clusters; it describes school-level clusters instead. Page numbers are unavailable in our copy. (LLM, conf=0.86)
Checked by a reasoning model — may be wrong.
- Disputedcites [36] Boeke, 2021, Universal test and treat in relation to HIV disease progression: results from a stepped-wedge trial in eswatini, HIV Med sourceExperimental — accuracy not yet measured
The Details of the MaxART section (page unavailable) describes a trial across 14 public-sector health clinics, with sites transitioning between study conditions. It says the analysis accounted for clustering by health facility, not mixed-setting clusters, and does not describe community outreach as part of the intervention. (LLM, conf=0.83)
Checked by a reasoning model — may be wrong.
- Partly supportedcites [38] Larsen, 2015, Population-Wide malaria testing and treatment with rapid diagnostic tests and artemether-lumefantrine in southern Zambia: a community randomized step-wedge control trial design, Am J Trop Med Hyg sourceExperimental — accuracy not yet measured
The Methods (Study design; page unavailable) describe clusters made up of health-facility catchment areas, and the Methods (Intervention; page unavailable) describe door-to-door community testing and treatment. The paper does not describe a health facility-based intervention integrated with that outreach: facilities supplied an outcome measure and received some referrals. This study therefore supports the mixed-setting cluster description, but not the full characterization of the intervention. (LLM, conf=0.84)
- Disputedcites [48] Puffer, 2016, A church-based intervention for families to promote mental health and prevent HIV among adolescents in rural Kenya: results of a randomized trial, J Consult Clin Psychol sourceExperimental — accuracy not yet measured
The Methods (Study Design and Procedures; Empirical Strategy, page unavailable) identify the randomized clusters as four churches, not mixed-setting clusters. The Discussion describes intervention delivery through churches; it does not describe integrating a health-facility intervention with community outreach. (LLM, conf=0.86)
Checked by a reasoning model — may be wrong.
plainstates an association- Asserted: passes — The authors put it forward as true.
- Checkable: passes — It can be checked against evidence.
- Load-bearing: unclear — It is unclear whether the paper’s conclusions depend on it.
- Based: passes — The paper gives a reason why it holds.
- Partly supported
Some cited sources support this claim and some don’t — read each source’s verdict below.
In the paper
“In more localized studies, clusters were often defined at the village or community level to capture the effects of interventions on specific populations (28, 29, 39, 48, 54, 72, 78, 81, 103, 106, 108).”
§ Applications and implementation considerations for stepped-wedge designs in sub-Saharan Africa: a systematic review > Results > Cluster definitions
What the sources say
- Supportedcites [28] Tiono, 2018, Efficacy of olyset duo, a bednet containing pyriproxyfen and permethrin, versus a permethrin-only net against clinical malaria in an area with highly pyrethroid-resistant vectors in rural Burkina Faso: a cluster-randomised controlled trial, Lancet source
The Study design and participants section says consenting villages were grouped into 40 clusters of one to four neighbouring villages, with children selected from those villages for study. The Randomisation and masking section confirms that bednet interventions were assigned by village cluster. This paper therefore supports its use as an example of a localized, village-level cluster study; it does not by itself establish how often other studies used that approach. (LLM, conf=0.90)
- Not checked — no full text of the sourcecites [29] Giusto, 2017, Associations between Fathers’ and Sons’ sexual risk in rural Kenya: the potential for intergenerational transmission, J adolesc health source
- Disputedcites [39] Meya, 2019, Reflexive laboratory-based cryptococcal antigen screening and preemptive fluconazole therapy for cryptococcal antigenemia in HIV-infected individuals with CD4,100 cells/mL: a stepped-wedge, cluster-randomized trial, J Acquir Immune Defic Syndr sourceExperimental — accuracy not yet measured
The Methods, Study Design and Randomization (page not provided) defines the randomized clusters as clinics, not villages or communities. The paper evaluates the intervention across clinic sites, so it is contrary to the claimed cluster definition for this study. (LLM, conf=0.88)
Checked by a reasoning model — may be wrong.
plain- Asserted: passes — The authors put it forward as true.
- Checkable: passes — It can be checked against evidence.
- Load-bearing: unclear — It is unclear whether the paper’s conclusions depend on it.
- Based: passes — The paper gives a reason why it holds.
- Supported
At least one cited source doesn’t support this claim or points to a different paper, and none confirmed it — see the verdicts below.
In the paper
“Some studies aimed to assess the impact of interventions on patients' quality of life and satisfaction with healthcare services (57, 58).”
§ Applications and implementation considerations for stepped-wedge designs in sub-Saharan Africa: a systematic review > Results > Primary outcome
What the sources say
- Could not verifycites [57] Graham, 2019, Oxygen systems to improve clinical care and outcomes for children and neonates: a stepped-wedge cluster-randomised trial in Nigeria, PLoS Med sourceExperimental — accuracy not yet measured
The Methods > Outcomes section lists death and oxygen-related care practices as the outcomes assessed. It does not mention patients’ quality of life or satisfaction with healthcare services; searches for those terms found no supporting passage in our copy. No page number was available for the indexed passage. (LLM, conf=0.76)
- Disputedcites [58] Graham, 2021, Oxygen systems and quality of care for children with pneumonia, malaria and diarrhoea: analysis of a stepped-wedge trial in Nigeria, PLoS One sourceExperimental — accuracy not yet measured
The Methods > Outcomes section (page unavailable) says this study focused on care-process outcomes, with a primary measure of quality-of-care scores drawn from case notes. Those scores assess clinical assessment, diagnosis, treatment and monitoring—not patients’ quality of life or satisfaction with healthcare services. (LLM, conf=0.85)
Checked by a reasoning model — may be wrong.
plain- Asserted: passes — The authors put it forward as true.
- Checkable: passes — It can be checked against evidence.
- Load-bearing: unclear — It is unclear whether the paper’s conclusions depend on it.
- Based: passes — The paper gives a reason why it holds.
- Could not verify
At least one cited source doesn’t support this claim or points to a different paper, and none confirmed it — see the verdicts below.
In the paper
“LLINs treated with permethrin and pyriproxyfen were incrementally replaced over two years in a SWCRT with 40 clusters”
§ Applications and implementation considerations for stepped-wedge designs in sub-Saharan Africa: a systematic review > Results > Disease domains
What the sources say
- Disputedcites [76] Multerer, 2021, Estimating intervention effectiveness in trials of malaria interventions with contamination, Malar J sourceExperimental — accuracy not yet measured
The Methods section (“The AvecNet trial of long-lasting insecticidal nets”) confirms the two-year period, SWCRT design, and 40 clusters, but reverses the claimed direction of replacement: permethrin-only LLINs were replaced by LLINs treated with both permethrin and pyriproxyfen. (LLM, conf=0.92)
Checked by a reasoning model — may be wrong.
plain- Asserted: passes — The authors put it forward as true.
- Checkable: passes — It can be checked against evidence.
- Load-bearing: unclear — It is unclear whether the paper’s conclusions depend on it.
- Based: passes — The paper gives a reason why it holds.
- Disputed
Some cited sources support this claim and some don’t — read each source’s verdict below.
In the paper
“Health facilities, strategically chosen as clusters in numerous studies, underscore the emphasis on healthcare delivery and interventions within controlled environments.”
§ Applications and implementation considerations for stepped-wedge designs in sub-Saharan Africa: a systematic review > Results > Cluster definitions
What the sources say
- Partly supportedcites [26] Cattamanchi, 2021, Digital adherence technology for tuberculosis treatment supervision: a stepped-wedge cluster-randomized trial in Uganda, PLoS Med sourceExperimental — accuracy not yet measured
The Methods (Study design and participants) describe one stepped-wedge trial in Uganda that used 18 health facilities as clusters and selected facilities using specified eligibility criteria. This supports the example, but the paper does not establish that health facilities were chosen as clusters in numerous studies across sub-Saharan Africa. (LLM, conf=0.88)
- Disputedcites [27] Ridout, 2023, CRADLE-5: a stepped-wedge type 2 hybrid implementation-effectiveness cluster randomised controlled trial to evaluate the real-world scale-up of the CRADLE vital signs alert intervention into routine maternity care in Sierra Leone—study protocol, Trials sourceExperimental — accuracy not yet measured
The Study setting section identifies eight Sierra Leone districts as the trial clusters, and Sequence generation {16a} explicitly says the unit of randomisation is a district. Healthcare facilities are included within those districts, not chosen as clusters. This single protocol also does not establish what occurred in numerous studies. (LLM, conf=0.87)
Checked by a reasoning model — may be wrong.
- Partly supportedcites [30] Betrán, 2018, Provision of medical supply kits to improve quality of antenatal care in Mozambique: a stepped-wedge cluster randomised trial, Lancet Glob Health sourceExperimental — accuracy not yet measured
The Methods (Study design and Statistical analysis; pages not provided) describe one stepped-wedge trial in Mozambique that used ten antenatal care clinics as clusters. The paper supports this as an example of health facilities serving as clusters, but it does not establish that they were strategically chosen or that this occurred in numerous studies. (LLM, conf=0.85)
- Partly supportedcites [31] Auld, 2020, Effect of tuberculosis screening and retention interventions on early antiretroviral therapy mortality in Botswana: a stepped-wedge cluster randomized trial, BMC Med sourceExperimental — accuracy not yet measured
The Methods > Participants passage says this Botswana stepped-wedge trial purposively selected 22 HIV clinics at hospitals and primary healthcare facilities as clusters. It supports strategic selection of health-facility clusters in this study, but does not establish that numerous studies used that approach. (LLM, conf=0.87)
- Disputedcites [32] van Tetering, 2021, Evaluating the instructional design and effect on knowledge, teamwork, and skills of technology-enhanced simulation-based training in obstetrics in Uganda: stepped-wedge cluster randomized trial, JMIR Med Educ sourceExperimental — accuracy not yet measured
The Methods > Recruitment section says this stepped-wedge trial took place in one hospital and used seven randomly created clusters of senior house officers, not health facilities, as its clusters. The paper also does not establish a pattern across numerous stepped-wedge studies in sub-Saharan Africa. (LLM, conf=0.86)
Checked by a reasoning model — may be wrong.
- Disputedcites [33] Cockcroft, 2022, Universal home visits improve male knowledge and attitudes about maternal and child health in bauchi state, Nigeria: secondary outcome analysis of a stepped wedge cluster randomised controlled trial, J Glob Health sourceExperimental — accuracy not yet measured
The Methods (Design of the trial; Randomization and masking) say the clusters were eight wards in Toro LGA, allocated to four waves—not health facilities. The paper describes one trial and does not support the claim about numerous studies. (LLM, conf=0.90)
Checked by a reasoning model — may be wrong.
- Partly supportedcites [34] Cissé, 2016, Effectiveness of seasonal malaria chemoprevention in children under ten years of age in Senegal: a stepped-wedge cluster-randomised trial, PLoS Med sourceExperimental — accuracy not yet measured
The Methods (Randomisation) say that health posts were chosen as the natural clusters for this stepped-wedge trial because each oversaw community programmes in its catchment area. This supports the cited paper as an example, but one trial cannot establish that health facilities were chosen as clusters in numerous studies. (LLM, conf=0.86)
plain- Asserted: passes — The authors put it forward as true.
- Checkable: passes — It can be checked against evidence.
- Load-bearing: unclear — It is unclear whether the paper’s conclusions depend on it.
- Based: passes — The paper gives a reason why it holds.
- Partly supported
167 more claims · 54 with their cited sources checked
Create a free account to see all 451 claims and to verify the 8 references still open.
- Probably not a substantial claim. 225
- It may state two separate claims as one. 122
- The quote only partly states this claim. 4
Self-check
Percentages, sums and reported differences re-computed from the paper’s own numbers.
Each contradiction between two passages listed here was confirmed by an independent check.
Rated major: it would touch a result — a value a result rests on, reported and recomputed p-values on opposite sides of the significance level, two passages that conflict with no sign which is right, or a cited work retracted before this paper was published.
In the paper
§ Applications and implementation considerations for stepped-wedge designs in sub-Saharan Africa: a systematic review > Results > Selection of studies
“Furthermore, 93 articles were retrieved for full-text screening.”
§ Applications and implementation considerations for stepped-wedge designs in sub-Saharan Africa: a systematic review > Results > Selection of studies
“132 full texts were assessed for eligibility”
Rated minor: it would not touch a result — a value no result rests on, a p-value that stays on the same side of the significance level, or a conflict that is clerical, resolved elsewhere in the paper, or outside its own findings.
In the paper
“14 (15.3%) in Kenya”
§ Applications and implementation considerations for stepped-wedge designs in sub-Saharan Africa: a systematic review > Results > Characteristics of included studies
Reported 15.3 · recomputed 16.470588
Rated minor: it would not touch a result — a value no result rests on, a p-value that stays on the same side of the significance level, or a conflict that is clerical, resolved elsewhere in the paper, or outside its own findings.
In the paper
“Seven (29.2%) studies each were conducted over twenty-four months (32, 42, 45, 57, 76, 97, 104) and forty-eight months (31, 67, 71, 80–82, 108) durations.”
§ Applications and implementation considerations for stepped-wedge designs in sub-Saharan Africa: a systematic review > Results > Study duration
Reported 29.2 · recomputed 8.235294
Rated minor: it would not touch a result — a value no result rests on, a p-value that stays on the same side of the significance level, or a conflict that is clerical, resolved elsewhere in the paper, or outside its own findings.
In the paper
§ Applications and implementation considerations for stepped-wedge designs in sub-Saharan Africa: a systematic review > Abstract > Results
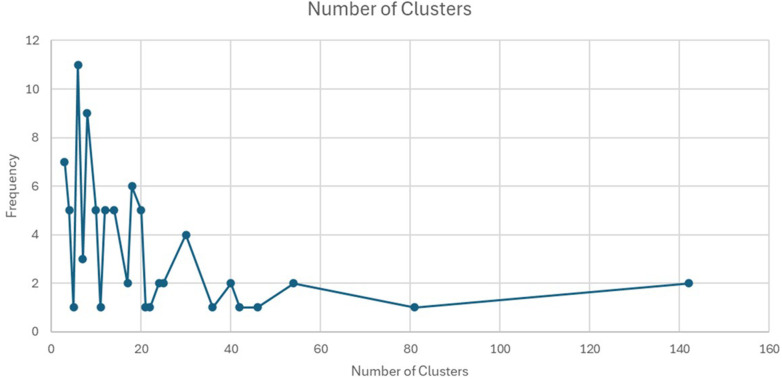
“The number of clusters per study varied, with some studies using as few as four clusters, while others utilized up to 54 clusters.”
§ Applications and implementation considerations for stepped-wedge designs in sub-Saharan Africa: a systematic review > Results > Number of clusters
“The study with the fewest clusters used only 3 clusters, as seen in Johanna Åhsberg (2023) and Jeffrey Rewley (2020) (67, 68). These studies likely involved small-scale interventions or were conducted in highly controlled environments where limited clusters were sufficient for achieving the study objectives. The study with the most clusters included 142 clusters”
Rated minor: it would not touch a result — a value no result rests on, a p-value that stays on the same side of the significance level, or a conflict that is clerical, resolved elsewhere in the paper, or outside its own findings.
In the paper
§ Applications and implementation considerations for stepped-wedge designs in sub-Saharan Africa: a systematic review > Results > Number of clusters
“The study with the most clusters included 142 clusters, as seen in Pren Naidoo (2017) and Nynke van den Broek (2019) (86, 90).”
§ Applications and implementation considerations for stepped-wedge designs in sub-Saharan Africa: a systematic review > Results > Number of clusters
“Nynke van den Broek (2019) involved 127 clusters across 11 districts in South Africa”
5 more findings
Create a free account to see every finding of this check.
Citations
Cites
The PRISMA 2020 statement: An updated guideline for reporting systematic reviews
Page, M. J., McKenzie, J. E., Bossuyt, P. M., Boutron, I., Hoffmann, T. C., Mulrow, C. D., Shamseer, L., Tetzlaff, J. M., Akl, E. A., Brennan, S. E., et al. (2021) · BMJ · doi:10.1136/bmj.n71 · Cited by 108,283
Meta-analysis of Observational Studies in Epidemiology<SUBTITLE>A Proposal for Reporting</SUBTITLE>
Stroup, D. F. (2000) · JAMA · doi:10.1001/jama.283.15.2008 · Cited by 20,623
The stepped wedge cluster randomised trial: rationale, design, analysis, and reporting
Hemming, K., Haines, T. P., Chilton, P. J., Girling, A. J., & Lilford, R. J. (2015) · BMJ · doi:10.1136/bmj.h391 · Cited by 1,410
Digital transformation in healthcare: technology acceptance and its applications
Stoumpos, A. I., Kitsios, F., & Talias, M. A. (2023) · International Journal of Environmental Research and Public Health · doi:10.3390/ijerph20043407 · Cited by 939
The stepped wedge trial design: a systematic review
Brown, C. A., & Lilford, R. J. (2006) · BMC Medical Research Methodology · doi:10.1186/1471-2288-6-54 · Cited by 907
Hemming, K., Taljaard, M., McKenzie, J. E., Hooper, R., Copas, A., Thompson, J. A., Dixon-Woods, M., Aldcroft, A., Doussau, A., Grayling, M., et al. (2018) · BMJ · doi:10.1136/bmj.k1614 · Cited by 475
Mdege, N. D., Man, M.-S., Taylor (nee Brown), C. A., & Torgerson, D. J. (2011) · Journal of Clinical Epidemiology · doi:10.1016/j.jclinepi.2010.12.003 · Cited by 425
PrEP stigma: implicit and explicit drivers of disparity
Golub, S. A. (2018) · Current HIV/AIDS Reports · doi:10.1007/s11904-018-0385-0 · Cited by 383
Role and outcomes of community health workers in HIV care in sub-saharan Africa: a systematic review
Mwai, G. W., Mburu, G., Torpey, K., Frost, P., Ford, N., & Seeley, J. (2013) · Journal of the International AIDS Society · doi:10.7448/ias.16.1.18586 · Cited by 372
Puffer, S., Torgerson, D., & Watson, J. (2003) · BMJ · doi:10.1136/bmj.327.7418.785 · Cited by 351
Metadata
- Authors
- Musa, Z. A., Akinsolu, F. T., Salako, A. O., Abodunrin, O. R., Ola, O. M., & Ezechi, O. C.
- Affiliations
- Nigerian Institute of Medical Research (NG)
- Lead City University (NG)
- Corresponding author
- Akinsolu, Folahanmi Tomiwa
- ORCID
- Venue
- Frontiers in Epidemiology
- Publisher
- Frontiers Media SA
- Published
- 2026-03-25
- Volume
- 6
- Pages
- 1529289-1529289
- ISSN
- 2674-1199 (ISSN-L)
- PMC
- PMC13057542
- OpenAlex
- W7140307959
- Semantic Scholar
- f2785e84dcc95945cb2eb7bc885502ba26e1d4d5
- Cited by
- 0
- References
- 120
- FWCI
- 0.00
- Type
- journal article
- Language
- en
- Open access
- gold
- doi.org
- Licence
- Locations
- Frontiers in Epidemiology (publishedVersion, cc-by)
- PubMed Central (publishedVersion, cc-by)
- PubMed (publishedVersion)
- DOAJ (DOAJ: Directory of Open Access Journals) (submittedVersion, cc-by-sa)
- Topics
- Health Sciences › Health Professions › General Health Professions › Health Policy Implementation Science
- Physical Sciences › Mathematics › Statistics and Probability › Statistical Methods in Clinical Trials
- Physical Sciences › Mathematics › Statistics and Probability › Advanced Causal Inference Techniques
- Keywords
- stepped wedge design, sub-Saharan Africa, implementation science, public health interventions, sample size determination, intra-cluster correlation, cluster randomization, HIV/AIDS, maternal and child health, tuberculosis, malaria, research ethics, primary outcomes, intervention effectiveness evaluation, research capacity building, health professions education, health system strengthening, health care financing, health policy evaluation
About these checks
Registry, retraction, Cites and statistics results are computed, not judged, with one exception: a printed reference that no index lists is read once by a model before it counts as a citation error. Claims are extracted by a model and kept only when their quote appears verbatim in the text; each cited source is then checked, with a model’s help, for whether it says what the claim relies on. Those verdicts can be wrong — read the claim’s quote and the cited source before relying on one.
The claim verdicts this report counts are experimental: their accuracy is not yet measured.
A language model drew the claims from the paper on 2026-10-10, under version 3 of the claim definition (model deepseek-v4.1-flash, prompt extract-v3).
A second model labelled each claim on 2026-10-10 (model jev-1.13-20260917, definition revision gold-guideline-v0.2).
Cited sources are checked with a language model’s help (gpt-6-sol).
Statistics and arithmetic are recomputed, not judged.
Confidence bands are shown only for fields calibrated on our annotated test set. None is calibrated yet, so no band is shown.
What counts as a claim ›How we measure confidence ›How we check this ›
Are you an author, or do you see a problem with this page? Request a review
How to cite
Cite CoChat for the checks on this page, and the paper for its own findings.
- This page
- CoChat. (2026). Citation check: Applications and implementation considerations for stepped-wedge designs in sub-Saharan Africa: a systematic review. https://app.cochat.ai/papers/10.3389/fepid.2026.1529289
- The paper
- Musa, Z. A., Akinsolu, F. T., Salako, A. O., Abodunrin, O. R., Ola, O. M., & Ezechi, O. C. (2026). Applications and implementation considerations for stepped-wedge designs in sub-Saharan Africa: a systematic review. Frontiers in Epidemiology. https://doi.org/10.3389/fepid.2026.1529289
Data sources
Bibliographic data: Semantic Scholar, OpenAlex, Crossref.
Contains information from the Semantic Scholar Academic Graph Datasets, made available under the ODC Attribution License (ODC-BY 1.0).
Semantic Scholar’s data is described in: Kinney, R., et al. (2023). The Semantic Scholar Open Data Platform. arXiv:2301.10140.
