

The DOI matches its Crossref record; 58 of the 58 references it cites were found in a registry or an index; none of the 26 sources its claims cite is checked for support yet.
Mitochondrial DNA Footprints from Western Eurasia in Modern Mongolia
Open accessAbstract
Mongolia is located in a strategic position at the eastern edge of the Eurasian Steppe. Nomadic populations moved across this wide area for millennia before developing more sedentary communities, extended empires, and complex trading networks, which connected western Eurasia and eastern Asia until the late Medieval period. We provided a fine-grained portrait of the mitochondrial DNA (mtDNA) variation observed in present-day Mongolians and capable of revealing gene flows and other demographic processes that took place in Inner Asia, as well as in western Eurasia. The analyses of a novel dataset (N = 2,420) of mtDNAs highlighted a clear matrilineal differentiation within the country due to a mixture of haplotypes with eastern Asian (EAs) and western Eurasian (WEu) origins, which were differentially lost and preserved. In a wider genetic context, the prevalent EAs contribution, larger in eastern and central Mongolian regions, revealed continuous connections with neighboring Asian populations until recent times, as attested by the geographically restricted haplotype-sharing likely facilitated by the Genghis Khan’s so-called Pax Mongolica. The genetic history beyond the WEu haplogroups, notably detectable on both sides of Mongolia, was more difficult to explain. For this reason, we moved to the analysis of entire mitogenomes (N = 147). Although it was not completely possible to identify specific lineages that evolved in situ, two major changes in the effective (female) population size were reconstructed. The more recent one, which began during the late Pleistocene glacial period and became steeper in the early Holocene, was probably the outcome of demographic events connected to western Eurasia. The Neolithic growth could be easily explained by the diffusion of dairy pastoralism, as already proposed, while the late glacial increase indicates, for the first time, a genetic connection with western Eurasian refuges, as supported by the unusual high frequency and internal sub-structure in Mongolia of haplogroup H1, a well-known post-glacial marker in Europe. Bronze Age events, without a significant demographic impact, might explain the age of some mtDNA haplogroups. Finally, a diachronic comparison with available ancient mtDNAs made it possible to link six mitochondrial lineages of present-day Mongolians to the timeframe and geographic path of the Silk Route.
Overview
CoChat Summary
Written by AI from the paper’s full text.
TL;DR
This study analyzes mtDNA control-region sequences from 2,420 present-day Mongolians and 147 complete mitogenomes to characterize eastern and western Eurasian maternal ancestry and demographic history. It finds strong regional differentiation, with eastern Asian lineages predominating overall and western Eurasian lineages concentrated in western Mongolia, and links some western Eurasian lineages to post-glacial expansions and later Silk Route-era movements.
Key findings
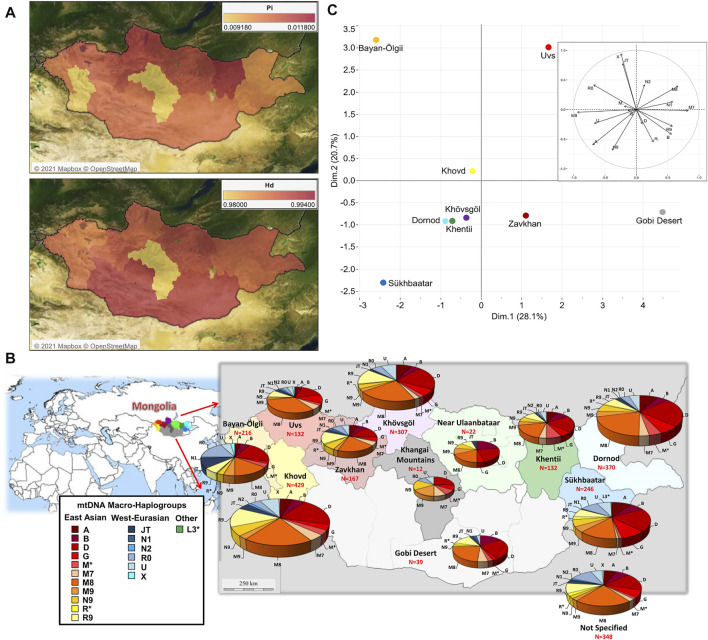
- Of 2,420 Mongolian mtDNAs, 1,987 (82.1%) belong to eastern Asian haplogroups, with C at 19.6% and D4 at 19.8%; western Eurasian haplogroups reach 21.7% in western Mongolia and decrease eastwards, with H the most represented western Eurasian haplogroup at 6.5%.
- The 2,420 mtDNAs were classified into 413 lineages grouped into 18 macro-haplogroups; PCA separates the westernmost regions Bayan-Ölgii, Khovd, and Uvs due to JT, N2, R0, and X, while northern regions cluster together and southern regions are separated by eastern Asian lineages.
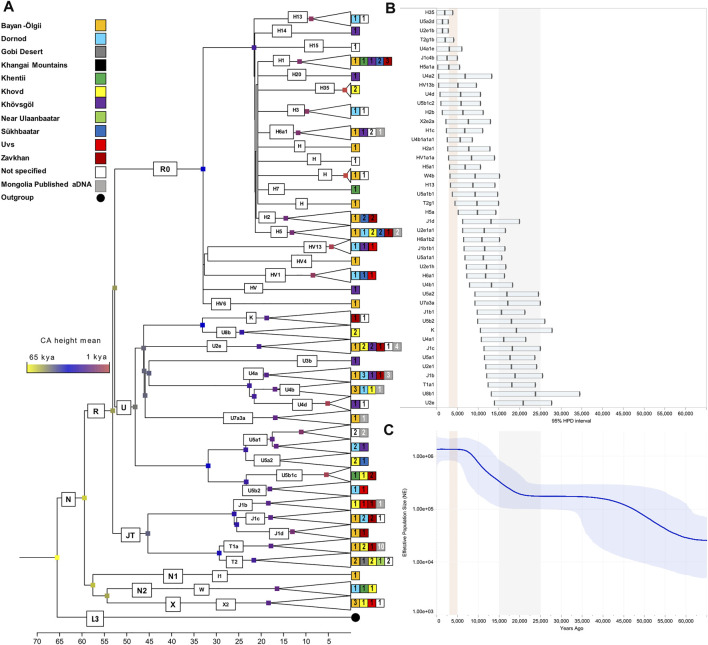
- Complete mitogenomes (N = 147; 121 western Eurasian and 26 eastern Asian) revealed two novel sub-branches, HV13b1 and U5b1c2; haplogroup H1 was present at about 3%, three times higher than reported for Inner Asia, with sub-clades H1b, H1c, and H1j.
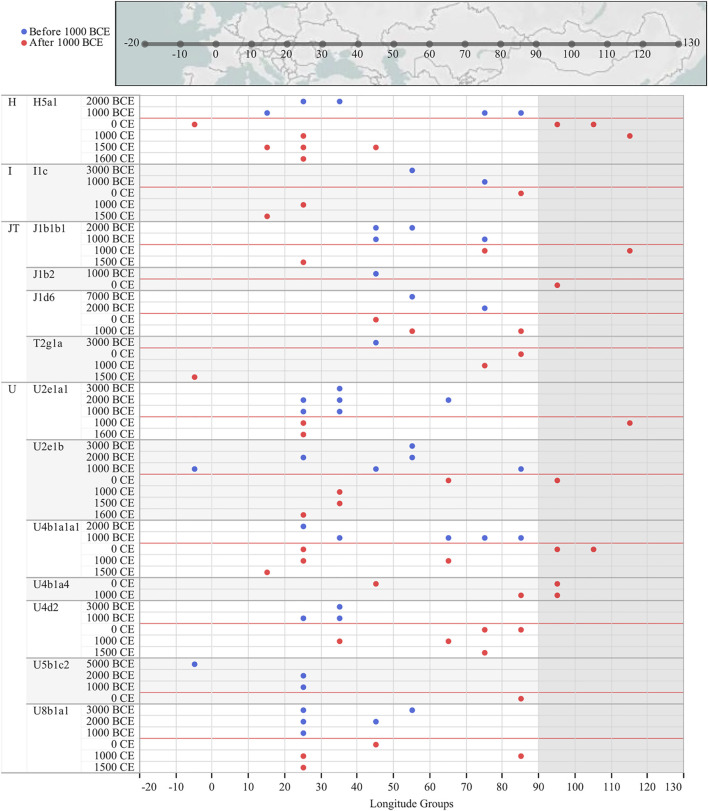
- Bayesian analyses reconstructed two major increases in effective population size: one beginning in the late glacial period around 18–15 kya and a steeper early Holocene increase; some lineages coalesced around 5 kya during the Bronze Age without a significant demographic impact, and six sub-lineages matched the timeframe and geographic path of the Silk Route.
Methods
- Collected 2,420 unrelated subjects with a Mongolian terminal maternal ancestor from 20 of 21 provinces using mouthwash; sequenced the mtDNA control region (2,133 full control-region haplotypes and 2,335 HVS1 haplotypes), classified haplogroups with PhyloTree build 17, and analyzed diversity, PCA, MDS, and haplotype sharing.
- Sequenced 147 complete mitogenomes using the Ion Torrent Personal Genome Machine, built a most parsimonious tree and Bayesian BEAST analyses with an L3 outgroup, and compared results with 693 published ancient mitogenomes, including 25 excavated in Mongolia.
Limitations
- Stated: provinces or macro-areas with fewer than 30 individuals were excluded from intra-Mongolia analyses; sample bias in the Khangai Mountains (N = 12) cannot be excluded; it was not completely possible to identify specific lineages that evolved in situ; and recent events younger than 3 kya cannot be accurately described through coalescent estimates because mitogenomes accumulate about one mutation in more than two thousand years on average.
- Evident from the text: sampling is uneven across provinces, and 348 individuals lacked province information and were assigned to an “unspecified” group, which may affect regional comparisons; control-region-only analyses also have lower resolution than complete mitogenomes.
Model-written summary. Check it against the paper before relying on it.
Integrity signals
Registry
Cites
Statistics
Figures
Verification
Claims the paper makes
46 Own result · 27 Own interpretation · 10 Check pending · 3 Sources not found · 3 Own method · 1 No full text of the sources · 1 Not checked yet
A result the paper reports from its own data — it cites no other source for it, so there is none to check. The quote shows it is in the paper.
In the paper
“The macro-haplogroup distribution across the country clearly shows a differential contribution of haplogroups with two distinct geographic origins”
§ Mitochondrial DNA Footprints from Western Eurasia in Modern Mongolia > Results > The Mitochondrial DNA Variation Within Mongolia
boostedstates an association- Asserted: passes — The authors put it forward as true.
- Checkable: passes — It can be checked against evidence.
- Load-bearing: passes — The paper’s conclusions depend on it.
- Based: passes — The paper gives a reason why it holds.
- Rests on an assumption not shown here.
A result the paper reports from its own data — it cites no other source for it, so there is none to check. The quote shows it is in the paper.
In the paper
“The PC2 separates the westernmost regions, Bayan-Ölgii, Khovd and Uvs, due to the high contribution of the typical WEu lineages JT, N2, R0 and X.”
§ Mitochondrial DNA Footprints from Western Eurasia in Modern Mongolia > Results > The Mitochondrial DNA Variation Within Mongolia
plainstates a cause- Asserted: passes — The authors put it forward as true.
- Checkable: passes — It can be checked against evidence.
- Load-bearing: passes — The paper’s conclusions depend on it.
- Based: passes — The paper gives a reason why it holds.
- Rests on an assumption not shown here.
A result the paper reports from its own data — it cites no other source for it, so there is none to check. The quote shows it is in the paper.
In the paper
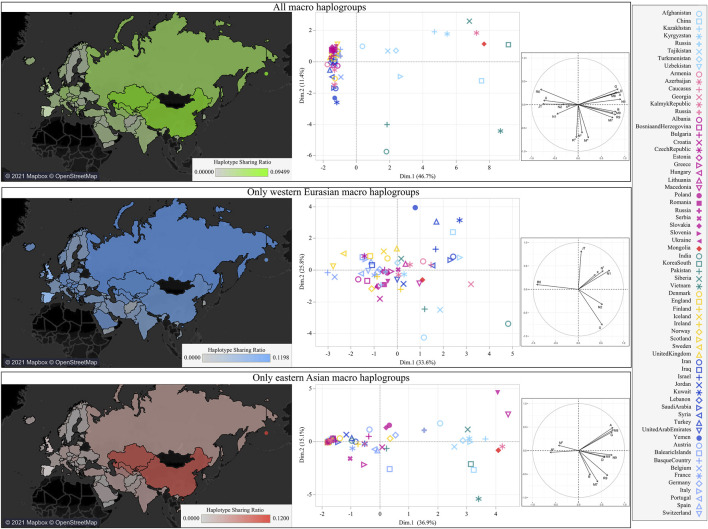
“When we tried to differentiate eastern and western contributions, the legacy of WEu haplogroups was less marked and more widespread.”
§ Mitochondrial DNA Footprints from Western Eurasia in Modern Mongolia > Results > The Mitochondrial DNA Variation of Mongolia in the Eurasian Context
plain- Asserted: passes — The authors put it forward as true.
- Checkable: passes — It can be checked against evidence.
- Load-bearing: passes — The paper’s conclusions depend on it.
- Based: passes — The paper gives a reason why it holds.
- Rests on an assumption not shown here.
A result the paper reports from its own data — it cites no other source for it, so there is none to check. The quote shows it is in the paper.
In the paper
“This genetic diversity is heterogeneously distributed within Mongolia (Figure 1A).”
§ Mitochondrial DNA Footprints from Western Eurasia in Modern Mongolia > Results > The Mitochondrial DNA Variation Within Mongolia
plain- Asserted: passes — The authors put it forward as true.
- Checkable: passes — It can be checked against evidence.
- Load-bearing: unclear — It is unclear whether the paper’s conclusions depend on it.
- Based: passes — The paper gives a reason why it holds.
- Rests on an assumption not shown here.
A result the paper reports from its own data — it cites no other source for it, so there is none to check. The quote shows it is in the paper.
In the paper
“The map based on haplotype sharing shows a greater proximity to surrounding Asian populations.”
§ Mitochondrial DNA Footprints from Western Eurasia in Modern Mongolia > Results > The Mitochondrial DNA Variation of Mongolia in the Eurasian Context
plainstates an association- Asserted: passes — The authors put it forward as true.
- Checkable: passes — It can be checked against evidence.
- Load-bearing: passes — The paper’s conclusions depend on it.
- Based: passes — The paper gives a reason why it holds.
- Rests on an assumption not shown here.
- It may state two separate claims as one. 35
- Probably not a substantial claim. 9
Create a free account to see these claims.
Create a free account to see these assumptions.
45 more claims
Create a free account to see all 91 claims and to verify the 19 references still open.
Self-check
Percentages, sums and reported differences re-computed from the paper’s own numbers.
Each contradiction between two passages listed here was confirmed by an independent check.
Rated minor: it would not touch a result — a value no result rests on, a p-value that stays on the same side of the significance level, or a conflict that is clerical, resolved elsewhere in the paper, or outside its own findings.
In the paper
§ Mitochondrial DNA Footprints from Western Eurasia in Modern Mongolia > Materials and Methods > Sample Collection and DNA Extraction
“The samples were collected in 20 (out of 21) Mongolian provinces:”
§ Mitochondrial DNA Footprints from Western Eurasia in Modern Mongolia > Introduction
“21 provinces (aimags) and one provincial municipality (Ulaanbaatar)”
Cited works that were retracted
Works this paper cites that were later retracted, from the retraction notices publishers deposit. Major when the notice came out before this paper was published.
A note, not an issue: for example, a cited work that was retracted only after this paper was published, which its authors could not have known.
In the paper
“Lan, 2019, MtDNA Polymorphism Analyses in the Chinese Mongolian Group: Efficiency Evaluation and Further Matrilineal Genetic Structure Exploration, Mol. Genet. Genomic Med., 7, e00934, 10.1002/mgg3.934”
Cited work 10.1002/mgg3.934 · retracted 2024-02-12 · notice 10.1002/mgg3.2366 · this paper published 2022-01-06
Citations
Cites
1 retracted
Lan, Q., Xie, T., Jin, X., Fang, Y., Mei, S., Yang, G., & Zhu, B. (2019) · Molecular Genetics & Genomic Medicine · doi:10.1002/mgg3.934 · Cited by 23
RetractedMEGA X: Molecular Evolutionary Genetics Analysis across Computing Platforms
Kumar, S., Stecher, G., Li, M., Knyaz, C., & Tamura, K. (2018) · Molecular Biology and Evolution · doi:10.1093/molbev/msy096 · Cited by 37,683
Excoffier, L., & Lischer, H. E. L. (2010) · Molecular Ecology Resources · doi:10.1111/j.1755-0998.2010.02847.x · Cited by 16,266
DnaSP v5: a software for comprehensive analysis of DNA polymorphism data
Librado, P., & Rozas, J. (2009) · Bioinformatics · doi:10.1093/bioinformatics/btp187 · Cited by 16,147
Integrative Genomics Viewer (IGV): high-performance genomics data visualization and exploration
Thorvaldsdottir, H., Robinson, J. T., & Mesirov, J. P. (2013) · Briefings in Bioinformatics · doi:10.1093/bib/bbs017 · Cited by 9,049
DnaSP 6: DNA Sequence Polymorphism Analysis of Large Data Sets
Rozas, J., Ferrer-Mata, A., Sánchez-DelBarrio, J. C., Guirao‐Rico, S., Librado, P., Ramos-Onsins, S. E., & Sánchez‐Gracia, A. (2017) · Molecular Biology and Evolution · doi:10.1093/molbev/msx248 · Cited by 7,697
BEAST 2.5: An advanced software platform for Bayesian evolutionary analysis
Bouckaert, R., Vaughan, T. G., Barido-Sottani, J., Duchêne, S., Fourment, M., Gavryushkina, A., Heled, J., Jones, G., Kühnert, D., De Maio, N., et al. (2019) · PLOS Computational Biology · doi:10.1371/journal.pcbi.1006650 · Cited by 4,556
Reanalysis and revision of the Cambridge reference sequence for human mitochondrial DNA
Andrews, R. M., Kubacka, I., Chinnery, P. F., Lightowlers, R. N., Turnbull, D. M., & Howell, N. (1999) · Nature Genetics · doi:10.1038/13779 · Cited by 3,337
Updated comprehensive phylogenetic tree of global human mitochondrial DNA variation
van Oven, M., & Kayser, M. (2009) · Human Mutation · doi:10.1002/humu.20921 · Cited by 1,810
Population genomics of Bronze Age Eurasia
Allentoft, M. E., Sikora, M., Sjögren, K.-G., Rasmussen, S., Rasmussen, M., Stenderup, J., Damgaard, P. B., Schroeder, H., Ahlström, T., Vinner, L., et al. (2015) · Nature · doi:10.1038/nature14507 · Cited by 1,550
The history and geography of human genes
Cann, R. L. (1995) · Choice Reviews Online · doi:10.5860/choice.33-0316 · Cited by 1,328
HaploGrep 2: mitochondrial haplogroup classification in the era of high-throughput sequencing
Weißensteiner, H., Pacher, D., Kloss‐Brandstätter, A., Forer, L., Specht, G., Bandelt, H., Kronenberg, F., Salas, A., & Schönherr, S. (2016) · Nucleic Acids Research · doi:10.1093/nar/gkw233 · Cited by 946
Correcting for Purifying Selection: An Improved Human Mitochondrial Molecular Clock
Soares, P. A., Ermini, L., Thomson, N., Mormina, M., Rito, T., Röhl, A., Salas, A., Oppenheimer, S., Macaulay, V. A., & Richards, M. B. (2009) · The American Journal of Human Genetics · doi:10.1016/j.ajhg.2009.05.001 · Cited by 729
The formation of human populations in South and Central Asia
Narasimhan, V. M., Patterson, N., Moorjani, P., Rohland, N., Bernardos, R., Mallick, S., Lazaridis, I., Nakatsuka, N., Olalde, I., Lipson, M., et al. (2019) · Science · doi:10.1126/science.aat7487 · Cited by 648
The Genetic Legacy of the Mongols
Zerjal, T., Xue, Y., Bertorelle, G., Wells, R. S., Bao, W., Zhu, S., Qamar, R., Ayub, Q., Mohyuddin, A., Fu, S., et al. (2003) · The American Journal of Human Genetics · doi:10.1086/367774 · Cited by 563
Achilli, A., Rengo, C., Magri, C., Battaglia, V., Olivieri, A., Scozzari, R., Cruciani, F., Zeviani, M., Briem, E., Carelli, V., et al. (2004) · The American Journal of Human Genetics · doi:10.1086/425590 · Cited by 464
Self-citationEMPOP--a forensic mtDNA database
Parson, W., & Dür, A. (2007) · Forensic Science International: Genetics · doi:10.1016/j.fsigen.2007.01.018 · Cited by 430
Self-citationGenomic insights into the formation of human populations in East Asia
Wang, C.-C., Yeh, H.-Y., Popov, A. N., Zhang, H.-Q., Matsumura, H., Sirak, K., Cheronet, O., Kovalev, A., Rohland, N., Kim, A. M., et al. (2021) · Nature · doi:10.1038/s41586-021-03336-2 · Cited by 408
Self-citationPosth, C., Renaud, G., Mittnik, A., Drucker, D. G., Rougier, H., Cupillard, C., Valentin, F., Thevenet, C., Furtwängler, A., Wißing, C., et al. (2016) · Current Biology · doi:10.1016/j.cub.2016.01.037 · Cited by 401
The Silk Road in World History
Liu, X. (2010) · OUP Catalogue · Cited by 370
The Eurasian Heartland: A continental perspective on Y-chromosome diversity
Wells, R. S., Yuldasheva, N., Ruzibakiev, R., Underhill, P. A., Evseeva, I., Blue-Smith, J., Jin, L., Su, B., Pitchappan, R., Shanmugalakshmi, S., et al. (2001) · Proceedings of the National Academy of Sciences · doi:10.1073/pnas.171305098 · Cited by 356
Where west meets east: the complex mtDNA landscape of the southwest and Central Asian corridor
Quintana-Murci, L., Chaix, R., Wells, R. S., Behar, D. M., Sayar, H., Scozzari, R., Rengo, C., Al-Zahery, N., Semino, O., Santachiara-Benerecetti, A. S., et al. (2004) · The American Journal of Human Genetics · doi:10.1086/383236 · Cited by 338
A Dynamic 6,000-Year Genetic History of Eurasia’s Eastern Steppe
Jeong, C., Wang, K., Wilkin, S., Taylor, W. T. T., Miller, B. K., Bemmann, J. H., Stahl, R., Chiovelli, C., Knolle, F., Ulziibayar, S., et al. (2020) · Cell · doi:10.1016/j.cell.2020.10.015 · Cited by 328
Self-citationYao, Y. (2004) · Molecular Biology and Evolution · doi:10.1093/molbev/msh238 · Cited by 244
Trading genes along the silk road: mtDNA sequences and the origin of central Asian populations.
Comas, D., Calafell, F., Mateu, E., Pérez-Lezaun, A., Bosch, E., Martínez-Arias, R., Clarimon, J., Facchini, F., Fiori, G., Luiselli, D., et al. (1998) · The American Journal of Human Genetics · doi:10.1086/302133 · Cited by 239
The genetic history of admixture across inner Eurasia
Jeong, C., Balanovsky, O., Lukianova, E., Kahbatkyzy, N., Flegontov, P., Zaporozhchenko, V., Immel, A., Wang, C.-C., Ixan, O., Khussainova, E., et al. (2019) · Nature Ecology & Evolution · doi:10.1038/s41559-019-0878-2 · Cited by 200
Parson, W., Strobl, C., Huber, G. E., Zimmermann, B., Gomes, S. M., Souto, L., Fendt, L., Delport, R., Langit, R., Wootton, S., et al. (2013) · Forensic Science International Genetics · doi:10.1016/j.fsigen.2013.06.003 · Cited by 192
Self-citationSaami and Berbers-An Unexpected Mitochondrial DNA Link
Achilli, A., Rengo, C., Battaglia, V., Pala, M., Olivieri, A., Fornarino, S., Magri, C., Scozzari, R., Babudri, N., Santachiara-Benerecetti, A. S., et al. (2005) · The American Journal of Human Genetics · doi:10.1086/430073 · Cited by 180
Self-citationThe Genetic Legacy of the Expansion of Turkic-Speaking Nomads across Eurasia
Yunusbayev, B., Metspalu, M., Metspalu, E., Valeev, A., Litvinov, S., Valiev, R., Akhmetova, V., Balanovska, E., Balanovsky, O., Turdikulova, S., et al. (2015) · PLOS Genetics · doi:10.1371/journal.pgen.1005068 · Cited by 176
Dairying enabled Early Bronze Age Yamnaya steppe expansions
Wilkin, S., Miller, A. V., Fernandes, R., Spengler, R. N., Taylor, W. T. T., Brown, D. R., Reich, D., Kennett, D. J., Culleton, B. J., Kunz, L., et al. (2021) · Nature · doi:10.1038/s41586-021-03798-4 · Cited by 164
The Complex Admixture History and Recent Southern Origins of Siberian Populations
Pugach, I., Matveev, R., Va, S., Makarov, S., Novgorodov, I. N., Осаковский, В. Л., Stoneking, M., & Pakendorf, B. (2016) · Molecular Biology and Evolution · doi:10.1093/molbev/msw055 · Cited by 145
Ancient DNA provides new insights into the history of south Siberian Kurgan people
Keyser, C., Bouakaze, C., Crubézy, E., Nikolaev, V. G., Montagnon, D., Reis, T., & Ludes, B. (2009) · Human Genetics · doi:10.1007/s00439-009-0683-0 · Cited by 118
Unravelling migrations in the steppe: mitochondrial DNA sequences from ancient Central Asians
Lalueza‐Fox, C., Sampietro, M. L., Gilbert, M. T. P., Castrì, L., Facchini, F., Pettener, D., & Bertranpetit, J. (2004) · Proceedings of the Royal Society B Biological Sciences · doi:10.1098/rspb.2004.2698 · Cited by 117
Next generation database search algorithm for forensic mitogenome analyses
Huber, N., Parson, W., & Dür, A. (2018) · Forensic Science International: Genetics · doi:10.1016/j.fsigen.2018.09.001 · Cited by 108
Self-citationArchaeogenomic distinctiveness of the Isthmo-Colombian area
Capodiferro, M. R., Aram, B., Raveane, A., Migliore, N. R., Colombo, G., Ongaro, L., Sandoval, J., Mendizábal, T., Mora, I. H., Tribaldos, M., et al. (2021) · Cell · doi:10.1016/j.cell.2021.02.040 · Cited by 107
Self-citationEvaluation of the precision ID whole MtDNA genome panel for forensic analyses
Strobl, C., Eduardoff, M., Buś, M. M., Allen, M., & Parson, W. (2018) · Forensic Science International Genetics · doi:10.1016/j.fsigen.2018.03.013 · Cited by 97
Self-citationHolocene environmental changes in Mongolia: A review
An, C., Chen, F., & Barton, L. (2008) · Global and Planetary Change · doi:10.1016/j.gloplacha.2008.03.007 · Cited by 87
Fine-Tuning Phylogenetic Alignment and Haplogrouping of mtDNA Sequences
Dür, A., Huber, N., & Parson, W. (2021) · International Journal of Molecular Sciences · doi:10.3390/ijms22115747 · Cited by 75
Self-citationBai, H., Guo, X., Narisu, N., Lan, T., Wu, Q., Xing, Y., Zhang, Y., Bond, S. R., Pei, Z., Zhang, Y., et al. (2018) · Nature Genetics · doi:10.1038/s41588-018-0250-5 · Cited by 56
Tracing the Origin of the East-West Population Admixture in the Altai Region (Central Asia)
González‐Ruiz, M., dos Santos, C. M. P., Jordana, X., Simón, M., Lalueza‐Fox, C., Gigli, E., Aluja, M. P., & Morera, A. M. (2012) · PLoS ONE · doi:10.1371/journal.pone.0048904 · Cited by 51
Mitochondrial Haplogroup H1 in north Africa: an Early Holocene Arrival from Iberia
Ottoni, C., Primativo, G., Hooshiar Kashani, B., Achilli, A., Martínez-Labarga, C., Biondi, G., Torroni, A., & Rickards, O. (2010) · PLoS ONE · doi:10.1371/journal.pone.0013378 · Cited by 49
Self-citationWestern Eurasian ancestry in modern Siberians based on mitogenomic data
Derenko, M. V., Malyarchuk, B. А., Denisova, G. A., Perkova, M. A., Litvinov, A., Grzybowski, T., Dambueva, I. K., Skonieczna, K., Rogalla, U., Tsybovsky, I. S., et al. (2014) · BMC Evolutionary Biology · doi:10.1186/s12862-014-0217-9 · Cited by 47
Decrypting the Mitochondrial Gene Pool of Modern Panamanians
Perego, U. A., Lancioni, H., Tribaldos, M., Angerhofer, N., Ekins, J. E., Olivieri, A., Woodward, S. R., Pascale, J. M., Cooke, R. G., Motta, J. A., et al. (2012) · PLoS ONE · doi:10.1371/journal.pone.0038337 · Cited by 47
Self-citationGenetic analysis and ethnic affinities from two Scytho‐Siberian skeletons
Ricaut, F., Keyser, C., Cammaert, L., Crubézy, É., & Ludes, B. (2003) · American Journal of Physical Anthropology · doi:10.1002/ajpa.10323 · Cited by 47
Ricaut, F., Keyser, C., Bourgeois, J., Crubézy, É., & Ludes, B. (2004) · Human Biology · doi:10.1353/hub.2004.0025 · Cited by 46
Ancient Xinjiang mitogenomes reveal intense admixture with high genetic diversity
Wang, W., Ding, M., Gardner, J. D., Wang, Y., Miao, B., Guo, W., Wu, X., Ruan, Q., Yu, J., Hu, X., et al. (2021) · Science Advances · doi:10.1126/sciadv.abd6690 · Cited by 38
Palstra, F. P., Heyer, E., & Austerlitz, F. (2015) · Molecular Biology and Evolution · doi:10.1093/molbev/msv030 · Cited by 36
Keyser, C., Zvénigorosky, V., Gonzalez, A., Fausser, J., Jagorel, F., Gérard, P., Turbat, T., Duchesne, S., Crubézy, É., & Ludes, B. (2020) · Human Genetics · doi:10.1007/s00439-020-02209-4 · Cited by 33
Gene admixture in ethnic populations in upper part of Silk Road revealed by mtDNA polymorphism
Yang, L., Tan, S., Yu, H., Zheng, B., Qiao, E.-F., Dong, Y., Zan, R., & Xiao, C. (2008) · Science in China Series C Life Sciences · doi:10.1007/s11427-008-0056-2 · Cited by 24
Chen, C., Li, Y., Tao, R., Jin, X., Guo, Y., Cui, W., Chen, A., Yang, Y., Zhang, X., Zhang, J., et al. (2020) · Genes · doi:10.3390/genes11111352 · Cited by 23
Modi, A., Lancioni, H., Cardinali, I., Capodiferro, M. R., Migliore, N. R., Hussein, A., Strobl, C., Bodner, M., Schnaller, L., Xavier, C., et al. (2020) · Scientific Reports · doi:10.1038/s41598-020-67445-0 · Cited by 17
Self-citationA paleogenetic study of the prehistoric populations of the Altai
Чикишева, Т. А., Gubina, M. A., Kulikov, I. V., Karafet, T. M., Voevoda, M. I., & Romaschenko, A. G. (2007) · Archaeology Ethnology and Anthropology of Eurasia · doi:10.1134/s156301100704012 · Cited by 15
ORKHONSELENGE, A., Komatsu, G., & Uuganzaya, M. (2018) · Géomorphologie : relief, processus, environnement · doi:10.4000/geomorphologie.12219 · Cited by 14
Ning, C., Zheng, H., Zhang, F., Wu, S., Li, C., Zhao, Y., Xu, Y., Wei, D., Wu, Y., Gao, S., et al. (2021) · Frontiers in Genetics · doi:10.3389/fgene.2021.740167 · Cited by 13
Ancient human genomes—keys to understanding our past
Achilli, A., Olivieri, A., Semino, O., & Torroni, A. (2018) · Science · doi:10.1126/science.aat7257 · Cited by 12
Self-citationU5A1 Mitochondrial DNA Haplotype Identified in Eneolithic Skeleton from Shatar Chuluu, Mongolia
Rogers, L., Honeychurch, W., Amartuvshin, C., & Kaestle, F. A. (2019) · Human Biology · doi:10.13110/humanbiology.91.4.01 · Cited by 8
Schurr, T. G., & Pipes, L. (2011) · University of Pennsylvania Museum of Archaeology and Anthropology eBooks · doi:10.2307/j.ctt3fhwrc.14 · Cited by 4
Surgical wisdom and Genghis Khan'sPax Mongolica
Köstenbauer, J. (2017) · ANZ Journal of Surgery · doi:10.1111/ans.13813 · Cited by 2
Research works printed but not linked: 2
- Kovalev, 2009, Discovery of New Cultures of the Bronze Age in Mongolia According to the Data Obtained by the International Central Asian Archaeological Expedition
- 2021, R: A Language and Environment for Statistical Computing
Cited by
The Revolution of Animal Genomics in Forensic Sciences
Cardinali, I., Tancredi, D., & Lancioni, H. (2023) · International Journal of Molecular Sciences · doi:10.3390/ijms24108821 · Cited by 22
Self-citationModi, A., Vizzari, M. T., Catalano, G., Agostini, R. B., Vai, S., Lari, M., Vergata, C., Zaro, V., Liccioli, L., Fedi, M., et al. (2022) · Frontiers in Genetics · doi:10.3389/fgene.2022.945227 · Cited by 8
Self-citationFifteen millennia of human mitogenome evolution in Sicily
Tommasi, A., Agostini, R. B., Villani, G., Migliore, N. R., Vizzari, M. T., Cardinali, I., Gerlando, R. D., Nicolini, V., Sorasio, G., Santos, P., et al. (2025) · Science Advances · doi:10.1126/sciadv.ady1674 · Cited by 6
Self-citationBodner, M., Amory, C., Olivieri, A., Gandini, F., Cardinali, I., Lancioni, H., Huber, G. E., Xavier, C., Pala, M., Fichera, A., et al. (2022) · International Journal of Molecular Sciences · doi:10.3390/ijms23126725 · Cited by 6
Self-citationCrisà, A., Cardinali, I., Giontella, A., Silvestrelli, M., Lancioni, H., & Buttazzoni, L. (2024) · Biology · doi:10.3390/biology13121087 · Cited by 5
Self-citation
Metadata
- Authors
- Cardinali, I., Bodner, M., Capodiferro, M. R., Amory, C., Rambaldi Migliore, N., Gomez, E. J., Myagmar, E., Dashzeveg, T., Carano, F., Woodward, S. R., Parson, W., Perego, U. A., Lancioni, H., & Achilli, A.
- Affiliations
- University of Perugia (IT)
- Innsbruck Medical University (AT)
- University of Pavia (IT)
- National University of Mongolia (MN)
- University of Bologna (IT)
- Pennsylvania State University (US)
- Southeastern Community College - Iowa (US)
- Corresponding author
- Cardinali, Irene
- Achilli, Alessandro
- ORCID
- Venue
- Frontiers in Genetics
- Publisher
- Frontiers Media SA
- Published
- 2022-01-06
- Volume
- 12
- Pages
- 819337-819337
- ISSN
- 1664-8021 (ISSN-L)
- PMC
- PMC8773455
- OpenAlex
- W4206652868
- Cited by
- 8
- References
- 58
- Citations by year
- 2026: 1 · 2025: 1 · 2024: 1 · 2023: 3 · 2022: 2
- FWCI
- 0.86
- Type
- journal article
- Language
- en
- Open access
- gold
- doi.org
- Licence
- Locations
- Frontiers in Genetics (publishedVersion, cc-by)
- PubMed Central (publishedVersion, cc-by)
- PubMed (publishedVersion)
- DOAJ (DOAJ: Directory of Open Access Journals) (submittedVersion, cc-by-sa)
- Funders
- National Geographic Society
- Ministero dell’Istruzione, dell’Università e della Ricerca
- Dipartimenti di Eccellenza
- Università degli Studi di Pavia
- Ministry of Education, Culture, Sports, Science and Technology
- Russian Foundation for Basic Research
- National University of Mongolia
- Topics
- Life Sciences › Biochemistry, Genetics and Molecular Biology › Genetics › Forensic and Genetic Research
- Life Sciences › Biochemistry, Genetics and Molecular Biology › Genetics › Genetic diversity and population structure
- Social Sciences › Anthropology › Pleistocene-Era Hominins and Archaeology
- Keywords
- mitochondrial DNA, Inner Asia, Eurasian steppe, gene flow, haplotype sharing, Pax Mongolica, Genghis Khan, effective population size, Bronze Age, Silk Road, ancient DNA, nomadic populations
About these checks
Registry, retraction, Cites and statistics results are computed, not judged, with one exception: a printed reference that no index lists is read once by a model before it counts as a citation error. Claims are extracted by a model and kept only when their quote appears verbatim in the text; each cited source is then checked, with a model’s help, for whether it says what the claim relies on. Those verdicts can be wrong — read the claim’s quote and the cited source before relying on one.
A language model drew the claims from the paper on 2026-11-12, under version 3 of the claim definition (model deepseek-v4.1-flash, prompt extract-v3).
A second model labelled each claim on 2026-11-12 (model jev-1.13-20260917, definition revision gold-guideline-v0.2).
Statistics and arithmetic are recomputed, not judged.
Confidence bands are shown only for fields calibrated on our annotated test set. None is calibrated yet, so no band is shown.
What counts as a claim ›How we measure confidence ›How we check this ›
Are you an author, or do you see a problem with this page? Request a review
