

The DOI matches its Crossref record; 6 of the 6 references it cites were found in a registry or an index.
Balancing speed and precision in protein folding: a comparison of AlphaFold2, ESMFold, and OmegaFold
Open accessPublished version of a preprint
Abstract
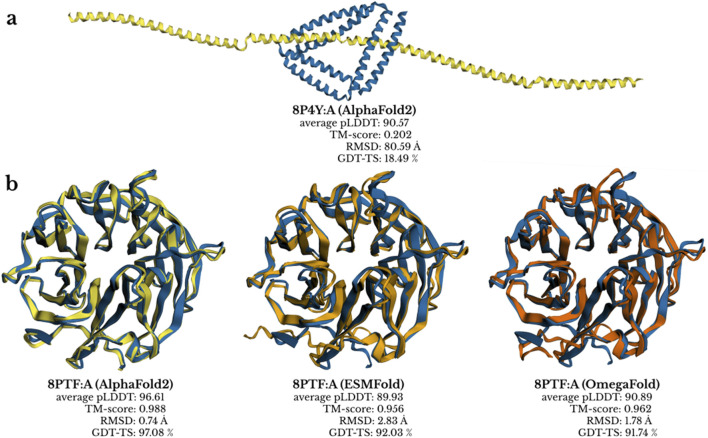
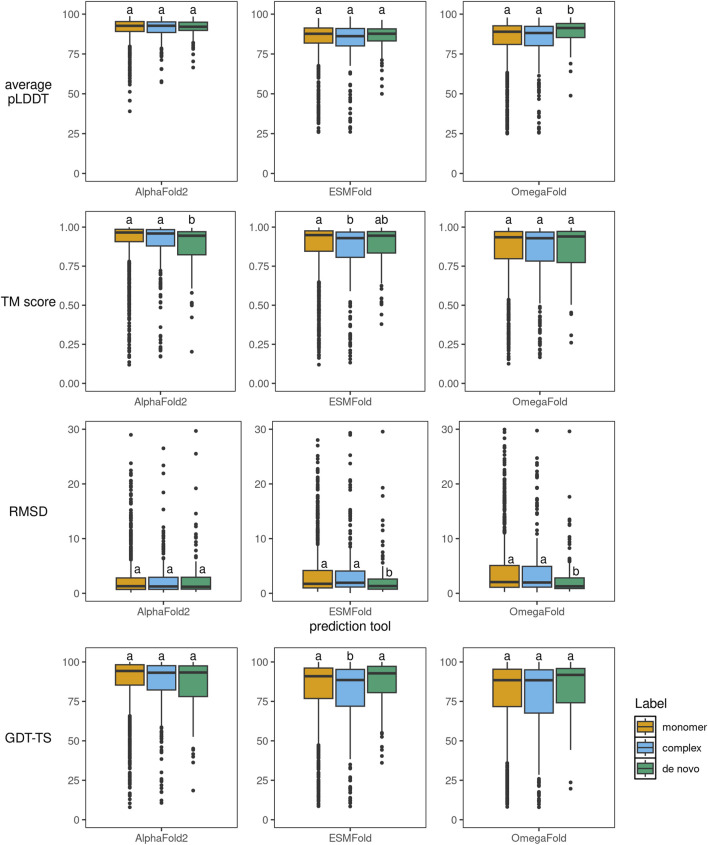
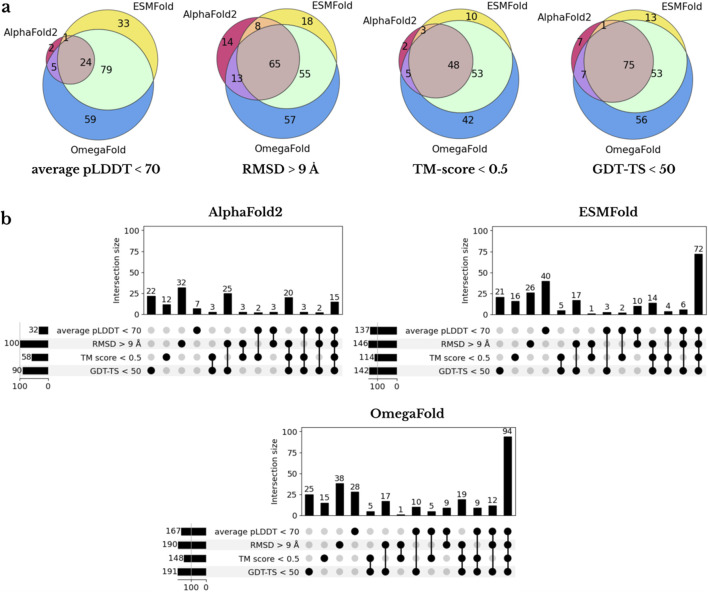
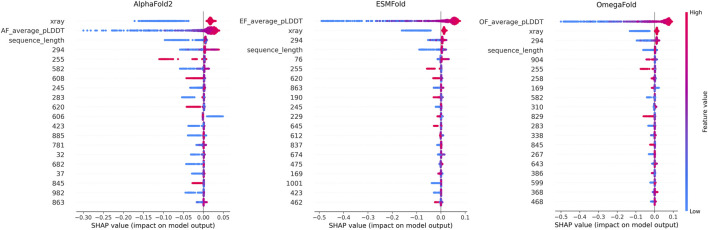
The rapid development of protein structure prediction tools has created a need for systematic performance comparisons to guide method selection for different applications, particularly given the trade-offs between computational speed and prediction accuracy. We benchmarked AlphaFold2, ESMFold, and OmegaFold using 1,337 protein chains deposited in the Protein Data Bank between July 2022 and July 2024, ensuring no overlap with training data, and evaluated predictions using Root Mean Square Deviation (RMSD), Template Modeling score (TM-score), Global Distance Test–Total Score (GDT-TS) and predicted Local Distance Difference Test (pLDDT) metrics. AlphaFold2 achieved the highest median TM-score (0.96), highest median GDT-TS (94%), and lowest median RMSD (1.30 Å), outperforming ESMFold (TM-score 0.95, GDT-TS 90%, RMSD 1.74 Å) and OmegaFold (TM-score 0.93, GDT-TS 89%, RMSD 1.98 Å), with all tools showing reduced accuracy for proteins lacking family annotations, leucine-rich repeats, and NMR-determined structures, while alignment-free methods unexpectedly excelled at de novo designed proteins. The performance differences between methods were negligible for many proteins, suggesting that faster alignment-free predictors (10–30 times faster) can be sufficient for numerous applications; we developed LightGBM classifiers using ProtBert embeddings and confidence scores that accurately predict when AlphaFold2’s computational investment is warranted, providing practitioners with actionable guidance for selecting between speed and precision in structural pipelines.
Overview
The claims and statistics of this paper haven’t been checked yet.
Run the check — free, no account needed. It reads the open-access text and checks the sources it cites.
Integrity signals
Registry
Cites
Statistics
Figures
Verification
Claims the paper makes
The claims and statistics of this paper haven’t been checked yet.
Run the check — free, no account needed. It reads the open-access text and checks the sources it cites.
Self-check
Percentages, sums and reported differences re-computed from the paper’s own numbers.
The self-check needs the paper’s full text.
Citations
Cites
Highly accurate protein structure prediction with AlphaFold
Jumper, J., Evans, R., Pritzel, A., Green, T., Figurnov, M., Ronneberger, O., Tunyasuvunakool, K., Bates, R., Žídek, A., Potapenko, A., et al. (2021) · Nature · doi:10.1038/s41586-021-03819-2 · Cited by 43,764
Accurate structure prediction of biomolecular interactions with AlphaFold 3
Abramson, J., Adler, J., Dunger, J., Evans, R., Green, T., Pritzel, A., Ronneberger, O., Willmore, L., Ballard, A. J., Bambrick, J., et al. (2024) · Nature · doi:10.1038/s41586-024-07487-w · Cited by 15,861
Evolutionary-scale prediction of atomic level protein structure with a language model
Lin, Z., Akin, H., Rao, R., Hie, B., Zhu, Z., Lu, W., Smetanin, N., Verkuil, R., Kabeli, O., Shmueli, Y., et al. (2022) · doi:10.1101/2022.07.20.500902 · Cited by 5,990
Highly accurate protein structure prediction for the human proteome
Tunyasuvunakool, K., Adler, J., Wu, Z., Green, T., Zielinski, M., Žídek, A., Bridgland, A., Cowie, A., Meyer, C., Laydon, A., et al. (2021) · Nature · doi:10.1038/s41586-021-03828-1 · Cited by 3,025 · cited 1×
“Using multiple evaluation metrics including RMSD (Kufareva and Abagyan, 2012), TM-score (Zhang and Skolnick, 2004), GDT-TS (Zemla, 2003), and pLDDT (Tunyasuvunakool et al., 2021), we assess both overall performance and specific challenging cases.”
How significant is a protein structure similarity with TM-score = 0.5?
Xu, J., & Zhang, Y. (2010) · Bioinformatics · doi:10.1093/bioinformatics/btq066 · Cited by 1,142
Evaluating generalization in protein–ligand cofolding methods
Škrinjar, P., Eberhardt, J., Studer, G., Tauriello, G., Schwede, T., & Durairaj, J. (2026) · Nature Structural & Molecular Biology · doi:10.1038/s41594-026-01797-5 · Cited by 22
Research works printed but not linked: 32
- Alberts, 2017, Molecular biology of the cell, 10.1201/9781315735368 · DOI
- Bittrich, 2023, RCSB protein data bank: efficient searching and simultaneous access to one million computed structure models alongside the PDB structures enabled by architectural advances, J. Mol. Biol., 435, 167994, 10.1016/j.jmb.2023.167994 · DOI
- Brandes, 2022, Proteinbert: a universal deep-learning model of protein sequence and function, Bioinformatics, 38, 2102, 10.1093/bioinformatics/btac020 · DOI · Paper page
- Callaway, 2024, Ai protein-prediction tool alphafold3 is now more open, Nature, 635, 531, 10.1038/d41586-024-03708-4 · DOI
- 2024, Chai-1: decoding the molecular interactions of life, bioRxiv, 10.1101/2024.10.10.615955 · DOI · Paper page
- Cock, 2009, Biopython: freely available Python tools for computational molecular biology and bioinformatics, Bioinformatics, 25, 1422, 10.1093/bioinformatics/btp163 · DOI · Paper page
- Cooper, 2000, The cell: a molecular approach
- Elliott, 2025, Abcfold: easier running and comparison of alphafold 3, boltz-1 and chai-1, Bioinforma. Adv., 5, vbaf153, 10.1093/bioadv/vbaf153 · DOI · Paper page
- Hu, 2021, NMR-based methods for protein analysis, Anal. Chem., 93, 1866, 10.1021/acs.analchem.0c03830 · DOI
- Huang, 2023, Protein structure prediction: challenges, advances, and the shift of research paradigms, Genomics Proteomics Bioinform., 21, 913, 10.1016/j.gpb.2022.11.014 · DOI
- Kalogeropoulos, 2024, A comparative study of protein structure prediction tools for challenging targets: snake venom toxins, Toxicon, 238, 107559, 10.1016/j.toxicon.2023.107559 · DOI
- Ke, 2017, Lightgbm: a highly efficient gradient boosting decision tree, Adv. Neural Inform. Process. Syst., 30, 10.5555/3294996.3295074 · DOI
- Kovalevskiy, 2024, AlphaFold two years on: validation and impact, Proc. Natl. Acad. Sci., 121, e2315002121, 10.1073/pnas.2315002121 · DOI
- Kufareva, 2012, Methods of protein structure comparison, Methods Mol. Biol., 857, 231, 10.1007/978-1-61779-588-6_10 · DOI
- Manfredi, 2024, Alpha&ESMhFolds: a web server for comparing AlphaFold2 and ESMFold models of the human reference proteome, J. Mol. Biol., 436, 168593, 10.1016/j.jmb.2024.168593 · DOI
- Manfredi, 2025, Evaluation of the structural models of the human reference proteome: Alphafold2 versus esmfold, Curr. Res. Struct. Biol., 9, 100167, 10.1016/j.crstbi.2025.100167 · DOI
- Milne, 2013, Cryo-electron microscopy: a primer for the non-microscopist, FEBS J., 280, 28, 10.1111/febs.12078 · DOI · Paper page
- Moult, 1995, A large-scale experiment to assess protein structure prediction methods, Proteins Struct. Funct. Bioinforma., 23, ii, 10.1002/prot.340230303 · DOI · Paper page
- Moussad, 2023, The transformative power of transformers in protein structure prediction, Proc. Natl. Acad. Sci., 120, e2303499120, 10.1073/pnas.2303499120 · DOI
- 2020, R: a language and environment for statistical computing
- Robin, 2021, Continuous automated model EvaluatiOn (CAMEO)—Perspectives on the future of fully automated evaluation of structure prediction methods, Proteins Struct. Funct. Bioinforma., 89, 1977, 10.1002/prot.26213 · DOI
- Rose, 2021, RCSB protein data bank: architectural advances towards integrated searching and efficient access to macromolecular structure data from the PDB archive, J. Mol. Biol., 433, 166704, 10.1016/j.jmb.2020.11.003 · DOI
- Selkoe, 2003, Folding proteins in fatal ways, Nature, 426, 900, 10.1038/nature02264 · DOI
- Škrinjar, 2025, Have protein-ligand co-folding methods moved beyond memorisation?, BioRxiv, 10.1101/2025.02.03.636309 · DOI
- Smyth, 2000, X ray crystallography, Mol. Pathol., 53, 8, 10.1136/mp.53.1.8 · DOI
- Valdés-Tresanco, 2023, Structural modeling of nanobodies: a benchmark of state-of-the-art artificial intelligence programs, Molecules, 28, 3991, 10.3390/molecules28103991 · DOI
- Wohlwend, 2024, Boltz-1: democratizing biomolecular interaction modeling, bioRxiv, 10.1101/2024.11.19.624167 · DOI
- Wu, 2022, High-resolution de novo structure prediction from primary sequence, Bioinformatics, 10.1101/2022.07.21.500999 · DOI · Paper page
- Xu, 2025, Foldbench: an all-atom benchmark for biomolecular structure prediction, bioRxiv, 10.1101/2025.05.22.655600 · DOI
- Zemla, 2003, Lga: a method for finding 3d similarities in protein structures, Nucleic Acids Res., 31, 3370, 10.1093/nar/gkg571 · DOI · Paper page
- Zhang, 2004, Scoring function for automated assessment of protein structure template quality, Proteins Struct. Funct. Bioinforma., 57, 702, 10.1002/prot.20264 · DOI · Paper page
- Zhou, 2025, Benchmarking alphafold3-like methods for protein-peptide complex prediction, bioRxiv, 10.1101/2025.03.09.642277 · DOI
Metadata
- Authors
- Hýsková, A., Maršálková, E., & Šimeček, P.
- Affiliations
- Central European Institute of Technology – Masaryk University (CZ)
- Faculty of Science, Central European Institute of Technology (CEITEC), Masaryk University
- Corresponding author
- Šimeček, Petr
- ORCID
- Šimeček, Petr
- Venue
- Frontiers in Genetics
- Publisher
- Frontiers Media SA
- Published
- 2026-01-14
- Volume
- 16
- Pages
- 1715037-1715037
- ISSN
- 1664-8021 (ISSN-L)
- PMC
- PMC12844563
- OpenAlex
- W7123648101
- Cited by
- 16
- References
- 6
- Citations by year
- 2026: 14
- FWCI
- 28.93
- Type
- journal article
- Language
- en
- Open access
- gold
- doi.org
- Licence
- Locations
- Frontiers in Genetics (publishedVersion, cc-by)
- bioRxiv (Cold Spring Harbor Laboratory) (acceptedVersion, cc-by)
- PubMed (publishedVersion)
- PubMed Central (publishedVersion, cc-by)
- DOAJ (DOAJ: Directory of Open Access Journals) (submittedVersion, cc-by-sa)
- Veřejné služby Informačního systému (Masarykiana Brunensis Universitas) (submittedVersion, cc-by)
- Funders
- Grantová Agentura České Republiky
- Topics
- Life Sciences › Biochemistry, Genetics and Molecular Biology › Molecular Biology › Protein Structure and Dynamics
- Life Sciences › Biochemistry, Genetics and Molecular Biology › Molecular Biology › Machine Learning in Bioinformatics
- Life Sciences › Biochemistry, Genetics and Molecular Biology › Structural Biology › Enzyme Structure and Function
- Keywords
- protein structure prediction, AlphaFold2, ESMFold, benchmarking, prediction accuracy, computational speed, leucine-rich repeats, NMR structure, method selection
About these checks
Registry, retraction, Cites and statistics results are computed, not judged, with one exception: a printed reference that no index lists is read once by a model before it counts as a citation error. Claims are extracted by a model and kept only when their quote appears verbatim in the text; each cited source is then checked, with a model’s help, for whether it says what the claim relies on. Those verdicts can be wrong — read the claim’s quote and the cited source before relying on one.
Statistics and arithmetic are recomputed, not judged.
Confidence bands are shown only for fields calibrated on our annotated test set. None is calibrated yet, so no band is shown.
What counts as a claim ›How we measure confidence ›How we check this ›
Are you an author, or do you see a problem with this page? Request a review
