

The DOI matches its Crossref record; 63 of the 63 references it cites were found in a registry or an index.
Mesenchymal Stromal Cell-Derived Extracellular Vesicles Attenuate Dendritic Cell Maturation and Function
Open accessAbstract
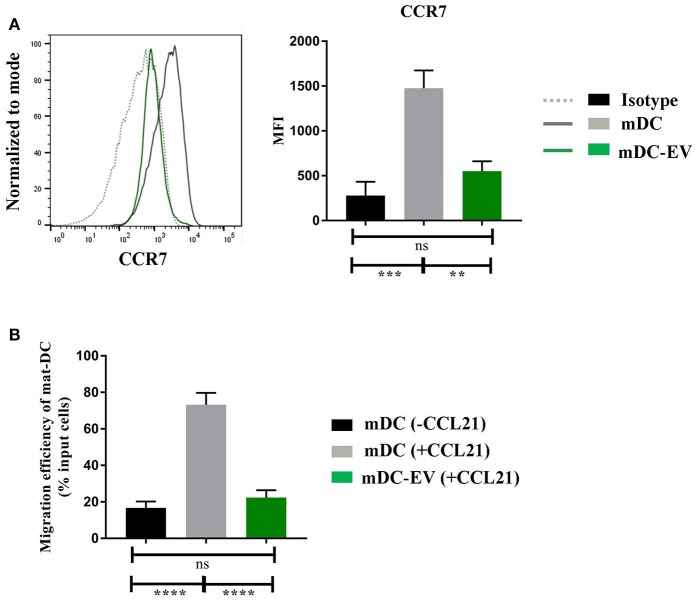
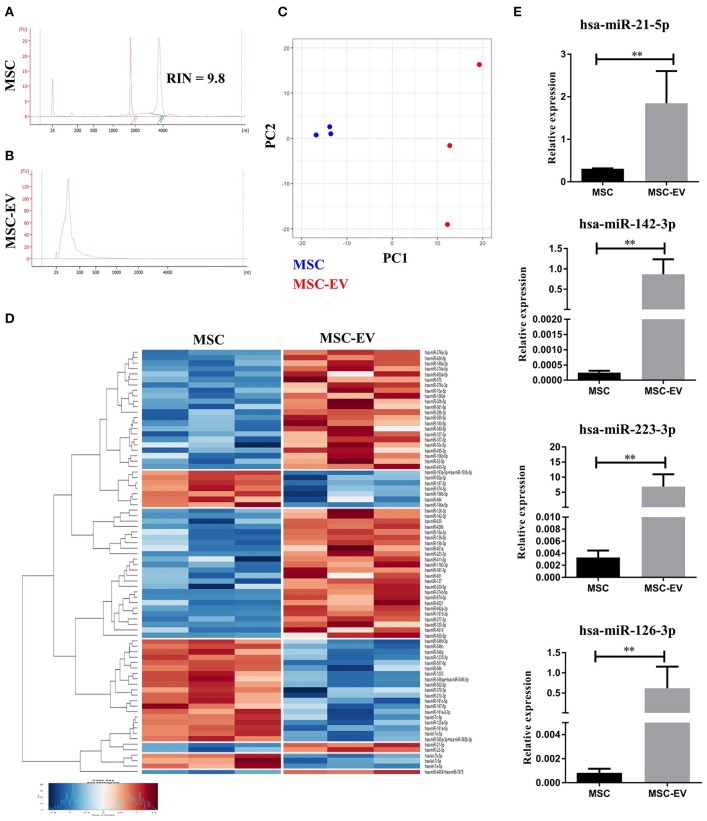
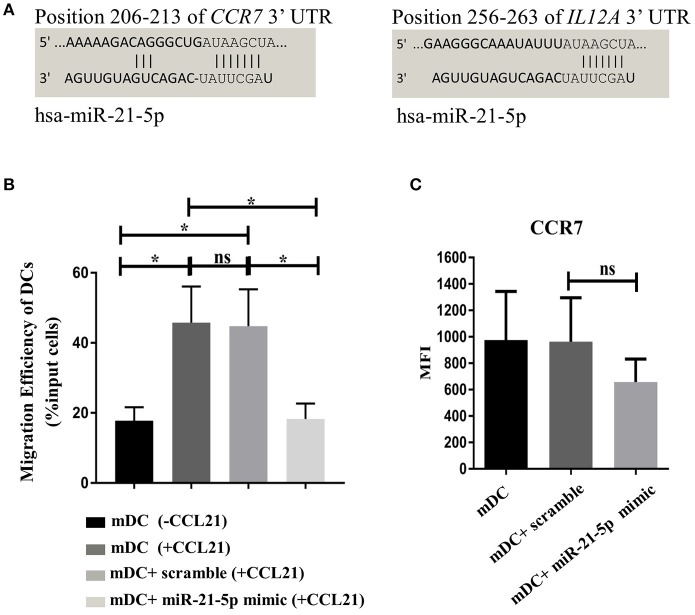
Mesenchymal stromal cells (MSCs) are potent regulators of immune responses largely through paracrine signaling. MSC secreted extracellular vesicles (MSC-EVs) are increasingly recognized as the key paracrine factors responsible for the biological and therapeutic function of MSCs. We report the first comprehensive study demonstrating the immunomodulatory effect of MSC-EVs on dendritic cell (DC) maturation and function. MSC-EVs were isolated from MSC conditioned media using differential ultracentrifugation. Human monocyte-derived DCs were generated in the absence or presence of MSC-EVs (20 ug/ml) then subjected to phenotypic and functional analysis in vitro. MSC-EV treatment impaired antigen uptake by immature DCs and halted DC maturation resulting in reduced expression of the maturation and activation markers CD83, CD38, and CD80, decreased secretion of pro-inflammatory cytokines IL-6 and IL-12p70 and increased production of anti-inflammatory cytokine TGF-β. MSC-EV treated DCs also demonstrated a diminished CCR 7 expression after LPS stimulation, coupled with a significantly reduced ability to migrate towards the CCR7-ligand CCL21, although they were still able to stimulate allogeneic T cell proliferation in vitro. Through microRNA profiling we have identified 49 microRNAs, which were significantly enriched in MSC-EVs compared to their parent MSCs. MicroRNAs with known effect on DC maturation and functions, including miR-21-5p, miR-142-3p, miR-223-3p and miR-126-3p, were detected within the top 10 most enriched miRNAs in MSC-EVs, with MiR-21-5p as the third highest expressed miRNA in MSC-EVs. In silico analysis revealed that miR-21-5p targets the CCR7 gene for degradation. To verify these observations, DCs were transfected with miR-21-5p mimics and analyzed for their ability to migrate towards the CCR7-ligand CCL21 in vitro. MiR-21-5p mimic transfected DCs showed a clear trend of reduced CCR7 expression and a significantly decreased migratory ability towards the CCL21. Our findings suggest that MSC-EVs are able to recapitulate MSC mediated DC modulation and MSC-EV enclosed microRNAs may represent a novel mechanism through which MSCs modulate DC functions. As MSCs are currently used in clinical trials to treat numerous diseases associated with immune dysregulation such as graft-versus-host disease and inflammatory bowel disease, our data provide novel evidence to inform potential future application of MSC-EVs as a cell-free therapeutic agent.
Overview
The claims and statistics of this paper haven’t been checked yet.
Run the check — free, no account needed. It reads the open-access text and checks the sources it cites.
Integrity signals
Registry
Cites
Statistics
Figures
Verification
Claims the paper makes
The claims and statistics of this paper haven’t been checked yet.
Run the check — free, no account needed. It reads the open-access text and checks the sources it cites.
Claims other papers make about this one
Each is checked against this paper’s own text: does it say what the citing paper says it does?
The source backs part of the claim, not all of it — or backs it for a different population, condition or comparison.
In the citing paper
“some miRNAs present in MSC-derived EVs are capable of suppressing DC activity, such as mi-R-126-3p, miR-223-3p and miR-142-3p [47].”
From Mesenchymal stem cell secretome for regenerative medicine: Where do we stand? (2025) · cites this paper as [47]
Experimental — accuracy not yet measured
Self-check
Percentages, sums and reported differences re-computed from the paper’s own numbers.
The self-check needs the paper’s full text.
Citations
Cites
Dominici, M., Le Blanc, K., Mueller, I., Slaper-Cortenbach, I., Marini, F. C., Krause, D. S., Deans, R. J., Keating, A., Prockop, D. J., & Horwitz, E. M. (2006) · Cytotherapy · doi:10.1080/14653240600855905 · Cited by 17,766
Biogenesis, Secretion, and Intercellular Interactions of Exosomes and Other Extracellular Vesicles
Colombo, M., Raposo, G., & Théry, C. (2014) · Annual Review of Cell and Developmental Biology · doi:10.1146/annurev-cellbio-101512-122326 · Cited by 6,186
Isolation and Characterization of Exosomes from Cell Culture Supernatants and Biological Fluids
Théry, C., Amigorena, S., Raposo, G., & Clayton, A. (2006) · Current Protocols in Cell Biology · doi:10.1002/0471143030.cb0322s30 · Cited by 5,766
Exosome secreted by MSC reduces myocardial ischemia/reperfusion injury
Lai, R. C., Arslan, F., Lee, M. M., Sze, N. S. K., Choo, A., Chen, T. S., Salto-Tellez, M., Timmers, L., Lee, C. N., El Oakley, R. M., et al. (2010) · Stem Cell Research · doi:10.1016/j.scr.2009.12.003 · Cited by 2,215
Zhang, H., Freitas, D. P., Kim, H. S., Fabijanic, K. I., Li, Z., Chen, H., Mark, M. T., Molina, H., Benito‐Martín, A., Bojmar, L., et al. (2018) · Nature Cell Biology · doi:10.1038/s41556-018-0040-4 · Cited by 1,666
MSC-derived exosomes: a novel tool to treat therapy-refractory graft-versus-host disease
Kordelas, L., Rebmann, V., Ludwig, A., Radtke, S., Ruesing, J., Doeppner, T. R., Epple, M., Horn, P., Beelen, D. W., & Giebel, B. (2014) · Leukemia · doi:10.1038/leu.2014.41 · Cited by 1,086
Paracrine Mechanisms of Mesenchymal Stem Cell-Based Therapy: Current Status and Perspectives
Liang, X., Ding, Y., Zhang, Y., Tse, H.-F., & Lian, Q. (2014) · Cell Transplantation · doi:10.3727/096368913x667709 · Cited by 909
Morrison, T. J., Jackson, M. V., Cunningham, E. K., Kissenpfennig, A., McAuley, D. F., O’Kane, C. M., & Krasnodembskaya, A. D. (2017) · American Journal of Respiratory and Critical Care Medicine · doi:10.1164/rccm.201701-0170oc · Cited by 796
Baglio, S. R., Rooijers, K., Koppers‐Lalic, D., Verweij, F. J., Pérez-Lanzón, M., Zini, N., Naaijkens, B. A., Perut, F., Niessen, H. W. M., Baldini, N., et al. (2015) · Stem Cell Research & Therapy · doi:10.1186/s13287-015-0116-z · Cited by 776
Mesenchymal Stem Cells Secrete Immunologically Active Exosomes
Zhang, B., Yin, Y., Lai, R. C., Tan, S. S., Choo, A. B. H., & Lim, S. K. (2013) · Stem Cells and Development · doi:10.1089/scd.2013.0479 · Cited by 710
Cited by
Sorted by citations
Mesenchymal Stem Cell Immunomodulation: Mechanisms and Therapeutic Potential
Song, N., Scholtemeijer, M., & Shah, K. (2020) · Trends in Pharmacological Sciences · doi:10.1016/j.tips.2020.06.009 · Cited by 948
Mesenchymal stromal cell therapies: immunomodulatory properties and clinical progress
Wu, X., Jiang, J., Gu, Z., Zhang, J., Chen, Y., & Liu, X. (2020) · Stem Cell Research & Therapy · doi:10.1186/s13287-020-01855-9 · Cited by 343
The Immunomodulatory Functions of Mesenchymal Stromal/Stem Cells Mediated via Paracrine Activity
Zhou, Y., Yamamoto, Y., Xiao, Z., & Ochiya, T. (2019) · Journal of Clinical Medicine · doi:10.3390/jcm8071025 · Cited by 303
Insights into the Secretome of Mesenchymal Stem Cells and Its Potential Applications
Eleuteri, S., & Fierabracci, A. (2019) · International Journal of Molecular Sciences · doi:10.3390/ijms20184597 · Cited by 311
Effects of Mesenchymal Stem Cell-Derived Exosomes on Autoimmune Diseases
Shen, Z., Huang, W., Liu, J., Tian, J., Wang, S., & Rui, K. (2021) · Frontiers in Immunology · doi:10.3389/fimmu.2021.749192 · Cited by 285
Varderidou‐Minasian, S., & Lorenowicz, M. J. (2020) · Theranostics · doi:10.7150/thno.40122 · Cited by 279
Biology and therapeutic potential of mesenchymal stem cell‐derived exosomes
Zhou, X., & Kalluri, R. (2020) · Cancer Science · doi:10.1111/cas.14563 · Cited by 266
Exosomal microRNAs derived from mesenchymal stem cells: cell-to-cell messages
Asgarpour, K., Shojaei, Z., Amiri, F., Ai, J., Mahjoubin‐Tehran, M., Ghasemi, F., Arefnezhad, R., Hamblin, M. R., & Mirzaei, H. (2020) · Cell Communication and Signaling · doi:10.1186/s12964-020-00650-6 · Cited by 224
Mesenchymal stem cell secretome for regenerative medicine: Where do we stand?
Trigo, C. M., Rodrigues, J. S., Camões, S. P., Solá, S., & Miranda, J. P. (2025) · Journal of Advanced Research · doi:10.1016/j.jare.2024.05.004 · Cited by 252
“It was also suggested that some miRNAs present in MSC-derived EVs are capable of suppressing DC activity, such as mi-R-126-3p, miR-223-3p and miR-142-3p [47].”
Almeria, C., Weiss, R., Roy, M., Tripisciano, C., Kasper, C., Weber, V., & Egger, D. (2019) · Frontiers in Bioengineering and Biotechnology · doi:10.3389/fbioe.2019.00292 · Cited by 196
Műzes, G., & Sípos, F. (2022) · Cells · doi:10.3390/cells11152300 · Cited by 177
Galland, S., & Stamenkovic, I. (2020) · The Journal of Pathology · doi:10.1002/path.5357 · Cited by 165
Shahir, M., Hashemi, S. M., Asadirad, A., Varahram, M., Dizaji, M. K., Folkerts, G., Garssen, J., Adcock, I. M., & Mortaz, E. (2020) · Journal of Cellular Physiology · doi:10.1002/jcp.29601 · Cited by 159
Zheng, Z., Li, X. Y., Ding, J., Jia, J., & Zhu, P. (2007) · Lara D. Veeken · doi:10.1093/rheumatology/kem284 · Cited by 153
López-García, L., & Castro-Manrreza, M. E. (2021) · International Journal of Molecular Sciences · doi:10.3390/ijms22179531 · Cited by 161
Kim, H., Lee, M. J., Bae, E., Ryu, J. S., Kaur, G., Kim, H. J., Kim, J. Y., Barreda, H., Jung, S. Y., Choi, J. M., et al. (2020) · Molecular Therapy · doi:10.1016/j.ymthe.2020.04.020 · Cited by 149
Immunoregulatory Effects of Stem Cell-Derived Extracellular Vesicles on Immune Cells
Xie, M., Xiong, W., She, Z., Wen, Z., Abdirahman, A. S., Wan, W., & Wen, C. (2020) · Frontiers in Immunology · doi:10.3389/fimmu.2020.00013 · Cited by 133
Gomzikova, M. O., James, V. H., & Rizvanov, A. A. (2019) · Frontiers in Immunology · doi:10.3389/fimmu.2019.02663 · Cited by 124
Extracellular vesicles as bioactive nanotherapeutics: An emerging paradigm for regenerative medicine
Li, M., Fang, F., Sun, M., Zhang, Y., Hu, M., & Zhang, J. (2022) · Theranostics · doi:10.7150/thno.72812 · Cited by 121
Mesenchymal Stem Cell-Derived Extracellular Vesicles: A Novel Cell-Free Therapy
Jafarinia, M., Alsahebfosoul, F., Salehi, H., Eskandari, N., & Ganjalıkhani-Hakemi, M. (2020) · Immunological Investigations · doi:10.1080/08820139.2020.1712416 · Cited by 124
Immunosuppressive Effects of Mesenchymal Stem Cells-derived Exosomes
Qian, X., An, N., Ren, Y., Yang, C., Zhang, X., & Li, L. (2020) · Stem Cell Reviews and Reports · doi:10.1007/s12015-020-10040-7 · Cited by 123
Mesenchymal Stem Cell-Derived Extracellular Vesicles in Liver Immunity and Therapy
Wu, R., Fan, X., Wang, Y., Shen, M., Zheng, Y., Zhao, S., & Yang, L. (2022) · Frontiers in Immunology · doi:10.3389/fimmu.2022.833878 · Cited by 125
Ortega, A., Martínez-Arroyo, O., Forner, M. J., & Cortés, R. (2020) · Pharmaceutics · doi:10.3390/pharmaceutics13010003 · Cited by 113
Zou, Z., Han, L., Xu, G., Hu, Y., Zhang, W., & Tian, K. (2023) · International Journal of Nanomedicine · doi:10.2147/ijn.s417422 · Cited by 115
New Insights of CCR7 Signaling in Dendritic Cell Migration and Inflammatory Diseases
Hong, W., Yang, B., He, Q., Wang, J., & Weng, Q. (2022) · Frontiers in Pharmacology · doi:10.3389/fphar.2022.841687 · Cited by 105
Extracellular Vesicles from Mesenchymal Stem Cells as Novel Treatments for Musculoskeletal Diseases
Alcaraz, M. J., Álvaro Compan, J., & Guillén, M. I. (2019) · Cells · doi:10.3390/cells9010098 · Cited by 107
Mesenchymal Stem Cells in the Pathogenesis and Therapy of Autoimmune and Autoinflammatory Diseases
Zaripova, L. N., Midgley, A., Christmas, S. E., Beresford, M. W., Pain, C. E., Baildam, E. M., & Oldershaw, R. A. (2023) · International Journal of Molecular Sciences · doi:10.3390/ijms242216040 · Cited by 107
Immunomodulatory Mechanisms and Therapeutic Potential of Mesenchymal Stem Cells
Yang, G., Fan, X., Liu, Y., Jie, P., Mazhar, M., Liu, Y., Dechsupa, N., & Wang, L. (2023) · Stem Cell Reviews and Reports · doi:10.1007/s12015-023-10539-9 · Cited by 113
Baluška, F., Miller, W. B., & Reber, A. S. (2022) · Biological Journal of the Linnean Society · doi:10.1093/biolinnean/blac005 · Cited by 101
Kot, M., Baj‐Krzyworzeka, M., Szatanek, R., Musiał-Wysocka, A., Suda-Szczurek, M., & Majka, M. (2019) · International Journal of Molecular Sciences · doi:10.3390/ijms20225680 · Cited by 97
Extracellular Vesicles as Mediators of Cellular Crosstalk Between Immune System and Kidney Graft
Quaglia, M., Dellepiane, S., Guglielmetti, G., Merlotti, G., Castellano, G., & Cantaluppi, V. (2020) · Frontiers in Immunology · doi:10.3389/fimmu.2020.00074 · Cited by 96
Advances and clinical challenges of mesenchymal stem cell therapy
Mei, R., Wan, Z., Yang, C., Shen, X., Wang, R., Zhang, H., Yang, R., Li, J., Song, Y., & Su, H. (2024) · Frontiers in Immunology · doi:10.3389/fimmu.2024.1421854 · Cited by 96
Adipose-Derived Mesenchymal Stromal Cells in Basic Research and Clinical Applications
Czerwiec, K., Zawrzykraj, M., Deptuła, M., Skoniecka, A., Tymińska, A., Zieliński, J., Kosiński, A., & Pikuła, M. (2023) · International Journal of Molecular Sciences · doi:10.3390/ijms24043888 · Cited by 80
Wan, X., Chen, S., Yan, F., Zuo, W., Cui, J., & Xie, S. (2020) · Journal of Cellular Physiology · doi:10.1002/jcp.29706 · Cited by 78
Niu, Q., Wang, T., Wang, Z., Wang, F., Huang, D., Sun, H., & Liu, H. (2022) · Adipocyte · doi:10.1080/21623945.2022.2098583 · Cited by 70
Bazzoni, R., Kamga, P. T., Tanasi, I., & Krampera, M. (2020) · Frontiers in Cell and Developmental Biology · doi:10.3389/fcell.2020.596079 · Cited by 68
Clua, L., Suau, R., Vañó‐Segarra, I., Ginés, I., Serena, C., & Manyé, J. (2024) · Clinical and Translational Medicine · doi:10.1002/ctm2.70075 · Cited by 78
Tsai, H., Wu, Y., Liu, X., Xu, Z., Liu, L., Wang, C., Zhang, H., Huang, Y., Wang, L., Zhang, W., et al. (2021) · Advanced Science · doi:10.1002/advs.202102634 · Cited by 68
Extracellular Vesicles in Tissue Engineering: Biology and Engineered Strategy
Pan, Z., Sun, W., Chen, Y., Tang, H., Lin, W., Chen, J., & Chen, C. (2022) · Advanced Healthcare Materials · doi:10.1002/adhm.202201384 · Cited by 69
Liu, X., Wei, Q., Lu, L., Cui, S., Ma, K., Zhang, W., Ma, F., Li, H., Fu, X., & Zhang, C. (2023) · Frontiers in Immunology · doi:10.3389/fimmu.2023.1094685 · Cited by 70
Yang, C., Sun, J.-M., Tian, Y., Li, H., Zhang, L., Yang, J., Wang, J., Zhang, J., Yan, S., & Xu, D. (2021) · Frontiers in Immunology · doi:10.3389/fimmu.2021.714832 · Cited by 60
Liu, H., Chen, Y., Yin, G., & Xie, Q. (2021) · Life Sciences · doi:10.1016/j.lfs.2021.119458 · Cited by 56
Zhou, Z., Bao, J.-P., Peng, X., Gao, J., Cabral, V. L. F., Zhang, C., Sun, R., Kun-Wang, & Wu, X. (2021) · Acta Biomaterialia · doi:10.1016/j.actbio.2021.11.044 · Cited by 56
Padinharayil, H., Varghese, J., Wilson, C. M., & George, A. (2024) · Life Sciences · doi:10.1016/j.lfs.2024.122542 · Cited by 58
Stem Cell Therapy in Inflammatory Bowel Disease: A Review of Achievements and Challenges
Tian, C., Zhang, Y., Yang, M., Xu, H., Zhu, M., Yao, J., Wang, L., Liang, Y., & Li, D. (2023) · Journal of Inflammation Research · doi:10.2147/jir.s400447 · Cited by 56
Extracellular Vesicles as Therapeutic Tools for the Treatment of Chronic Wounds
Bray, E. R., Oropallo, A., Grande, D. A., Kirsner, R. S., & Badiavas, E. V. (2021) · Pharmaceutics · doi:10.3390/pharmaceutics13101543 · Cited by 56
Muhuri, M., Zhan, W., Maeda, Y., Li, J., Lotun, A., Chen, J., Sylvia, K., Dasgupta, I., Arjomandnejad, M., Nixon, T., et al. (2021) · Frontiers in Immunology · doi:10.3389/fimmu.2021.674242 · Cited by 50
Therapeutic role of mesenchymal stem cell-derived exosomes in respiratory disease
Zargar, M. J., Kaviani, S., Vasei, M., Zomorrod, M. S., Keshel, S. H., & Soleimani, M. (2022) · Stem Cell Research & Therapy · doi:10.1186/s13287-022-02866-4 · Cited by 49
Mesenchymal Stromal Cells as a Driver of Inflammaging
Lyamina, S., Baranovskii, D., Kozhevnikova, E., Иванова, Т. Б., Валерьевич, К. С., Sadekov, T. S., Klabukov, I., Maev, I. V., & Govorun, V. M. (2023) · International Journal of Molecular Sciences · doi:10.3390/ijms24076372 · Cited by 52
Torres Crigna, A., Uhlig, S., Elvers-Hornung, S., Klüter, H., & Bieback, K. (2020) · Cells · doi:10.3390/cells9112419 · Cited by 46
Pharoun, J., Berro, J., Sobh, J., Abou-Younes, M.-M., Nasr, L., Majed, A., Khalil, A., Joseph, J., Stephan, & Faour, W. H. (2024) · European Journal of Pharmacology · doi:10.1016/j.ejphar.2024.176719 · Cited by 55
Gomzikova, M. O., Аймалетдинов, А. М., Bondar, O. V., Старостина, И. Г., Gorshkova, N. V., Neustroeva, O., Kletukhina, S. K., Kurbangaleeva, S. V., Vorobev, V. V., Garanina, E. E., et al. (2020) · Scientific Reports · doi:10.1038/s41598-020-67563-9 · Cited by 45
Ciciarello, M., Corradi, G., Loscocco, F., Visani, G., Monaco, F., Cavo, M., Curti, A., & Isidori, A. (2019) · Frontiers in Oncology · doi:10.3389/fonc.2019.01135 · Cited by 46
Mesenchymal stem cells and oncolytic viruses: joining forces against cancer
Moreno, R. (2021) · Journal for ImmunoTherapy of Cancer · doi:10.1136/jitc-2020-001684 · Cited by 47
Grieco, G. E., Fignani, D., Formichi, C., Nigi, L., Licata, G., Maccora, C., Brusco, N., Sebastiani, G., & Dotta, F. (2021) · Frontiers in Immunology · doi:10.3389/fimmu.2021.682948 · Cited by 46
Immunomodulatory and Regenerative Effects of MSC-Derived Extracellular Vesicles to Treat Acute GVHD
Fujii, S., & Miura, Y. (2022) · Stem Cells · doi:10.1093/stmcls/sxac057 · Cited by 47
CCL21/CCR7 axis as a therapeutic target for autoimmune diseases
Han, L., & Zhang, L. (2023) · International Immunopharmacology · doi:10.1016/j.intimp.2023.110431 · Cited by 43
Defining tropism and activity of natural and engineered extracellular vesicles
Choi, W., Park, D. J., & Eliceiri, B. P. (2024) · Frontiers in Immunology · doi:10.3389/fimmu.2024.1363185 · Cited by 51
Calcat-i-Cervera, S., Sanz‐Nogués, C., & O’Brien, T. (2021) · Frontiers in Medicine · doi:10.3389/fmed.2021.728496 · Cited by 42
Exosome derived from stem cell: A promising therapeutics for wound healing
Lv, H., Liu, H., Sun, T., Wang, H., Zhang, X., & Xu, W. (2022) · Frontiers in Pharmacology · doi:10.3389/fphar.2022.957771 · Cited by 42
Zhang, E., Phan, P., & Zhao, Z. (2022) · Acta Pharmaceutica Sinica B · doi:10.1016/j.apsb.2022.08.020 · Cited by 42
Martin-Rufino, J. D., Espinosa‐Lara, N., Osugui, L., & Sanchez-Guijo, F. M. (2019) · Frontiers in Bioengineering and Biotechnology · doi:10.3389/fbioe.2019.00308 · Cited by 44
Extracellular Vesicles in Musculoskeletal Pathologies and Regeneration
Herrmann, M., Diederichs, S., Melnik, S., Riegger, J., Trivanović, D. I., Li, S., Jenei‐Lanzl, Z., Brenner, R. E., Huber-Lang, M. S., Zaucke, F., et al. (2021) · Frontiers in Bioengineering and Biotechnology · doi:10.3389/fbioe.2020.624096 · Cited by 41
Esmaeili, A., Hosseini, S., & Eslaminejad, M. B. (2020) · Cellular and Molecular Life Sciences · doi:10.1007/s00018-020-03585-w · Cited by 40
Peng, Y., Wu, Z., Xu, Z., Fang, S., Chen, D., Zhang, H., Liu, X., He, B., Chen, D., Akdiş, C. A., et al. (2022) · European Journal of Immunology · doi:10.1002/eji.202149497 · Cited by 43
Mesenchymal stromal cell secretome for traumatic brain injury: Focus on immunomodulatory action
Pischiutta, F., Caruso, E., Cavaleiro, H., Salgado, A. J., Loane, D. J., & Zanier, E. R. (2022) · Experimental Neurology · doi:10.1016/j.expneurol.2022.114199 · Cited by 43
Kandeel, M. K., Morsy, M. A., Alkhodair, K. M., & Alhojaily, S. (2023) · Biomolecules · doi:10.3390/biom13081250 · Cited by 40
Han, H., Chen, B., Yang, L., Wang, Y., Xing, L., Wang, H., Zhou, T., & Jiang, H. (2023) · Journal of Controlled Release · doi:10.1016/j.jconrel.2023.12.024 · Cited by 41
Valade, G., Libert, N., Martinaud, C., Vicaut, É., Banzet, S., & Peltzer, J. (2021) · Frontiers in Immunology · doi:10.3389/fimmu.2021.749659 · Cited by 40
Use of Stem Cell Extracellular Vesicles as a “Holistic” Approach to CNS Repair
Branscome, H., Paul, S., Yin, D., El‐Hage, N., Agbottah, E. T., Zadeh, M. A., Liotta, L. A., & Kashanchi, F. (2020) · Frontiers in Cell and Developmental Biology · doi:10.3389/fcell.2020.00455 · Cited by 37
Wu, Y., Zhang, Z., Li, J., Zhong, H., Yuan, R., Deng, Z., & Wu, X. (2021) · Stem Cell Reviews and Reports · doi:10.1007/s12015-021-10311-x · Cited by 38
Guo, R., Liang, Q., He, Y., Wang, C., Jiang, J., Chen, T., Zhang, D., & Hu, K. (2022) · Cells · doi:10.3390/cells12010033 · Cited by 37
Zubair, M., Abouelnazar, F. A., Iqbal, M. A., Pan, J., Zheng, X., Chen, T., Shen, W., Yin, J., Yan, Y., Liu, P., et al. (2025) · Frontiers in Cell and Developmental Biology · doi:10.3389/fcell.2025.1563427 · Cited by 43
Crosstalk Between Mesenchymal Stromal Cells and Tumor-Associated Macrophages in Gastric Cancer
Zheng, P., & Li, W. (2020) · Frontiers in Oncology · doi:10.3389/fonc.2020.571516 · Cited by 38
Sources and Therapeutic Strategies of Mesenchymal Stem Cells in Regenerative Medicine
Kamal, M. M., Kassem, D. H., & Haider, K. H. (2022) · Springer eBooks · doi:10.1007/978-981-16-6016-0_2-1 · Cited by 36
The involving progress of MSCs based therapy in atherosclerosis
Lin, Y., Zhu, W. P., & Chen, X. (2020) · Stem Cell Research & Therapy · doi:10.1186/s13287-020-01728-1 · Cited by 38
Verma, N., Arora, S., Singh, A. K., & Kumar, A. (2025) · Targets · doi:10.3390/targets3040032 · Cited by 35
Huang, M., Peng, X., Yang, L., Yang, S., Li, X., Tang, S., Li, B., Jin, H., Wu, B., Liu, J., et al. (2020) · Cancer Letters · doi:10.1016/j.canlet.2020.11.005 · Cited by 35
Zhang, B., Zhao, M., & Lu, Q. (2021) · Frontiers in Immunology · doi:10.3389/fimmu.2020.575712 · Cited by 35
Nazari‐Shafti, T. Z., Neuber, S., Duran, A. G., Exarchos, V., Beez, C. M., Meýborg, H., Krüger, K., Wolint, P., Buschmann, J., Böni, R., et al. (2020) · Biomolecules · doi:10.3390/biom10091353 · Cited by 34
Bryk, M., Karnas, E., Mlost, J., Zuba‐Surma, E. K., & Starowicz, K. (2021) · British Journal of Pharmacology · doi:10.1111/bph.15569 · Cited by 34
The Role of Extracellular Vesicles in Systemic Lupus Erythematosus
Zheng, C., Xie, L., Qin, H., Liu, X., Chen, X., Lv, F., Wang, L., Zhu, X., & Xu, J. (2022) · Frontiers in Cell and Developmental Biology · doi:10.3389/fcell.2022.835566 · Cited by 33
Pierce, L. M., & Kurata, W. E. (2021) · Frontiers in Cell and Developmental Biology · doi:10.3389/fcell.2021.676356 · Cited by 33
Mesenchymal Stem Cell-derived Exosomes: Novel Therapeutic Approach for Inflammatory Bowel Diseases
Tian, C., Yang, M., Xu, H., Zhu, M., Zhang, Y., Yao, J., Wang, L., Liang, Y., & Li, D. (2023) · Stem Cells International · doi:10.1155/2023/4245704 · Cited by 34
Das, D. M., & Kale, V. P. (2020) · European Journal of Cell Biology · doi:10.1016/j.ejcb.2020.151125 · Cited by 32
Wang, M., Zhao, N., Wang, C., Jin, Z., & Zhang, L. (2023) · Allergy · doi:10.1111/all.15729 · Cited by 34
Malvicini, R., Lazzari, G. D., Tolomeo, A. M., Santa‐Cruz, D., Ullah, M., Cirillo, C., Grumati, P., Pacienza, N., Muraca, M., & Yannarelli, G. (2023) · Cytotherapy · doi:10.1016/j.jcyt.2023.11.001 · Cited by 31
Reis, M., Willis, G. R., Fernandez‐Gonzalez, A., Yeung, V., Taglauer, E. S., Magaletta, M. E., Parsons, T. J., Derr, A. G., Liu, X., Maehr, R., et al. (2021) · Frontiers in Immunology · doi:10.3389/fimmu.2021.640595 · Cited by 30
Self-citationLi, J.-K., Yang, C., Su, Y., Luo, J., Luo, M.-H., Huang, D.-L., Tu, G.-W., & Luo, Z. (2021) · Frontiers in Immunology · doi:10.3389/fimmu.2021.684496 · Cited by 33
Extracellular vesicles-based drug delivery systems for cancer immunotherapy
Yong, T., Li, X., Wei, Z., Gan, L., & Yang, X. (2020) · Journal of Controlled Release · doi:10.1016/j.jconrel.2020.09.028 · Cited by 30
Li, X., Zhang, X., Liu, Y., Pan, R., Liang, X., Huang, L., & Yang, C. (2021) · Tissue and Cell · doi:10.1016/j.tice.2021.101651 · Cited by 30
Pant, T., Juric, M., Bosnjak, Z. J., & Dhanasekaran, A. (2021) · Frontiers in Cardiovascular Medicine · doi:10.3389/fcvm.2021.737512 · Cited by 30
Xu, W., Zhang, Z., Yao, L., Xue, B., Xi, H., Wang, X., & Sun, S. (2022) · Frontiers in Genetics · doi:10.3389/fgene.2022.939751 · Cited by 30
Self-citationYudintceva, N. M., Mikhailova, N., Fedorov, V., Samochernykh, K. A., Vinogradova, T. I., Muraviov, A. N., & Shevtsov, M. A. (2022) · Bioengineering · doi:10.3390/bioengineering9110662 · Cited by 30
Gupta, R., Gupta, S. V., Gupta, P., Nussler, A. K., & Kumar, A. (2023) · Journal of Functional Biomaterials · doi:10.3390/jfb14110540 · Cited by 29
Pourgholaminejad, A., Pahlavanneshan, S., & Basiri, M. (2021) · Scandinavian Journal of Immunology · doi:10.1111/sji.13131 · Cited by 32
Martínez-Arroyo, O., Ortega, A., Forner, M. J., & Cortés, R. (2022) · Pharmaceutics · doi:10.3390/pharmaceutics14040733 · Cited by 31
Mallis, P., Michalopoulos, Ε., Chatzistamatiou, T. K., & Stavropoulos‐Giokas, C. (2021) · Exploration of Immunology · doi:10.37349/ei.2021.00010 · Cited by 28
Ramírez-Bajo, M. J., Rovira, J., Lazo-Rodríguez, M., Bañón-Maneus, E., Tubita, V., Moya‐Rull, D., Hierro-Garcia, N., Ventura‐Aguiar, P., Oppenheimer, F., Campistol, J. M., et al. (2020) · Frontiers in Cell and Developmental Biology · doi:10.3389/fcell.2020.00010 · Cited by 27
To, K., Romain, K. A., Mak, C. C. H., Kamaraj, A., HENSON, F. M. D., & Khan, W. S. (2020) · Frontiers in Bioengineering and Biotechnology · doi:10.3389/fbioe.2020.00580 · Cited by 27
Metadata
- Authors
- Reis, M., Mavin, E., Nicholson, L., Green, K., Dickinson, A. M., & Wang, X.-N.
- Affiliations
- Newcastle University (GB)
- Venue
- Frontiers in Immunology
- Publisher
- Frontiers Media SA
- Published
- 2018-11-09
- Volume
- 9
- Pages
- 2538-2538
- ISSN
- 1664-3224 (ISSN-L)
- PMC
- PMC6237916
- OpenAlex
- W2896358322
- Cited by
- 286
- References
- 63
- Citations by year
- 2026: 26 · 2025: 37 · 2024: 36 · 2023: 47 · 2022: 41 · 2021: 49 · 2020: 33 · 2019: 16
- FWCI
- 8.72
- Type
- journal article
- Language
- en
- Open access
- gold
- doi.org
- Locations
- Frontiers in Immunology (publishedVersion, cc-by)
- Europe PMC (PubMed Central) (publishedVersion, cc-by)
- PubMed Central (publishedVersion, cc-by)
- PubMed (publishedVersion)
- DOAJ (DOAJ: Directory of Open Access Journals) (submittedVersion, cc-by-sa)
- Newcastle University ePrints (Newcastle Univesity) (cc-by)
- Funders
- National Institute for Health and Care Research
- Newcastle University
- European Commission (315963)
- Versus Arthritis (19429)
- NIHR Newcastle Biomedical Research Centre
- FP7 People: Marie-Curie Actions
- Topics
- Life Sciences › Biochemistry, Genetics and Molecular Biology › Molecular Biology › Extracellular vesicles in disease
- Life Sciences › Biochemistry, Genetics and Molecular Biology › Cell Biology › Mesenchymal stem cell research
- Life Sciences › Immunology and Microbiology › Immunology › Immunotherapy and Immune Responses
- Keywords
- mesenchymal stem cells, extracellular vesicles, dendritic cell maturation, immunomodulation, microRNA, miR-21-5p, CCR7, CCL21, dendritic cell migration, antigen uptake, inflammatory cytokines, TGF-beta, paracrine signaling, conditioned medium, allogeneic T cell proliferation
- MeSH terms
- Extracellular Vesicles, Cell Differentiation, Cells, Cultured, Dendritic Cells, Graft vs Host Disease, Humans, Inflammation, Interleukin-6, Cytokines, Transforming Growth Factor beta, Interleukin-12, MicroRNAs, Cell Proliferation, Receptors, CCR7, Chemokine CCL21, Mesenchymal Stem Cells
About these checks
Registry, retraction, Cites and statistics results are computed, not judged, with one exception: a printed reference that no index lists is read once by a model before it counts as a citation error. Claims are extracted by a model and kept only when their quote appears verbatim in the text; each cited source is then checked, with a model’s help, for whether it says what the claim relies on. Those verdicts can be wrong — read the claim’s quote and the cited source before relying on one.
Statistics and arithmetic are recomputed, not judged.
Confidence bands are shown only for fields calibrated on our annotated test set. None is calibrated yet, so no band is shown.
What counts as a claim ›How we measure confidence ›How we check this ›
Are you an author, or do you see a problem with this page? Request a review
