

The DOI matches its Crossref record.
Germ‐free mice exhibit mast cells with impaired functionality and gut homing and do not develop food allergy
Published version of a preprint
Overview
The claims and statistics of this paper haven’t been checked yet.
Run the check — free, no account needed. It reads the open-access text and checks the sources it cites.
Integrity signals
Registry
Cites
Statistics
Figures
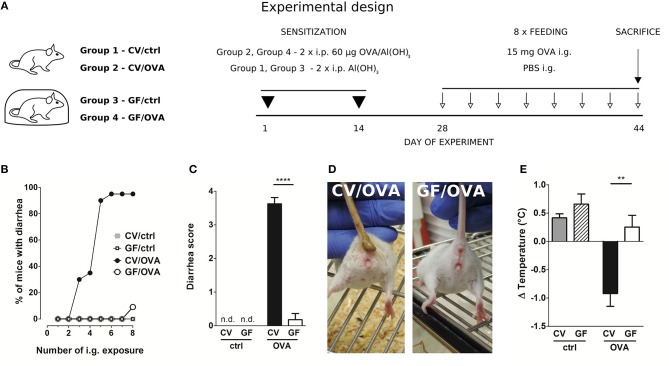
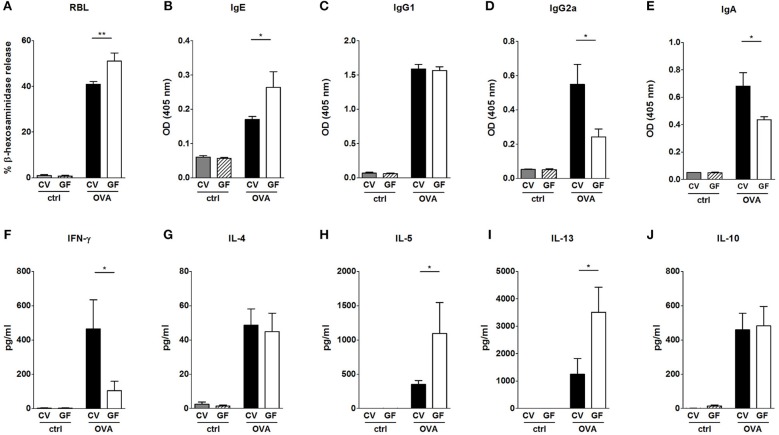
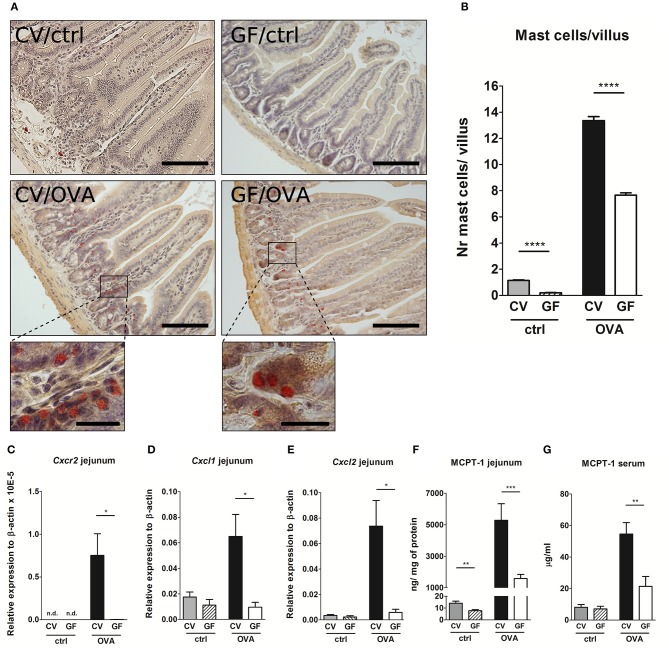
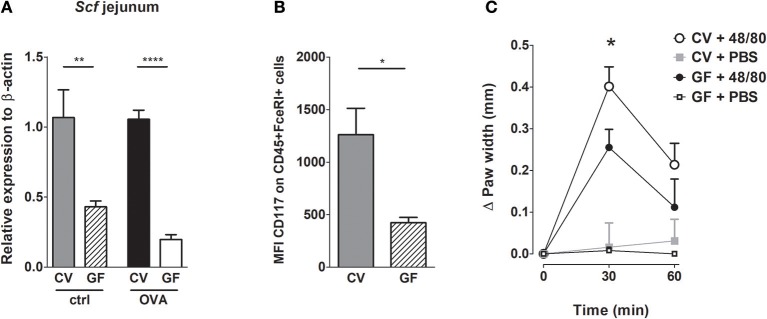
Verification
Claims the paper makes
The claims and statistics of this paper haven’t been checked yet.
Run the check — free, no account needed. It reads the open-access text and checks the sources it cites.
Claims other papers make about this one
Each is checked against this paper’s own text: does it say what the citing paper says it does?
In the citing paper
“Supporting this notion, mast cells are strongly reduced in the intestinal mucosa of germ‐free mice. 82”
From Mast cell ontogeny: From fetal development to life‐long health and disease (2023) · cites this paper as [82]
In the citing paper
“In keeping with the hygiene hypothesis, germ‐free mice have reduced mast cell numbers in the intestinal mucosa and are resistant to food allergy models. 82”
From Mast cell ontogeny: From fetal development to life‐long health and disease (2023) · cites this paper as [82]
Self-check
Percentages, sums and reported differences re-computed from the paper’s own numbers.
The self-check needs the paper’s full text.
Citations
Cites
No references could be resolved yet.
Research works printed but not linked: 53
- Yu, 2016, Food allergy: immune mechanisms, diagnosis and immunotherapy, Nat Rev Immunol., 16, 751, 10.1038/nri.2016.111 · DOI
- Lee, 2016, IL-25 and CD4+ TH2 cells enhance type 2 innate lymphoid cell-derived IL-13 production, which promotes IgE-mediated experimental food allergy, J Allergy Clin Immunol., 137, 1216, 10.1016/j.jaci.2015.09.019 · DOI
- Berin, 2013, Mucosal immunology of food allergy, Curr Biol., 23, R389, 10.1016/j.cub.2013.02.043 · DOI
- Kraneveld, 2012, The two faces of mast cells in food allergy and allergic asthma: the possible concept of Yin Yang, Biochim Biophys Acta Mol Basis Dis., 1822, 93, 10.1016/j.bbadis.2011.06.013 · DOI
- Liu, 2010, National prevalence and risk factors for food allergy and relationship to asthma: results from the national health and nutrition examination survey 2005-2006, J Allergy Clin Immunol., 126, 798, 10.1016/j.jaci.2010.07.026 · DOI
- Brough, 2014, IL-9 is a key component of memory TH cell peanut-specific responses from children with peanut allergy, J Allergy Clin Immunol., 134, 1329, 10.1016/j.jaci.2014.06.032 · DOI
- Okada, 2010, The ‘hygiene hypothesis’ for autoimmune and allergic diseases: an update, Clin Exp Immunol., 160, 1, 10.1111/j.1365-2249.2010.04139.x · DOI
- Liu, 2015, Revisiting the hygiene hypothesis for allergy and asthma, J Allergy Clin Immunol., 136, 860, 10.1016/j.jaci.2015.08.012 · DOI
- Morin, 2012, Delayed bacterial colonization of the gut alters the host immune response to oral sensitization against cow's milk proteins, Mol Nutr Food Res., 56, 1838, 10.1002/mnfr.201200412 · DOI
- Stefka, 2014, Commensal bacteria protect against food allergen sensitization, Proc Natl Acad Sci USA., 111, 13145, 10.1073/pnas.1412008111 · DOI
- Schwarzer, 2013, Neonatal colonization of germ-free mice with Bifidobacterium longum prevents allergic sensitization to major birch pollen allergen Bet v 1, Vaccine, 31, 5405, 10.1016/j.vaccine.2013.09.014 · DOI
- Kozakova, 2016, Colonization of germ-free mice with a mixture of three lactobacillus strains enhances the integrity of gut mucosa and ameliorates allergic sensitization, Cell Mol Immunol., 13, 251, 10.1038/cmi.2015.09 · DOI
- Martino, 2016, Nomadic lifestyle of Lactobacillus plantarum revealed by comparative genomics of 54 strains isolated from different habitats, Environ Microbiol., 18, 4974, 10.1111/1462-2920.13455 · DOI
- Meijerink, 2012, Immunomodulatory effects of potential probiotics in a mouse peanut sensitization model, FEMS Immunol Med Microbiol., 65, 488, 10.1111/j.1574-695X.2012.00981.x · DOI
- Górska, 2014, Distinct immunomodulation of bone marrow-derived dendritic cell responses to Lactobacillus plantarum WCFS1 by two different polysaccharides isolated from Lactobacillus rhamnosus LOCK 0900, Appl Environ Microbiol., 80, 6506, 10.1128/AEM.02104-14 · DOI
- van den Nieuwboer, 2016, Lactobacillus plantarum WCFS1 and its host interaction: a dozen years after the genome, Microb. Biotechnol., 9, 452, 10.1111/1751-7915.12368 · DOI
- Smelt, 2012, L. plantarum, L. salivarius, and L. lactis attenuate Th2 responses and increase Treg frequencies in healthy mice in a strain dependent manner, PLoS ONE, 7, e47244, 10.1371/journal.pone.0047244 · DOI
- Lantz, 1998, Role for interleukin-3 in mast cell and basophil development and immunity to parasites, Nature, 392, 90, 10.1038/32190 · DOI
- Pennock, 2004, In vivo exit of c-kit + / CD49d hi /b7+ mucosal mast cell precursors from the bone marrow following infection with the intestinal nematode Trichinella spiralis, Cell, 103, 2655, 10.1182/blood-2003-09-3146 · DOI
- Olivera, 2018, Mast cells signal their importance in health and disease, J Allergy Clin Immunol., 142, 381, 10.1016/j.jaci.2018.01.034 · DOI
- Kurashima, 2014, New era for mucosal mast cells: their roles in inflammation, allergic immune responses and adjuvant development, Exp Mol Med., 46, e83, 10.1038/emm.2014.7 · DOI
- Reber, 2015, Potential effector and immunoregulatory functions of mast cells in mucosal immunity, Mucosal Immunol., 8, 444, 10.1038/mi.2014.131 · DOI
- Kunii, 2011, Commensal bacteria promote migration of mast cells into the intestine, Immunobiology, 216, 692, 10.1016/j.imbio.2010.10.007 · DOI
- Halova, 2012, Mast cell chemotaxis chemoattractants and signaling pathways, Front Immunol., 3, 119, 10.3389/fimmu.2012.00119 · DOI
- Wang, 2016, Skin microbiome promotes mast cell maturation by triggering stem cell factor (SCF) production in keratinocytes, J Allergy Clin Immunol., 139, 1205, 10.1016/j.jaci.2016.09.019 · DOI · Paper page
- Guy-Grand, 1984, Gut mucosal mast cells: origin, traffic, and differentiation, J Exp Med., 160, 12, 10.1084/jem.160.1.12 · DOI
- Brandt, 2003, Mast cells are required for experimental oral allergen – induced diarrhea, J Clin Investig., 112, 1666, 10.1172/JCI19785 · DOI
- Chen, 2015, Induction of Interleukin-9-producing mucosal mast cells promotes susceptibility to IgE-mediated experimental food allergy, Immunity, 43, 788, 10.1016/j.immuni.2015.08.020 · DOI
- Balbino, 2017, Pathways of immediate hypothermia and leukocyte infiltration in an adjuvant-free mouse model of anaphylaxis, J Allergy Clin Immunol, 139, 584, 10.1016/j.jaci.2016.05.047 · DOI
- Ahrens, 2012, Intestinal mast cell levels control severity of oral antigen-induced anaphylaxis in mice, Am J Pathol., 180, 1535, 10.1016/j.ajpath.2011.12.036 · DOI
- Cahenzli, 2013, Intestinal microbial diversity during early-life colonization shapes long-term IgE levels, Cell Host Microbe, 14, 559, 10.1016/j.chom.2013.10.004 · DOI · Paper page
- Schwarzer, 2016, Lactobacillus plantarum strain maintains growth of infant mice during chronic undernutrition, Science, 351, 854, 10.1126/science.aad8588 · DOI
- Schwarzer, 2011, Neonatal colonization of mice with Lactobacillus plantarum producing the aeroallergen Bet v 1 biases towards Th1 and T-regulatory responses upon systemic sensitization, Allergy, 66, 368, 10.1111/j.1398-9995.2010.02488.x · DOI
- Šrůtková, 2011, Efficiency of PCR-based methods in discriminating Bifidobacterium longum ssp. longum and Bifidobacterium longum ssp infantis strains of human origin, J Microbiol Methods, 87, 10, 10.1016/j.mimet.2011.06.014 · DOI
- Schwarzer, 2017, Diet matters: endotoxin in the diet impacts the level of allergic sensitization in germ-free mice, PLoS ONE, 12, e0167786, 10.1371/journal.pone.0167786 · DOI
- Golias, 2012, Heat-induced structural changes affect OVA-antigen processing and reduce allergic response in mouse model of food allergy, PLoS ONE, 7, e37156, 10.1371/annotation/53227638-162d-477c-a487-ad856854d823 · DOI
- Scott, 2017, Isolation and identification of intestinal myeloid cells, Methods Mol Biol., 1559, 223, 10.1007/978-1-4939-6786-5_15 · DOI
- Livak, 2001, Analysis of relative gene expression data using real-time quantitative PCR and the 2(-Delta Delta C(T)) method, Methods, 25, 402, 10.1006/meth.2001.1262 · DOI · Paper page
- Okayama, Development, migration, and survival of mast cells, Immunol Res., 34, 97, 10.1385/IR:34:2:97 · DOI
- Chatterjea, 2012, Mast cell degranulation mediates compound 48/80-induced hyperalgesia in mice, Biochem Biophys Res Commun., 425, 237, 10.1016/j.bbrc.2012.07.074 · DOI
- Hill, 2012, Commensal bacteria–derived signals regulate basophil hematopoiesis and allergic inflammation, Nat Med., 18, 538, 10.1038/nm.2657 · DOI · Paper page
- Rodriguez, 2011, Germ-free status and altered caecal subdominant microbiota are associated with a high susceptibility to cow's milk allergy in mice, FEMS Microbiol Ecol., 76, 133, 10.1111/j.1574-6941.2010.01035.x · DOI
- Anjuère, 2004, In vivo adjuvant-induced mobilization and maturation of gut dendritic cells after oral administration of cholera toxin, J Immunol., 173, 5103, 10.4049/jimmunol.173.8.5103 · DOI
- Mattsson, 2015, Cholera toxin adjuvant promotes a balanced Th1/Th2/Th17 response independently of IL-12 and IL-17 by acting on Gsalpha in CD11b(+) DCs, Mucosal Immunol., 8, 815, 10.1038/mi.2014.111 · DOI
- Osterfeld, 2010, Differential roles for the IL-9/IL-9 receptor ??-chain pathway in systemic and oral antigen-induced anaphylaxis, J Allergy Clin Immunol., 125, 469, 10.1016/j.jaci.2009.09.054 · DOI
- Yamaki, 2012, Preventive and therapeutic effects of rapamycin, a mammalian target of rapamycin inhibitor, on food allergy in mice, Allergy, 67, 1259, 10.1111/all.12000 · DOI
- Gupta, 2018, Maillard reaction in food allergy: pros and cons, Crit Rev Food Sci Nutr., 58, 208, 10.1080/10408398.2016 · DOI
- Smith, 2017, Do advanced glycation end-products cause food allergy?, Curr Opin Allergy Clin Immunol., 17, 325, 10.1097/ACI.0000000000000385 · DOI
- Meslin, 1990, Histamine and mast cell distribution in the intestinal wall of the germ free and conventional rats. Influence of the mode of sterilization of the diet, Agents Actions, 29, 131, 10.1007/BF01966437 · DOI
- Dahlin, 2015, Mast cell progenitors: origin, development and migration to tissues, Mol Immunol., 63, 9, 10.1016/j.molimm.2014.01.018 · DOI · Paper page
- Rigaux, 2009, Immunomodulatory properties of Lactobacillus plantarum and its use as a recombinant vaccine against mite allergy, Allergy, 64, 406, 10.1111/j.1398-9995.2008.01825.x · DOI
- Schabussova, 2011, Distinctive anti-allergy properties of two probiotic bacterial strains in a mouse model of allergic poly-sensitization, Vaccine, 29, 1981, 10.1016/j.vaccine.2010.12.101 · DOI
- Srutkova, 2015, Bifidobacterium longum CCM 7952 promotes epithelial barrier function and prevents acute DSS-induced colitis in strictly strain-specific manner, PLoS ONE, 10, e0134050, 10.1371/journal.pone.0134050 · DOI
Cited by
Sorted by citations
Advances and novel developments in mechanisms of allergic inflammation
Han, X., Krempski, J. W., & Nadeau, K. (2020) · Allergy · doi:10.1111/all.14632 · Cited by 129
Can we ‘seize’ the gut microbiota to treat epilepsy?
De Caro, C., Iannone, L. F., Citraro, R., Striano, P., De Sarro, G., Constanti, A., Cryan, J. F., & Russo, E. (2019) · Neuroscience & Biobehavioral Reviews · doi:10.1016/j.neubiorev.2019.10.002 · Cited by 110
Robles, A., Perez Ingles, D., Myneedu, K., Deoker, A., Sarosiek, I., Zuckerman, M. J., Schmulson, M. J., & Bashashati, M. (2019) · Neurogastroenterology & Motility · doi:10.1111/nmo.13718 · Cited by 65
Mast cell ontogeny: From fetal development to life‐long health and disease
Chia, S. L., Kapoor, S., Carvalho, C., Bajénoff, M., & Gentek, R. (2023) · Immunological Reviews · doi:10.1111/imr.13191 · Cited by 60
Metadata
- Authors
- Schwarzer, M., Hermanova, P., Srutkova, D., Golias, J., Hudcovic, T., Zwicker, C., Sinkora, M., Akgün, J., Wiedermann, U., Tuckova, L., Kozakova, H., & Schabussova, I.
- Venue
- Frontiers in Immunology
- Publisher
- Frontiers Media SA
- Published
- 2019-02-12
- Volume
- 10
- ISSN
- 1664-3224
- PMC
- PMC6379318
- Cited by
- 62
- References
- 0
- Funders
- Grantová Agentura Ceské Republiky (17-09869S, 18-02993S, 18-07015Y)
- Austrian Science Fund (SFB F46, MCCA)
- OeAD-GmbH (CZ 16/2012, CZ 15/2015, CZ 16/2016)
- Ministerstvo Školství, Mládeže a Telovýchovy (7AMB12AT020, 7AMB15AT025)
About these checks
Registry, retraction, Cites and statistics results are computed, not judged, with one exception: a printed reference that no index lists is read once by a model before it counts as a citation error. Claims are extracted by a model and kept only when their quote appears verbatim in the text; each cited source is then checked, with a model’s help, for whether it says what the claim relies on. Those verdicts can be wrong — read the claim’s quote and the cited source before relying on one.
Statistics and arithmetic are recomputed, not judged.
Confidence bands are shown only for fields calibrated on our annotated test set. None is calibrated yet, so no band is shown.
What counts as a claim ›How we measure confidence ›How we check this ›
Are you an author, or do you see a problem with this page? Request a review
