

The DOI matches its Crossref record; 46 of the 46 references it cites were found in a registry or an index.
Bacterial Community Associated with Healthy and Diseased Pacific White Shrimp (Litopenaeus vannamei) Larvae and Rearing Water across Different Growth Stages
Open accessAbstract
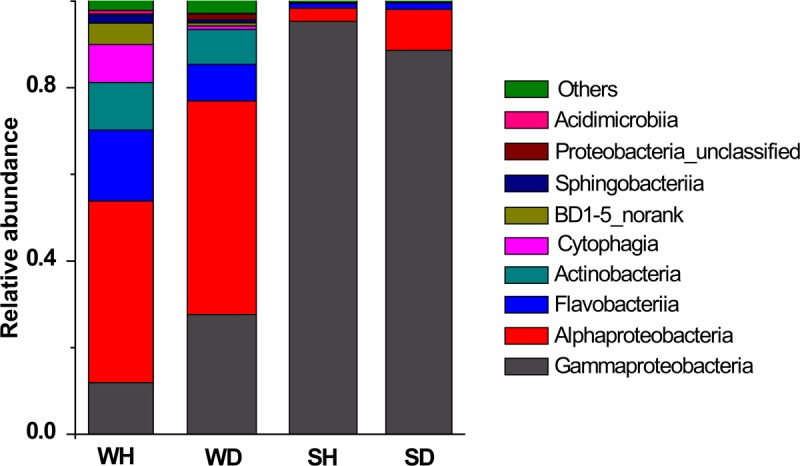
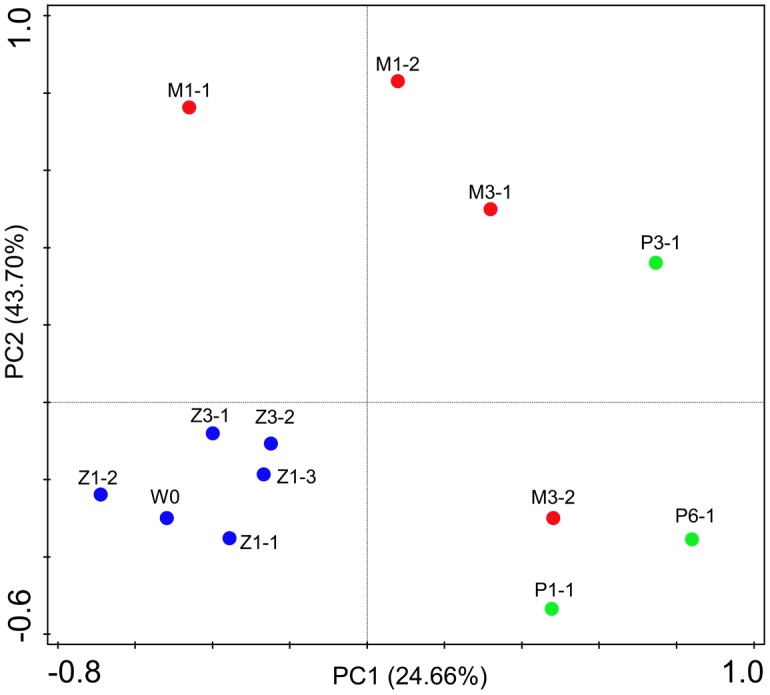
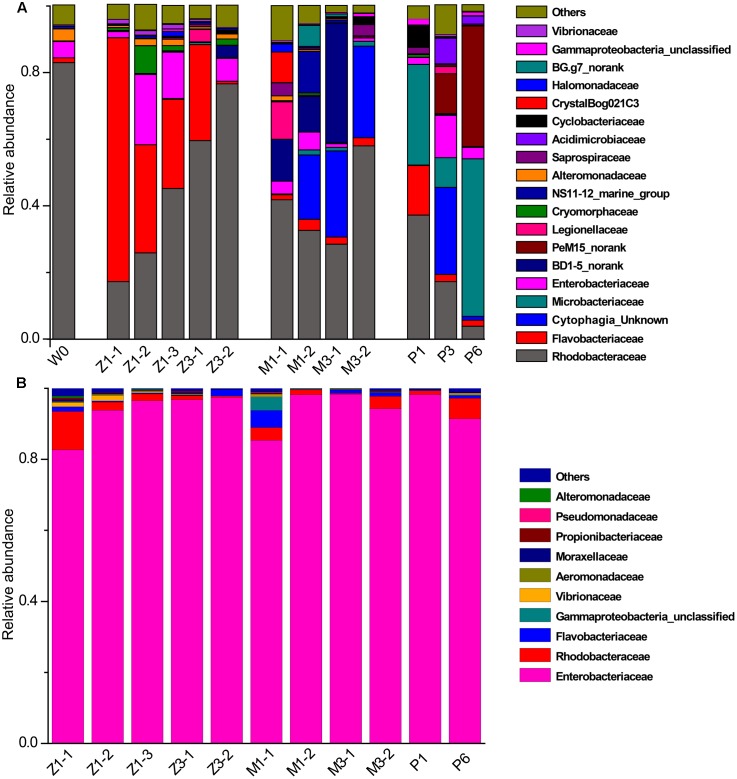
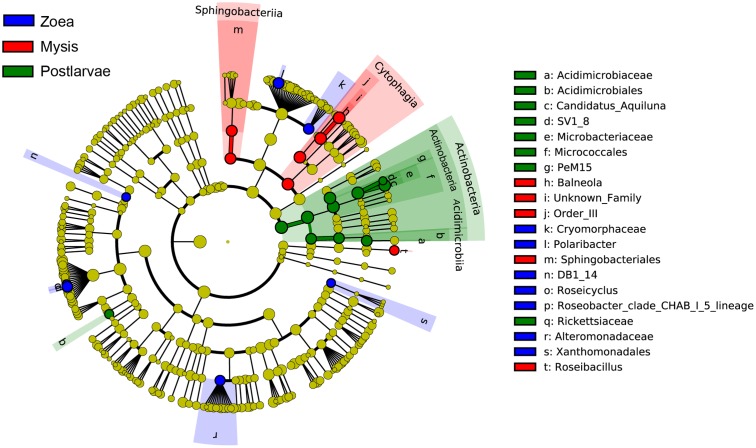
Bacterial communities are called another “organ” for aquatic animals and their important influence on the health of host has drawn increasing attention. Thus, it is important to study the relationships between aquatic animals and bacterial communities. Here, bacterial communities associated with Litopenaeus vannamei larvae at different healthy statuses (diseased and healthy) and growth stages (i.e. zoea, mysis and early postlarvae periods) were examined using 454-pyrosequencing of the 16S rRNA gene. Bacterial communities with significant difference were observed between healthy and diseased rearing water, and several bacterial groups, such as genera Nautella and Kordiimonas could also distinguish healthy and diseased shrimp. Rhodobacteraceae was widely distributed in rearing water at all growth stages but there were several stage-specific groups, indicating that bacterial members in rearing water assembled into distinct communities throughout the larval development. However, Gammaproteobacteria, mainly family Enterobacteriaceae, was the most abundant group (accounting for more than 85%) in shrimp larvae at all growth stages. This study compared bacterial communities associated with healthy and diseased L. vannamei larvae and rearing water, and identified several health- and growth stage-specific bacterial groups, which might be provided as indicators for monitoring the healthy status of shrimp larvae in hatchery.
Overview
The claims and statistics of this paper haven’t been checked yet.
Run the check — free, no account needed. It reads the open-access text and checks the sources it cites.
Integrity signals
Registry
Cites
Statistics
Figures
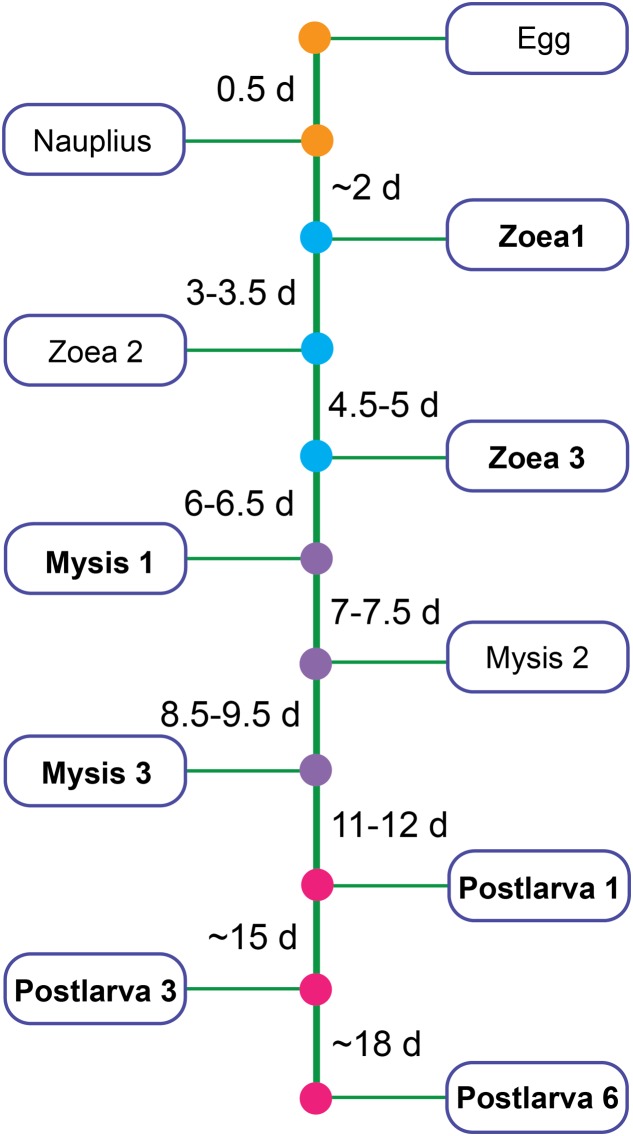
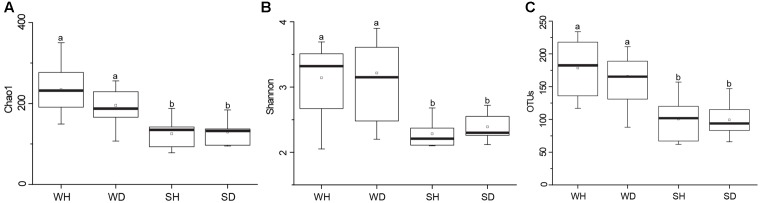
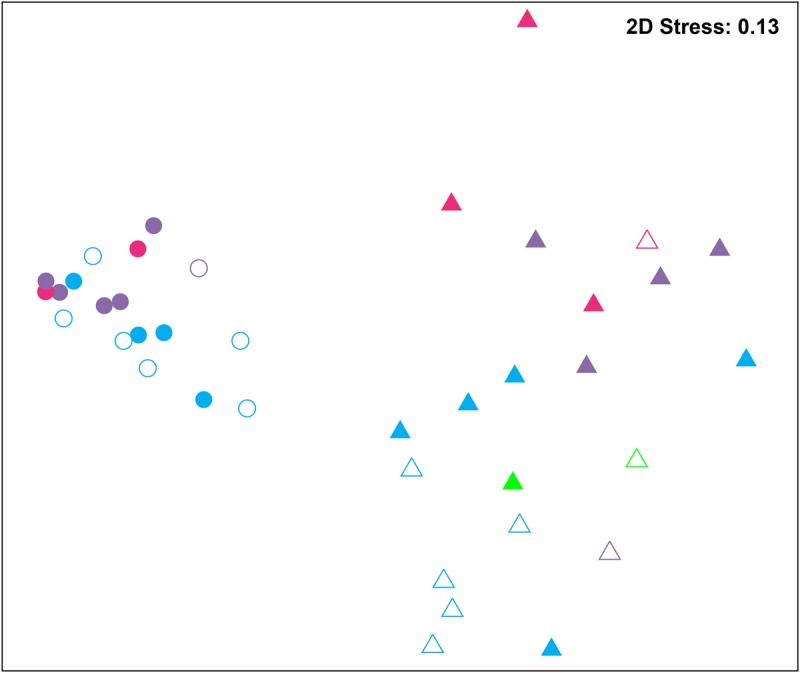
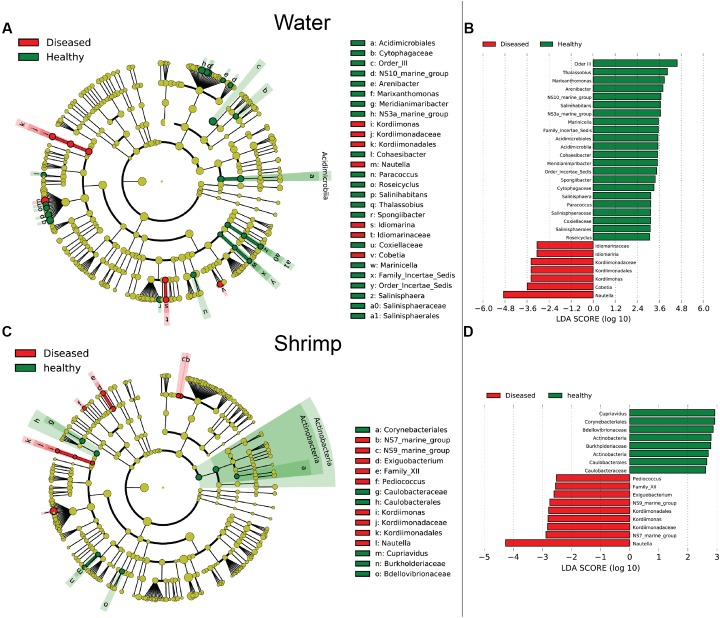
Verification
Claims the paper makes
The claims and statistics of this paper haven’t been checked yet.
Run the check — free, no account needed. It reads the open-access text and checks the sources it cites.
Claims other papers make about this one
Each is checked against this paper’s own text: does it say what the citing paper says it does?
In the citing paper
“These classes have been identified in larvae of the Pacific white shrimp (Litopenaeus vannamei) at early developmental stage (Pangastuti et al., 2009; Zheng et al., 2017) but also in the intestines of adult black tiger shrimps (Penaeus monodon) (Rungrassamee et al., 2013).”
From Potential lineage transmission within the active microbiota of the eggs and the nauplii of the shrimp Litopenaeus stylirostris : possible influence of the rearing water and more (2021) · cites this paper as Zheng et al., 2017
Self-check
Percentages, sums and reported differences re-computed from the paper’s own numbers.
The self-check needs the paper’s full text.
Citations
Cites
QIIME allows analysis of high-throughput community sequencing data
Caporaso, J. G., Kuczynski, J., Stombaugh, J., Bittinger, K., Bushman, F. D., Costello, E. K., Fierer, N., Peña, A. G., Goodrich, J. K., Gordon, J. I., et al. (2010) · Nature Methods · doi:10.1038/nmeth.f.303 · Cited by 34,887
Schloss, P. D., Westcott, S. L., Ryabin, T., Hall, J. R., Hartmann, M., Hollister, E. B., Lesniewski, R. A., Oakley, B. B., Parks, D. H., Robinson, C. J., et al. (2009) · Applied and Environmental Microbiology · doi:10.1128/aem.01541-09 · Cited by 19,549
UPARSE: highly accurate OTU sequences from microbial amplicon reads
Edgar, R. C. (2013) · Nature Methods · doi:10.1038/nmeth.2604 · Cited by 16,770
Metagenomic biomarker discovery and explanation
Segata, N., Izard, J., Waldron, L., Gevers, D., Miropolsky, L., Garrett, W. S., & Huttenhower, C. (2011) · Genome Biology · doi:10.1186/gb-2011-12-6-r60 · Cited by 16,192
Ecological Diversity and Its Measurement
Magurran, A. E. (1988) · Springer eBooks · doi:10.1007/978-94-015-7358-0 · Cited by 11,493
THE POPULATION FREQUENCIES OF SPECIES AND THE ESTIMATION OF POPULATION PARAMETERS
Good, I. J. (1953) · Biometrika · doi:10.1093/biomet/40.3-4.237 · Cited by 3,427
The ecology of Cytophaga–Flavobacteria in aquatic environments
Kirchman, D. L. (2002) · FEMS Microbiology Ecology · doi:10.1111/j.1574-6941.2002.tb00910.x · Cited by 1,307
Estimating the Number of Species in a Stochastic Abundance Model
Chao, A., & Bunge, J. (2002) · Biometrics · doi:10.1111/j.0006-341x.2002.00531.x · Cited by 587
rrnDB: documenting the number of rRNA and tRNA genes in bacteria and archaea
Lee, Z. M.-P., Bussema, C., & Schmidt, T. M. (2008) · Nucleic Acids Research · doi:10.1093/nar/gkn689 · Cited by 453
Intestinal microflora of fish larvae and fry
Ringø, E. (1999) · Aquaculture Research · doi:10.1046/j.1365-2109.1999.00302.x · Cited by 346
Research works printed but not linked: 1
- Clarke, 2006, PRIMER v6: User Manual/Tutorial
Cited by
Sorted by citations
Understanding the role of the shrimp gut microbiome in health and disease
Holt, C. C., Bass, D., Stentiford, G. D., & van der Giezen, M. (2020) · Journal of Invertebrate Pathology · doi:10.1016/j.jip.2020.107387 · Cited by 368
Vibrio and major commercially important vibriosis diseases in decapod crustaceans
Valente, C. D. S., & Wan, A. H. L. (2021) · Journal of Invertebrate Pathology · doi:10.1016/j.jip.2020.107527 · Cited by 335
Microbiome diversity and dysbiosis in aquaculture
Villamil, S. I., Huerlimann, R., & Jerry, D. R. (2020) · Reviews in Aquaculture · doi:10.1111/raq.12513 · Cited by 211
Aquaculture industry prospective from gut microbiome of fish and shellfish: An overview
Diwan, A. D., Harke, S. N., Gopalkrishna, & Panche, A. N. (2021) · Journal of Animal Physiology and Animal Nutrition · doi:10.1111/jpn.13619 · Cited by 157
Cornejo‐Granados, F., Gallardo-Becerra, L., Leonardo-Reza, M., Ochoa‐Romo, J. P., & Ochoa‐Leyva, A. (2018) · PeerJ · doi:10.7717/peerj.5382 · Cited by 145
Fan, J., Chen, L., Mai, G., Zhang, H., Yang, J., Deng, D., & Ma, Y. (2019) · Scientific Reports · doi:10.1038/s41598-018-37042-3 · Cited by 133
Wang, Y., Wang, K., Huang, L., Dong, P., Wang, S., Chen, H., Lu, Z., Hou, D., & Zhang, D. (2020) · Microbiome · doi:10.1186/s40168-020-00879-w · Cited by 127
Progress in the gut microbiota in exploring shrimp disease pathogenesis and incidence
Xiong, J. (2018) · Applied Microbiology and Biotechnology · doi:10.1007/s00253-018-9199-7 · Cited by 108
Host-microbiome interaction in fish and shellfish: An overview
Diwan, A. D., Harke, S. N., & Panche, A. N. (2023) · Fish and Shellfish Immunology Reports · doi:10.1016/j.fsirep.2023.100091 · Cited by 96
García-López, R., Cornejo‐Granados, F., López-Zavala, A. A., Sánchez-López, F., Cota-Huízar, A., Sotelo‐Mundo, R. R., Guerrero, A., Mendoza-Vargas, A., Gómez‐Gil, B., & Ochoa‐Leyva, A. (2020) · Microorganisms · doi:10.3390/microorganisms8010134 · Cited by 88
Pilotto, M. R., Gonçalves, A. N. A., Vieira, F. D. N., Seiffert, W. Q., Evelyne Bachère, B., Rosa, R. D., & Perazzolo, L. M. (2018) · Microorganisms · doi:10.3390/microorganisms6030083 · Cited by 77
Chen, Z., Chang, Z., Zhang, L., Jiang, Y., Ge, H., Song, X., Chen, S., Zhao, F., & Li, J. (2019) · BMC Microbiology · doi:10.1186/s12866-019-1564-x · Cited by 67
Zhang, Z., Yang, Q., Liu, H., Jin, J., Yang, Y., Zhu, X., Han, D. H., Zhou, Z., & Xie, S. (2024) · Reviews in Aquaculture · doi:10.1111/raq.12959 · Cited by 69
Alfiansah, Y. R., Peters, S., Harder, J., Hassenrück, C., & Gärdes, A. (2020) · Scientific Reports · doi:10.1038/s41598-020-68891-6 · Cited by 67
Chien, C.-C., Lin, T., Chi, C., & Liu, C. (2020) · Fish & Shellfish Immunology · doi:10.1016/j.fsi.2020.01.014 · Cited by 62
Yu, W., Wu, J., Zhang, J., Yang, W., Chen, J., & Xiong, J. (2018) · FEMS Microbiology Ecology · doi:10.1093/femsec/fiy147 · Cited by 60
Bacterial analysis in the early developmental stages of the black tiger shrimp (Penaeus monodon)
Angthong, P., Uengwetwanit, T., Arayamethakorn, S., Chaitongsakul, P., Karoonuthaisiri, N., & Rungrassamee, W. (2020) · Scientific Reports · doi:10.1038/s41598-020-61559-1 · Cited by 58
Wang, X., Liu, J., Liang, J., Sun, H., & Zhang, X. (2020) · Environmental Microbiology · doi:10.1111/1462-2920.15152 · Cited by 50
Self-citationProbiotics: Comprehensive Exploration of the Growth Promotion Mechanisms in Shrimps
Goh, J. X. H., Tan, L. T., Law, J. W., Khaw, K. Y., Zengin, G., Chan, K., Letchumanan, V., Lee, L., & Goh, B. H. (2023) · Progress In Microbes & Molecular Biology · doi:10.36877/pmmb.a0000324 · Cited by 50
Mazón‐Suástegui, J. M., Salas‐Leiva, J. S., Medina, R., Medina-García, R., & Bernal, M. R. G. (2019) · MicrobiologyOpen · doi:10.1002/mbo3.967 · Cited by 49
Vaiyapuri, M., Pailla, S., Badireddy, M. R., Pillai, D., Nagarajarao, R. C., & Mothadaka, M. P. (2021) · Aquaculture Research · doi:10.1111/are.15142 · Cited by 51
Chaiyapechara, S., Uengwetwanit, T., Arayamethakorn, S., Bunphimpapha, P., Phromson, M., Jangsutthivorawat, W., Tala, S., Karoonuthaisiri, N., & Rungrassamee, W. (2021) · Aquaculture · doi:10.1016/j.aquaculture.2021.737371 · Cited by 43
Li, B., Liu, J., Zhou, S., Fu, L., Yao, P., Chen, L., Yang, Z., Wang, X., & Zhang, X. (2019) · Marine Life Science & Technology · doi:10.1007/s42995-019-00003-4 · Cited by 43
Self-citationGaribay-Valdéz, E., Martínez‐Porchas, M., Calderón, K., Vargas‐Albores, F., Gollas‐Galván, T., & Martínez‐Córdova, L. R. (2019) · Aquaculture · doi:10.1016/j.aquaculture.2019.734842 · Cited by 42
Omont, A., Elizondo‐González, R., Quiróz-Guzmán, E., Escobedo‐Fregoso, C., Hernández-Herrera, R., & Peña‐Rodríguez, A. (2020) · Aquaculture · doi:10.1016/j.aquaculture.2020.735059 · Cited by 41
Wu, Z., Zhang, Q., Zhang, T., Chen, J., Wang, S., Hao, J., Lin, Y., & Li, A. (2021) · Aquaculture · doi:10.1016/j.aquaculture.2021.736492 · Cited by 40
Huang, L., Guo, H., Liu, Z., Chen, C., Wang, K., Huang, X., Chen, W., Zhu, Y., Yan, M., & Zhang, D. (2022) · Marine Life Science & Technology · doi:10.1007/s42995-021-00124-9 · Cited by 40
Heyse, J., Props, R., Kongnuan, P., Schryver, P. D., Rombaut, G., Defoirdt, T., & Boon, N. (2020) · Environmental Microbiology · doi:10.1111/1462-2920.15310 · Cited by 41
Longitudinal variations in the gastrointestinal microbiome of the white shrimp, Litopenaeus vannamei
Garibay-Valdéz, E., Cicala, F., Martínez‐Porchas, M., Gómez-Reyes, R., Vargas‐Albores, F., Gollas‐Galván, T., Martínez‐Córdova, L. R., & Calderón, K. (2021) · PeerJ · doi:10.7717/peerj.11827 · Cited by 39
Reyes, G., Betancourt, I., Andrade, B., Panchana, F., Román, R., Ochoa, L. S., Trujillo, L. E., & Bayot, B. (2022) · Frontiers in Microbiology · doi:10.3389/fmicb.2022.838640 · Cited by 38
Li, T., Sun, X., Chen, H., He, B., Mei, Y., Wang, D., & Li, J. (2020) · Frontiers in Microbiology · doi:10.3389/fmicb.2020.00462 · Cited by 39
Ballantyne, R., Lee, J., Wang, S., Lin, J., Tseng, D.-Y., Liao, Y.-C., Chang, H.-T., Lee, T.-Y., & Liu, C. (2023) · Fish & Shellfish Immunology · doi:10.1016/j.fsi.2023.108882 · Cited by 36
Duan, Y., Huang, J., Wang, Y., & Zhang, J. (2020) · Aquaculture Research · doi:10.1111/are.14770 · Cited by 36
Tang, Y., Wang, R., Tan, L., Guo, L., Duan, Y., Yang, L., Jiang, S., Zhou, F., Jiang, S., & Huang, J. (2020) · Aquaculture · doi:10.1016/j.aquaculture.2020.735344 · Cited by 35
Chen, Z., Chang, Z., Qiao, L., Wang, J., Liu, Y., Song, X., & Li, J. (2021) · Aquaculture · doi:10.1016/j.aquaculture.2021.736928 · Cited by 33
Shrimp microbiome and immune development in the early life stages
Angthong, P., Chaiyapechara, S., & Rungrassamee, W. (2023) · Developmental & Comparative Immunology · doi:10.1016/j.dci.2023.104765 · Cited by 33
Yang, W., Zhu, J., Zheng, C., Lukwambe, B., Nicholaus, R., Lu, K., & Zheng, Z. (2019) · Aquaculture · doi:10.1016/j.aquaculture.2019.734733 · Cited by 32
Wang, H., Huang, J., Wang, P., & Li, T. (2020) · Molecular Genetics and Genomics · doi:10.1007/s00438-020-01717-2 · Cited by 32
Copetti, F., Gregoracci, G. B., Vadstein, Ô., & Schveitzer, R. (2021) · Aquaculture · doi:10.1016/j.aquaculture.2021.736969 · Cited by 32
Liu, B., Song, C., Gao, Q., Liu, B., Zhou, Q., Sun, C., Zhang, H., Liu, M., & Tadese, D. A. (2021) · The Science of The Total Environment · doi:10.1016/j.scitotenv.2021.148062 · Cited by 32
Sha, H., Lü, J., Chen, J., & Xiong, J. (2022) · Environmental Microbiology · doi:10.1111/1462-2920.16024 · Cited by 33
Guzmán-Villanueva, L. T., Escobedo‐Fregoso, C., Barajas-Sandoval, D. R., Gómez‐Gil, B., Peña‐Rodríguez, A., Martínez‐Díaz, S. F., Balcázar, J. L., & Quiróz-Guzmán, E. (2019) · Aquaculture · doi:10.1016/j.aquaculture.2019.734907 · Cited by 32
Xue, M., Wu, L., He, Y., Liang, H., & Wen, C. (2018) · PeerJ · doi:10.7717/peerj.5257 · Cited by 31
A review: Marine aquaculture impacts marine microbial communities
Zhang, X., Hua, J., Song, Z., & Li, K. (2024) · AIMS Microbiology · doi:10.3934/microbiol.2024012 · Cited by 30
Self-citationKim, S., Song, J., Rajeev, M., Kim, S. K., Kang, I., Jang, I., & Cho, J. (2022) · Frontiers in Microbiology · doi:10.3389/fmicb.2022.995699 · Cited by 30
Wang, J., Lu, J. J., Zhang, Y., Wu, J., Zhang, C., Yu, X., Zhang, Z., Liu, H., & Wang, W. (2018) · Aquacultural Engineering · doi:10.1016/j.aquaeng.2018.10.001 · Cited by 30
Spatial Heterogeneity of Vibrio spp. in Sediments of Chinese Marginal Seas
Wang, X., Liu, J., Li, B., Liang, J., Sun, H., Zhou, S., & Zhang, X. (2019) · Applied and Environmental Microbiology · doi:10.1128/aem.03064-18 · Cited by 30
Self-citationMoghadam, H., Sourinejad, I., & Johari, S. A. (2022) · Aquaculture International · doi:10.1007/s10499-022-00962-z · Cited by 29
Diwan, A. D., Harke, S. N., & Panche, A. N. (2023) · The Microbe · doi:10.1016/j.microb.2023.100031 · Cited by 28
Wei, C., Wang, X., Li, C., Zhou, H., Liu, C., Mai, K., & He, G. (2021) · Aquaculture Reports · doi:10.1016/j.aqrep.2021.100595 · Cited by 28
Liu, L., Liu, Y., Qin, G., Wei, C., Li, Y., Cui, L., & Tian, X. (2023) · Aquaculture · doi:10.1016/j.aquaculture.2023.740156 · Cited by 28
Giraud, C., Callac, N., Boulo, V., Lam, J.-S., Pham, D., Selmaoui-Folcher, N., & Wabete, N. (2022) · Frontiers in Microbiology · doi:10.3389/fmicb.2022.886752 · Cited by 26
Cao, Q., Najnine, F., Han, H., Wu, B., & Cai, J. (2020) · Frontiers in Microbiology · doi:10.3389/fmicb.2020.01296 · Cited by 27
Lv, X., Li, S., Yu, Y., Zhang, X., & Li, F. (2020) · Fish & Shellfish Immunology · doi:10.1016/j.fsi.2020.07.014 · Cited by 27
Self-citationDing, Y., Chen, N., Ke, J., Qi, Z., Chen, W., Sun, S., Zheng, Z., Xu, J., & Yang, W. (2021) · Aquaculture · doi:10.1016/j.aquaculture.2021.736895 · Cited by 29
Microbial education for marine invertebrate disease prevention in aquaculture
Dantan, L., Toulza, È., Petton, B., Montagnani, C., Dégremont, L., Morga, B., Fleury, Y., Mitta, G., Gueguen, Y., Vidal‐Dupiol, J., et al. (2024) · Reviews in Aquaculture · doi:10.1111/raq.12893 · Cited by 29
Guan, X., Wang, B., Duan, P., Tian, J., Dong, Y., Jiang, J., Sun, B., & Zhou, Z. (2020) · Aquaculture Research · doi:10.1111/are.14528 · Cited by 26
Bacterial signatures of productivity decay in Penaeus monodon ponds infected with PirA toxin
Villamil, S. I., Huerlimann, R., Condon, K., Maes, G. E., & Jerry, D. R. (2019) · Aquaculture · doi:10.1016/j.aquaculture.2019.734202 · Cited by 25
Kim, Y., Kim, S.-E., Kim, S.-J., Jung, H.-K., Park, J., Jeon, Y. J., Kim, D., Kang, J.-H., & Kim, K. (2020) · Aquaculture · doi:10.1016/j.aquaculture.2020.735908 · Cited by 25
Gao, Q., Luo, J., Liu, P., Yi, S., Tang, Q., Jing-fen, L., Xia, Z., & Yang, G. (2022) · Aquaculture · doi:10.1016/j.aquaculture.2022.738200 · Cited by 25
Callac, N., Giraud, C., Boulo, V., Wabete, N., & Pham, D. (2023) · PeerJ · doi:10.7717/peerj.15201 · Cited by 25
Dragičević, P., Bielen, A., Petrić, I. S., Vuk, M., Žučko, J., & Hudina, S. (2021) · Microbiology Spectrum · doi:10.1128/spectrum.00389-21 · Cited by 26
Peng, J., He, P.-P., Wei, P., Zhang, B., Zhao, Y., Li, Q., Chen, X., Peng, M., Zeng, D., Yang, C., et al. (2018) · Frontiers in Physiology · doi:10.3389/fphys.2018.01399 · Cited by 24
Giraud, C., Callac, N., Beauvais, M., Mailliez, J.-R., Ansquer, D., Selmaoui-Folcher, N., Pham, D., Wabete, N., & Boulo, V. (2021) · PeerJ · doi:10.7717/peerj.12241 · Cited by 23
Veyrand-Quirós, B., Gómez‐Gil, B., Lomelí‐Ortega, C. O., Escobedo‐Fregoso, C., Millard, A. D., Tovar‐Ramírez, D., Balcázar, J. L., & Quiróz-Guzmán, E. (2020) · Journal of Applied Microbiology · doi:10.1111/jam.14744 · Cited by 23
Xie, M., Zhang, S., Xu, L., Wu, Z., Yuan, J., & Chen, X. (2021) · Frontiers in Microbiology · doi:10.3389/fmicb.2021.696281 · Cited by 23
Callac, N., Boulo, V., Giraud, C., Beauvais, M., Ansquer, D., Ballan, V., Maillez, J.-R., Wabete, N., & Pham, D. (2022) · Microbiology Spectrum · doi:10.1128/spectrum.04241-22 · Cited by 22
Lv, X., Li, S., Yu, Y., Zhang, X., & Li, F. (2023) · Marine Drugs · doi:10.3390/md21020130 · Cited by 23
Self-citationAbsence of a microbiome in the midgut trunk of six representative Crustacea
Martin, G. G., Natha, Z., Henderson, N., Bang, S., Hendry, H., & Loera, Y. (2019) · Journal of Crustacean Biology · doi:10.1093/jcbiol/ruz087 · Cited by 23
Rai, N., Kachore, A., JULKA, J. M., Panigrahi, A., Das, S. P., & Nan, F. (2025) · Frontiers in Cellular and Infection Microbiology · doi:10.3389/fcimb.2025.1639426 · Cited by 21
Bruno, A., Sandionigi, A., Panio, A., Rimoldi, S., Orizio, F., Agostinetto, G., Hasan, I. M., Gasco, L., Terova, G., & Labra, M. (2023) · BMC Microbiology · doi:10.1186/s12866-023-02990-y · Cited by 21
Gut bacterial profile associated with healthy and diseased (AHPND) shrimp Penaeus vannamei
Alvarez-Ruiz, S. A. P., Luna‐González, A., Escamilla‐Montes, R., Fierro-Coronado, A., Plata, G. D., García-Gutiérrez, C., & Peraza-Gómez, V. (2022) · Latin American Journal of Aquatic Research · doi:10.3856/vol50-issue2-fulltext-2839 · Cited by 20
Liu, L., Wang, Y., Ren, J., Zou, H., & Wang, C. (2022) · Aquaculture International · doi:10.1007/s10499-022-00909-4 · Cited by 19
Lv, X., Li, S., Yu, Y., Xiang, J., & Li, F. (2020) · Developmental & Comparative Immunology · doi:10.1016/j.dci.2020.103756 · Cited by 19
Xue, M., He, Y., Chen, D., Wang, L., Liang, H., Liu, J., & Wen, C. (2020) · Aquaculture · doi:10.1016/j.aquaculture.2020.735605 · Cited by 19
Self-citationQuiróz-Guzmán, E., Morreeuw, Z. P., Peña‐Rodríguez, A., Barajas-Sandoval, D. R., Magallón‐Servín, P., Mejía, A., & Reyes, A. G. (2022) · Aquaculture · doi:10.1016/j.aquaculture.2022.738867 · Cited by 18
Mao, J., Lü, J., Chen, J., & Xiong, J. (2023) · Fish and Fisheries · doi:10.1111/faf.12787 · Cited by 18
Liao, W., Lin, Z., Liao, M., Xue, Y., Zhou, J., Wang, Y., Hou, D., & Sun, C. (2022) · Frontiers in Marine Science · doi:10.3389/fmars.2022.989325 · Cited by 17
Resilience and probiotic interventions to prevent and recover from shrimp gut dysbiosis
Kumar, R., Huang, M., Chen, C.-L., Wang, H., & Lu, H. (2023) · Fish & Shellfish Immunology · doi:10.1016/j.fsi.2023.108886 · Cited by 14
Liu, L., Wang, M., Wei, C., Liu, Y., Pan, M., Wang, S., Cui, L., & Tian, X. (2022) · Frontiers in Marine Science · doi:10.3389/fmars.2022.855938 · Cited by 14
Yu, W., Cao, J., Dai, W., Qiu, Q., & Xiong, J. (2018) · Applied and Environmental Microbiology · doi:10.1128/aem.01387-18 · Cited by 14
Xu, H., Ren, J., Xu, X., Lou, B., & Zhang, D. (2023) · Fishes · doi:10.3390/fishes8090473 · Cited by 12
Reyes, G., Andrade, B., Betancourt, I., Panchana, F., Preciado, C., & Bayot, B. (2024) · Heliyon · doi:10.1016/j.heliyon.2024.e33034 · Cited by 12
Hossain, M. S., Dai, J., & Qiu, D. (2021) · Aquaculture International · doi:10.1007/s10499-021-00692-8 · Cited by 12
Rajonhson, D. M., Angthong, P., Thepsuwan, T., Sutheeworapong, S., Satanwat, P., Tapaneeyaworawong, P., Powtongsook, S., Kruasuwan, W., Jenjaroenpun, P., Wongsurawat, T., et al. (2024) · Microbiology Spectrum · doi:10.1128/spectrum.00965-24 · Cited by 11
Chen, L., Xiang, J., Cai, H., Ke, J., Ni, H., Zhu, J., Zheng, Z., Lu, K., & Yang, W. T. (2024) · Biology · doi:10.3390/biology13010054 · Cited by 11
Duan, Y., Tang, Y., Huang, J., Zhang, J., Lin, H., Jiang, S., Wang, R., & Wang, G. (2020) · The Journal of Microbiology · doi:10.1007/s12275-020-0053-0 · Cited by 11
Lin, X.-Y., Shih, Y., Zhang, X.-J., Cai, Y.-S., Zhou, X.-W., & Chen, J. (2024) · Frontiers in Marine Science · doi:10.3389/fmars.2024.1332585 · Cited by 10
Self-citationZakaria, M., Francisco, M. E., Sanyal, S. K., Hossain, A., Mandal, S. C., & Haque, M. I.-M. (2025) · The Microbe · doi:10.1016/j.microb.2025.100299 · Cited by 10
Zhang, Q., Meng, L., Li, J., Li, L., Zeng, Q., Wang, R., Wang, D., Tong, T., Liu, Y., & Yang, H. (2025) · Aquaculture Nutrition · doi:10.1155/anu/4904293 · Cited by 10
Siller, P., Daehre, K., Rosen, K., Münch, S., Bartel, A., Funk, R., Nübel, U., Amon, T., & Roesler, U. H. (2021) · Environmental Microbiology · doi:10.1111/1462-2920.15437 · Cited by 10
Vinay, T. N., Patil, P. K., Aravind, R., Anand, P. S. S., Baskaran, V., & Balasubramanian, C. P. (2022) · Molecular Genetics and Genomics · doi:10.1007/s00438-022-01865-7 · Cited by 10
Callac, N., Giraud, C., Pham, D., Ansquer, D., Wabete, N., & Boulo, V. (2024) · Microorganisms · doi:10.3390/microorganisms12030608 · Cited by 9
Analysis of Gut Microbiota Associated with WSSV Resistance in Litopenaeus vannamei
Wanna, W., Aucharean, C., & Jaeram, N. (2024) · Marine Biotechnology · doi:10.1007/s10126-024-10381-1 · Cited by 9
Reyes, G., Andrade, B., Betancourt, I., Panchana, F., Solórzano, R., Preciado, C., Ochoa, L. S., Trujillo, L. E., & Bayot, B. (2023) · PeerJ · doi:10.7717/peerj.15795 · Cited by 9
Liu, Q., Gao, Y., Wang, C., Zeng, Y., & Lai, Z. (2022) · Journal of the World Aquaculture Society · doi:10.1111/jwas.12933 · Cited by 8
Bruno, A., Cafiso, A., Sandionigi, A., Galimberti, A., Magnani, D., Manfrin, A., Petroni, G., Casiraghi, M., & Bazzocchi, C. (2023) · Frontiers in Microbiology · doi:10.3389/fmicb.2023.1059127 · Cited by 8
Zhao, W., Wang, R. Y., Zhang, Y., Zhang, Q., & Fu, S. (2023) · Aquaculture · doi:10.1016/j.aquaculture.2023.740393 · Cited by 8
Yin, M., Zheng, Z., Xing, R., Jiao, L., Gouife, M., Ming, T., Kong, F., Qiu, S., & Xu, J. (2025) · Aquaculture Reports · doi:10.1016/j.aqrep.2025.103078 · Cited by 7
Modulating the gut microbiome-immune axis in shrimp: Use of probiotics to enhance disease resistance
Negi, A., & Chen, J.-Y. (2025) · Aquaculture · doi:10.1016/j.aquaculture.2025.743214 · Cited by 8
Metadata
- Authors
- Zheng, Y., Yu, M., Liu, J., Qiao, Y., Wang, L., Li, Z., Zhang, X.-H., & Yu, M.
- Affiliations
- Ocean University of China (CN)
- Qingdao National Laboratory for Marine Science and Technology (CN)
- Corresponding author
- Zhang, Xiao-Hua
- Venue
- Frontiers in Microbiology
- Publisher
- Frontiers Media SA
- Published
- 2017-07-18
- Volume
- 8
- Pages
- 1362-1362
- ISSN
- 1664-302X (ISSN-L)
- PMC
- PMC5513922
- OpenAlex
- W2735973305
- Cited by
- 165
- References
- 46
- Citations by year
- 2026: 8 · 2025: 20 · 2024: 15 · 2023: 31 · 2022: 16 · 2021: 30 · 2020: 23 · 2019: 12 · 2018: 8 · 2017: 1
- FWCI
- 5.45
- Type
- journal article
- Language
- en
- Open access
- gold
- doi.org
- Licence
- cc-by
- Locations
- Frontiers in Microbiology (publishedVersion, cc-by)
- PubMed Central (publishedVersion, cc-by)
- PubMed (publishedVersion)
- DOAJ (DOAJ: Directory of Open Access Journals) (submittedVersion, cc-by-sa)
- Funders
- National Natural Science Foundation of China (31502171)
- Topics
- Life Sciences › Immunology and Microbiology › Immunology › Aquaculture disease management and microbiota
- Physical Sciences › Environmental Science › Ecology › Microbial Community Ecology and Physiology
- Physical Sciences › Environmental Science › Ecology › Crustacean biology and ecology
- Keywords
- Litopenaeus vannamei, shrimp larvae, bacterial communities, shrimp disease, growth stages, zoea, mysis, Enterobacteriaceae, Rhodobacteraceae, health indicators
About these checks
Registry, retraction, Cites and statistics results are computed, not judged, with one exception: a printed reference that no index lists is read once by a model before it counts as a citation error. Claims are extracted by a model and kept only when their quote appears verbatim in the text; each cited source is then checked, with a model’s help, for whether it says what the claim relies on. Those verdicts can be wrong — read the claim’s quote and the cited source before relying on one.
Statistics and arithmetic are recomputed, not judged.
Confidence bands are shown only for fields calibrated on our annotated test set. None is calibrated yet, so no band is shown.
What counts as a claim ›How we measure confidence ›How we check this ›
Are you an author, or do you see a problem with this page? Request a review
