

The DOI matches its Crossref record; 95 of the 95 references it cites were found in a registry or an index.
Microbial Diversity and Mineralogical-Mechanical Properties of Calcitic Cave Speleothems in Natural and in Vitro Biomineralization Conditions
Abstract
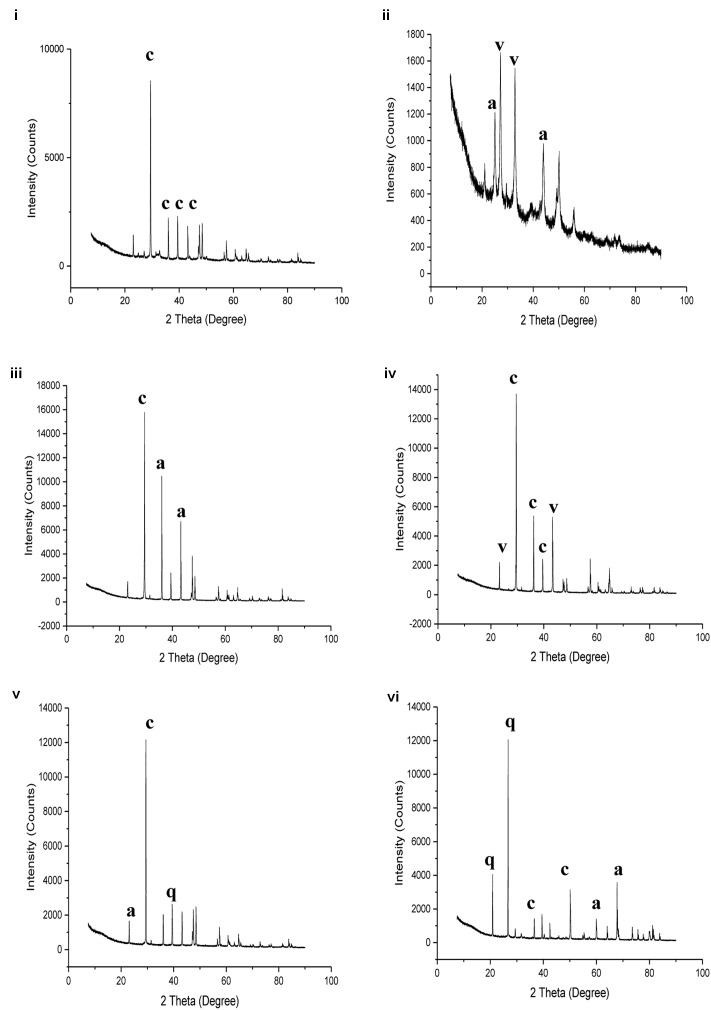
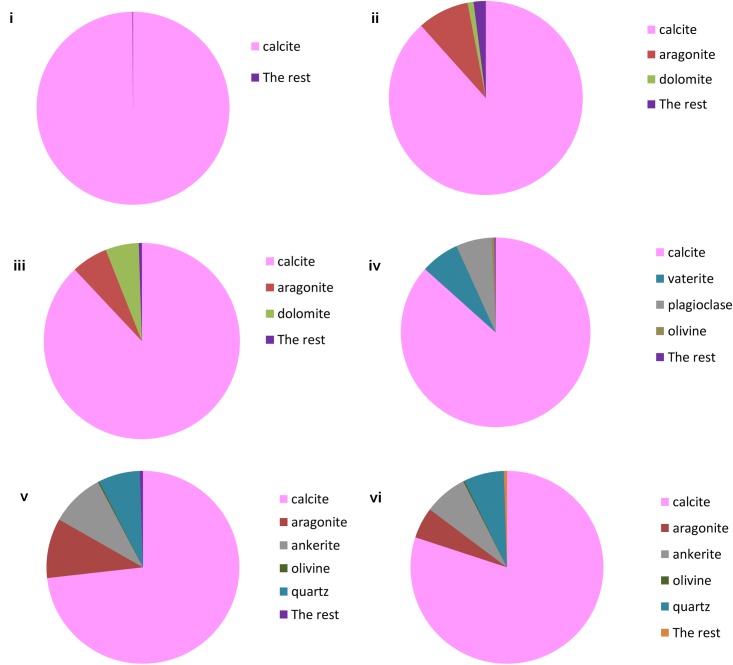
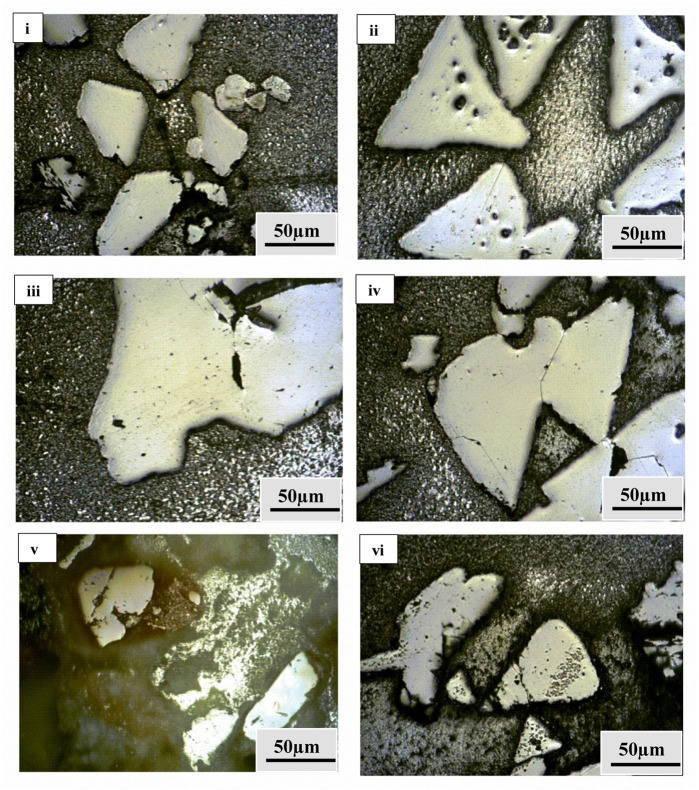
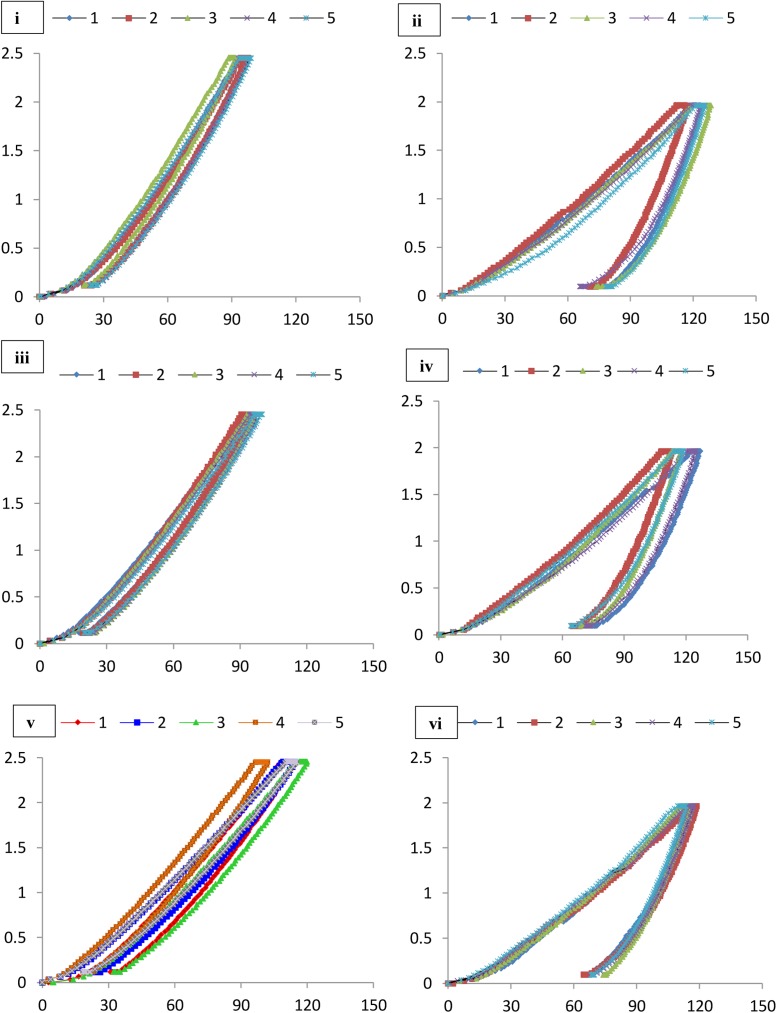
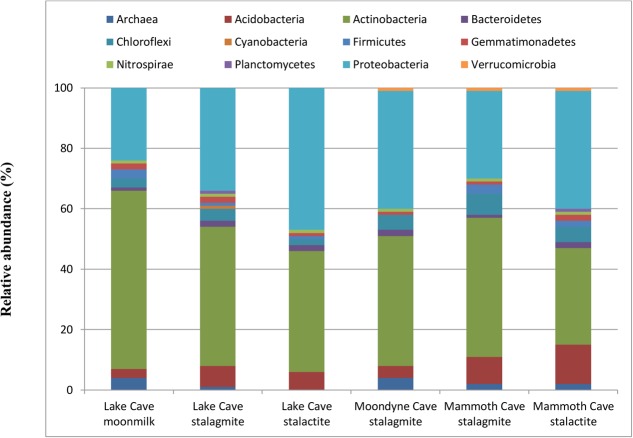
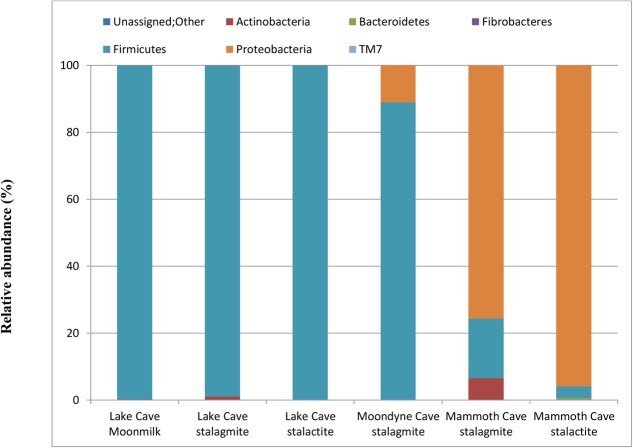
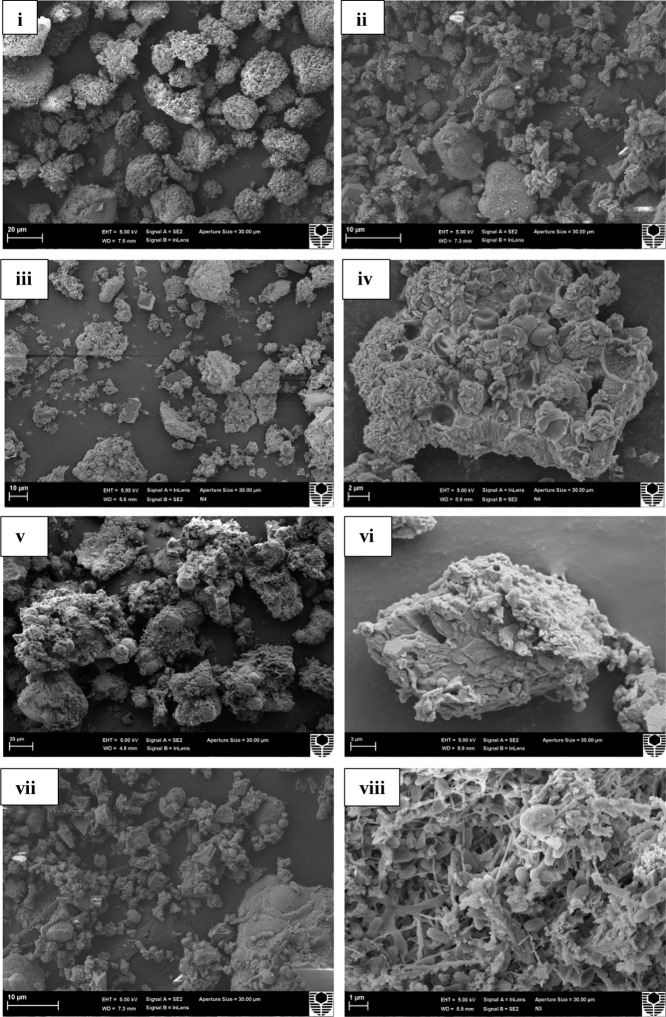
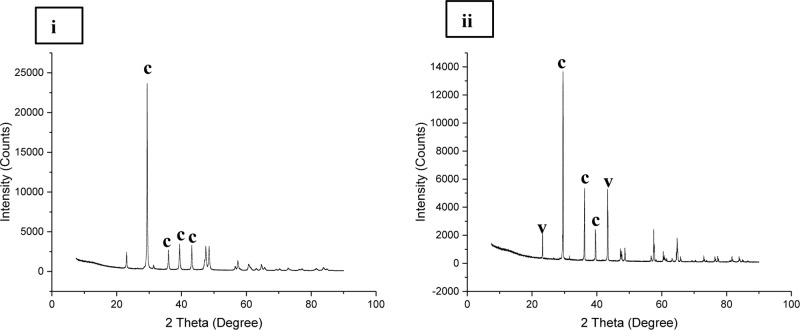
Natural mineral formations are a window into important processes leading to carbon storage and mineralized carbonate structures formed through abiotic and biotic processes. In the current study, we made an attempt to undertake a comprehensive approach to characterize the mineralogical, mechanical, and microbial properties of different kinds of speleothems from karstic caves; with an aim to understand the bio-geo-chemical processes in speleothem structures and their impact on nanomechanical properties. We also investigated the biomineralization abilities of speleothem surface associated microbial communities in vitro. Mineralogical profiling using techniques such as X-ray powder Diffraction (XRD) and Tescan Integrated Mineral Analyzer (TIMA) demonstrated that calcite was the dominant mineral in the majority of speleothems with Energy Dispersive X-ray Analysis (EDS) indicating a few variations in the elemental components. Differing proportions of polymorphs of calcium carbonate such as aragonite and vaterite were also recorded. Significant variations in trace metal content were recorded through Inductively Coupled Plasma Mass Spectrometer (ICP-MS). Scanning Electron Microscopy (SEM) analysis revealed differences in morphological features of the crystals which varied from triangular prismatic shapes to etched spiky forms. Microbial imprints and associations were seen in a few sections. Analysis of the associated microbial diversity showed significant differences between various speleothems at Phylum level; although Proteobacteria and Actinobacteria were found to be the predominant groups. Genus level microbial associations showed a relationship with the geochemistry, mineralogical composition, and metal content of the speleothems. The assessment of nanomechanical properties measured by Nanoindentation revealed that the speleothems with a dominance of calcite were stronger than the speleothems with mixed calcium carbonate polymorphs and silica content. The in vitro metabolic activity of the microbial communities associated with the surfaces of the speleothems resulted in calcium carbonate crystal precipitation. Firmicutes and Proteobacteria dominated these populations, in contrast to the populations seen in natural systems. The precipitation of calcium carbonate crystals in vitro indicated that microbial metabolic activity may also play an important role in the synthesis and dissociation of biominerals in the natural environment. Our study provides novel evidence of the close relationship between mineralogy, microbial ecology, geochemistry, and nanomechanical properties of natural formations.
Overview
The claims and statistics of this paper haven’t been checked yet.
Run the check — free, no account needed. It reads the open-access text and checks the sources it cites.
Integrity signals
Registry
Cites
Statistics
Figures
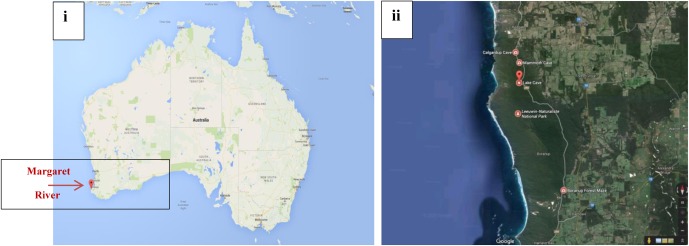
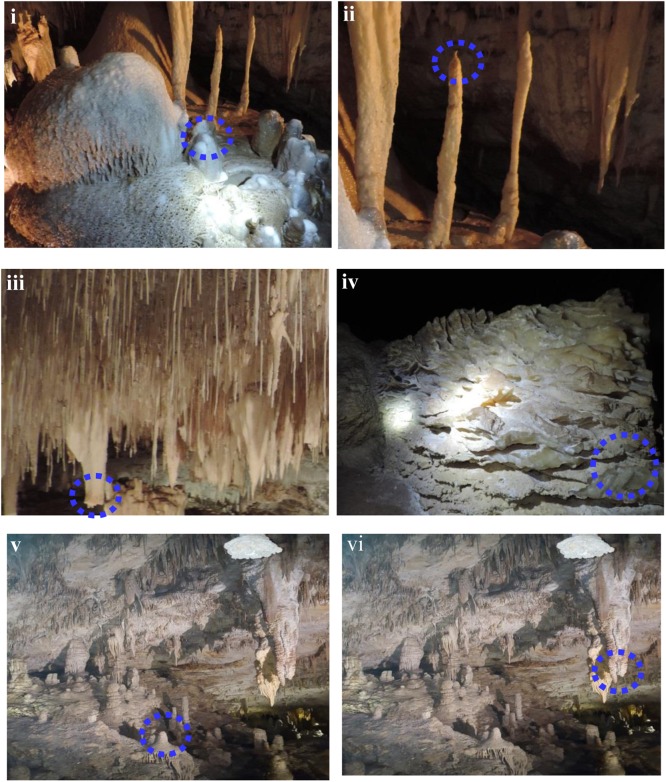
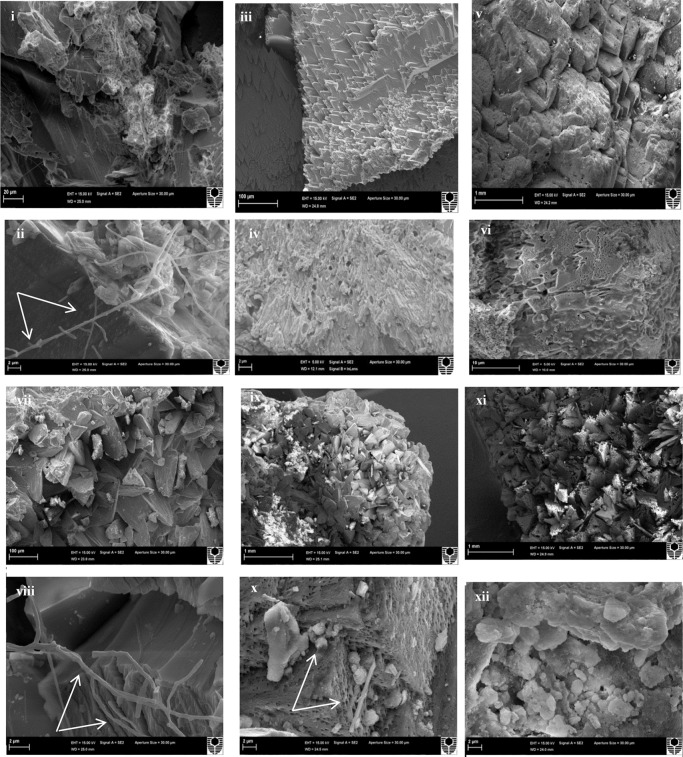
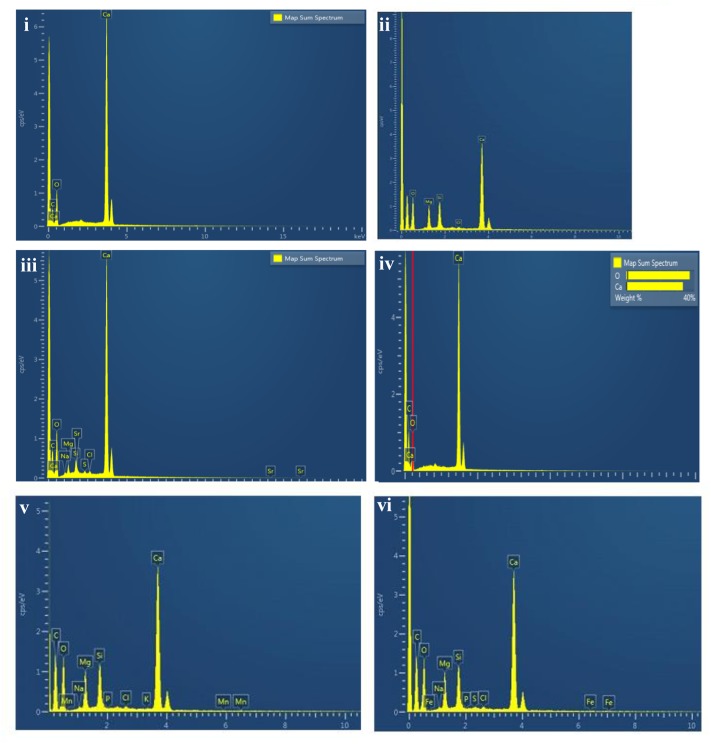
Verification
Claims the paper makes
The claims and statistics of this paper haven’t been checked yet.
Run the check — free, no account needed. It reads the open-access text and checks the sources it cites.
Claims other papers make about this one
Each is checked against this paper’s own text: does it say what the citing paper says it does?
The source backs part of the claim, not all of it — or backs it for a different population, condition or comparison.
In the citing paper
“Bacteria are known to biomineralize calcium in crystal lattices that can incorporate fluoride, including francolite, aragonite, dolomite, and apatite114–118.”
From The link between ancient microbial fluoride resistance mechanisms and bioengineering organofluorine degradation or synthesis (2024) · cites this paper as [117]
Experimental — accuracy not yet measured
Self-check
Percentages, sums and reported differences re-computed from the paper’s own numbers.
The self-check needs the paper’s full text.
Citations
Cites
QIIME allows analysis of high-throughput community sequencing data
Caporaso, J. G., Kuczynski, J., Stombaugh, J., Bittinger, K., Bushman, F. D., Costello, E. K., Fierer, N., Peña, A. G., Goodrich, J. K., Gordon, J. I., et al. (2010) · Nature Methods · doi:10.1038/nmeth.f.303 · Cited by 34,887
The SILVA ribosomal RNA gene database project: improved data processing and web-based tools
Quast, C., Pruesse, E., Yilmaz, P., Gerken, J., Schweer, T., Yarza, P., Peplies, J., & Glöckner, F. O. (2012) · Nucleic Acids Research · doi:10.1093/nar/gks1219 · Cited by 33,055
UCHIME improves sensitivity and speed of chimera detection
Edgar, R. C., Haas, B. J., Clemente, J. C., Quince, C., & Knight, R. (2011) · Bioinformatics · doi:10.1093/bioinformatics/btr381 · Cited by 15,114
PEAR: a fast and accurate Illumina Paired-End reAd mergeR
Zhang, J., Kobert, K., Flouri, T., & Stamatakis, A. (2014) · Bioinformatics · doi:10.1093/bioinformatics/btt593 · Cited by 4,497
Microbial carbonate precipitation in construction materials: A review
Muynck, W. D., Belie, N. D., & Verstraete, W. (2009) · Ecological Engineering · doi:10.1016/j.ecoleng.2009.02.006 · Cited by 1,474
Lowenstam, H. A. (1981) · Science · doi:10.1126/science.7008198 · Cited by 1,363
The nanogranular nature of C–S–H
Constantinides, G., & Ulm, F. (2006) · Journal of the Mechanics and Physics of Solids · doi:10.1016/j.jmps.2006.06.003 · Cited by 924
Biogeochemical processes and geotechnical applications: progress, opportunities and challenges
DeJong, J. T., Soga, K., Kavazanjian, E., Burns, S. E., van Paassen, L. A., QABANY, A. A., Aydilek, A. H., Bang, S., Burbank, M. B., Caslake, L. F., et al. (2013) · Géotechnique · doi:10.1680/geot.sip13.p.017 · Cited by 846
Biomineralization of calcium carbonates and their engineered applications: a review
Dhami, N., Reddy, M. S., & Mukherjee, A. (2013) · Frontiers in Microbiology · doi:10.3389/fmicb.2013.00314 · Cited by 760
Self-citationZhu, T., & Dittrich, M. (2016) · Frontiers in Bioengineering and Biotechnology · doi:10.3389/fbioe.2016.00004 · Cited by 696
Engineered applications of ureolytic biomineralization: a review
Phillips, A. J., Gerlach, R., Lauchnor, E. G., Mitchell, A. C., Cunningham, A. B., & Spangler, L. H. (2013) · Biofouling · doi:10.1080/08927014.2013.796550 · Cited by 457
Mineral formation by bacteria in natural microbial communities
Douglas, S. (1998) · FEMS Microbiology Ecology · doi:10.1016/s0168-6496(98)00027-0 · Cited by 436
Geomicrobiology of Caves: A Review
E. Northup, K. H. L. (2001) · Geomicrobiology Journal · doi:10.1080/01490450152467750 · Cited by 396
Hamilton, W. A. (2003) · Biofouling · doi:10.1080/0892701021000041078 · Cited by 352
The nanogranular behavior of C-S-H at elevated temperatures (up to 700 °C)
DeJong, M. J., & Ulm, F.-J. (2007) · Cement and Concrete Research · doi:10.1016/j.cemconres.2006.09.006 · Cited by 326
Nanoindentation mapping of mechanical properties of cement paste and natural rocks
Zhu, W., Hughes, J. J., Bicanic, N., & Pearce, C. J. (2007) · Materials Characterization · doi:10.1016/j.matchar.2007.05.018 · Cited by 310
Dhami, N. K. (2013) · Journal of Microbiology and Biotechnology · doi:10.4014/jmb.1212.11087 · Cited by 279
Self-citationBuhmann, D., & Dreybrodt, W. (1985) · Chemical Geology · doi:10.1016/0009-2541(85)90046-4 · Cited by 279
Surface-mediated mineral development by bacteria
Fortin, D., Ferris, F. G., & Beveridge, T. J. (1997) · Reviews in Mineralogy and Geochemistry · Cited by 277
The kinetics of calcium carbonate dissolution and precipitation
Morse, J. W. (1983) · Reviews in Mineralogy and Geochemistry · Cited by 261
Bacterial Roles in the Precipitation of Carbonate Minerals
Castanier, S., Métayer-Levrel, G. L., & Perthuisot, J.-P. (2000) · Microbial Sediments · doi:10.1007/978-3-662-04036-2_5 · Cited by 257
Diverse microbial communities inhabiting ferromanganese deposits in Lechuguilla and Spider Caves
Northup, D. E., Barns, S. M., Yu, L. E., et al. (2003) · Environmental Microbiology · doi:10.1046/j.1462-2920.2003.00500.x · Cited by 254
Rodriguez-Navarro, C. M., Jroundi, F., Schiro, M., Ruíz-Agudo, E., & González‐Muñoz, M. T. (2012) · Applied and Environmental Microbiology · doi:10.1128/aem.07044-11 · Cited by 251
Bacillus subtilisGene Cluster Involved in Calcium Carbonate Biomineralization
Barabesi, C., Galizzi, A., Mastromei, G., Rossi, M., Tamburini, E., & Perito, B. (2006) · Journal of Bacteriology · doi:10.1128/jb.01450-06 · Cited by 207
Chen, Y., Wu, L., Boden, R., Hillebrand‐Voiculescu, A., Kumaresan, D., Moussard, H., Baciu, M., Lu, Y., & Murrell, J. C. (2009) · The ISME Journal · doi:10.1038/ismej.2009.57 · Cited by 202
Origin of fabrics in speleothems composed of columnar calcite crystals
Kendall, A. C., & Broughton, P. L. (1978) · Journal of Sedimentary Research · doi:10.1306/212f74c3-2b24-11d7-8648000102c1865d · Cited by 200
Gallagher, K. L., Kading, T. J., Braissant, O., Dupraz, C., & Visscher, P. T. (2012) · Geobiology · doi:10.1111/j.1472-4669.2012.00342.x · Cited by 190
Phylogenetic structure of unusual aquatic microbial formations in Nullarbor caves, Australia
Holmes, A. J., Tujula, N. A., Holley, M. P., Contos, A., James, J. M., Rogers, P. A. W., & Gillings, M. R. (2001) · Environmental Microbiology · doi:10.1046/j.1462-2920.2001.00187.x · Cited by 187
Microorganisms and Microbially Induced Fabrics in Cave Walls
J. C. Cañveras, S. S.-M. (2001) · Geomicrobiology Journal · doi:10.1080/01490450152467769 · Cited by 183
Alonso‐Zarza, A. M., & Wright, V. P. (2009) · Developments in sedimentology · doi:10.1016/s0070-4571(09)06105-6 · Cited by 181
Chekroun, K. B., Rodriguez-Navarro, C., González-Muñoz, M. T., Arias, J., Cultrone, G., & Rodríguez-Gallego, M. (2004) · Journal of Sedimentary Research · doi:10.1306/050504740868 · Cited by 181
Bizarre Forms of Depositional and Diagenetic Calcite in Hot-Spring Travertines, Central Italy
Folk, R. L., Chafetz, H. S., & Tiezzi, P. A. (1985) · SEPM (Society for Sedimentary Geology) eBooks · doi:10.2110/pec.85.36.0349 · Cited by 180
Extremely acidic, pendulous cave wall biofilms from the Frasassi cave system, Italy
Macalady, J. L., Jones, D. S., & Lyon, E. H. (2007) · Environmental Microbiology · doi:10.1111/j.1462-2920.2007.01256.x · Cited by 178
Biomineralization of carbonate and phosphate by moderately halophilic bacteria
Sánchez‐Román, M., Rivadeneyra, M. A., Vásconcelos, C., & McKenzie, J. A. (2007) · FEMS Microbiology Ecology · doi:10.1111/j.1574-6941.2007.00336.x · Cited by 172
Structure and carbonate orientation of vaterite (CaCO3)
Wang, J., & Becker, U. (2009) · American Mineralogist · doi:10.2138/am.2009.2939 · Cited by 170
Bacterial Calcium Carbonate Precipitation in Cave Environments: A Function of Calcium Homeostasis
Banks, E. D., Taylor, N. M., Gulley, J., Lübbers, B., Giarrizzo, J. G., Bullen, H. A., Hoehler, T. M., & Barton, H. A. (2010) · Geomicrobiology Journal · doi:10.1080/01490450903485136 · Cited by 170
Bacteria, fungi and biokarst in Lechuguilla Cave, Carlsbad Caverns National Park, New Mexico
Cunningham, K. I., Northup, D. E., Pollastro, R. M., Wright, W. G., & LaRock, E. J. (1995) · Environmental Geology · doi:10.1007/bf01061824 · Cited by 158
Application of calcifying bacteria for remediation of stones and cultural heritages
Dhami, N. K., Reddy, M. S., & Mukherjee, A. (2014) · Frontiers in Microbiology · doi:10.3389/fmicb.2014.00304 · Cited by 154
Self-citationCacchio, P., Ercole, C., Cappuccio, G., & Lepidi, A. A. (2003) · Geomicrobiology Journal · doi:10.1080/01490450303883 · Cited by 151
Tomczyk‐Żak, K., & Zielenkiewicz, U. (2015) · Geomicrobiology Journal · doi:10.1080/01490451.2014.1003341 · Cited by 142
Calcite Moonmilk: Crystal Morphology and Environment of Formation in Caves in the Italian Alps
Borsato, A., Frisia, S., Jones, B., & van der Borg, K. (2000) · Journal of Sedimentary Research · doi:10.1306/032300701171 · Cited by 142
Rusznyák, A., Akob, D. M., Nietzsche, S., Eusterhues, K., Totsche, K. U., Neu, T. R., Frosch, T., Popp, J., Keiner, R., Geletneky, J., et al. (2011) · Applied and Environmental Microbiology · doi:10.1128/aem.06568-11 · Cited by 141
Carbonate Crystals Precipitated by Freshwater Bacteria and Their Use as a Limestone Consolidant
Zamarreño, D. V., Inkpen, R., & May, E. (2009) · Applied and Environmental Microbiology · doi:10.1128/aem.02079-08 · Cited by 135
Dhami, N. K., Mukherjee, A., & Reddy, M. S. (2016) · Ecological Engineering · doi:10.1016/j.ecoleng.2016.06.013 · Cited by 135
Self-citationThe biogeochemical role of Actinobacteria in Altamira Cave, Spain
Cuezva, S., Fernández‐Cortés, Á., Porca, E., Pašić, L., Jurado, V., Hernández‐Mariné, M., Serrano-Ortíz, P., Hermosín, B., Cañaveras, J. C., Moral, S. S., et al. (2012) · FEMS Microbiology Ecology · doi:10.1111/j.1574-6941.2012.01391.x · Cited by 130
Barton, H. A., Taylor, N., Kreate, M., et al. (2007) · International Journal of Speleology · doi:10.5038/1827-806x.36.2.5 · Cited by 129
Jiménez-López, C., Jroundi, F., Pascolini, C., Rodriguez-Navarro, C. M., Piñar, G., Rodríguez-Gallego, M., & González‐Muñoz, M. T. (2008) · International Biodeterioration & Biodegradation · doi:10.1016/j.ibiod.2008.03.002 · Cited by 117
Dhami, N. K., Quirin, M. E. C., & Mukherjee, A. (2017) · Ecological Engineering · doi:10.1016/j.ecoleng.2017.03.007 · Cited by 116
Self-citationPortillo, M. C., Grau, J. M. G., & Sáiz‐Jiménez, C. (2007) · Journal of Applied Microbiology · doi:10.1111/j.1365-2672.2007.03594.x · Cited by 113
Parras‐Alcántara, L., Lozano‐García, B., Brevik, E. C., & Cerdà, A. (2015) · Journal of Environmental Management · doi:10.1016/j.jenvman.2015.03.039 · Cited by 111
Profiling bacterial diversity in a limestone cave of the western Loess Plateau of China
Wu, Y., Tan, L., Liu, W., Wang, B., Wang, J., Cai, Y., & Lin, X. (2015) · Frontiers in Microbiology · doi:10.3389/fmicb.2015.00244 · Cited by 97
Consolidation of archaeological gypsum plaster by bacterial biomineralization of calcium carbonate
Jroundi, F., González‐Muñoz, M. T., Bueno, A. M. G., & Rodriguez-Navarro, C. M. (2014) · Acta Biomaterialia · doi:10.1016/j.actbio.2014.03.007 · Cited by 95
Okyay, T. O., & Rodrigues, D. F. (2015) · FEMS Microbiology Ecology · doi:10.1093/femsec/fiv017 · Cited by 95
Microbial Activity in Caves−A Geological Perspective
Jones, B. (2001) · Geomicrobiology Journal · doi:10.1080/01490450152467831 · Cited by 94
Regional organic carbon stock variability: A comparison between depth increments and soil horizons
Grüneberg, E., Schöning, I., Kalko, E. K. V., & Weisser, W. W. (2010) · Geoderma · doi:10.1016/j.geoderma.2010.01.002 · Cited by 94
Stalactite Growth as a Free-Boundary Problem: A Geometric Law and Its Platonic Ideal
Short, M. B., Baygents, J. C., Beck, J., Stone, D. A., Toomey, R. S., & Goldstein, R. E. (2005) · Physical Review Letters · doi:10.1103/physrevlett.94.018501 · Cited by 93
Assessment of the Potential Role of Streptomyces in Cave Moonmilk Formation
Maciejewska, M., Adam, D., Naômé, A., Martinet, L., Tenconi, E., Całusińska, M., Delfosse, P., Hanikenne, M., Baurain, D., Compère, P., et al. (2017) · Frontiers in Microbiology · doi:10.3389/fmicb.2017.01181 · Cited by 92
Barton, H. A., Giarrizzo, J. G., Suárez, P., Robertson, C. E., Broering, M. J., Banks, E. D., Vaishampayan, P., & Venkateswaran, K. (2014) · Frontiers in Microbiology · doi:10.3389/fmicb.2014.00615 · Cited by 89
Mechanical properties of hydroxyapatite single crystals from nanoindentation data
Zamiri, A. R., & De, S. (2010) · Journal of the mechanical behavior of biomedical materials/Journal of mechanical behavior of biomedical materials · doi:10.1016/j.jmbbm.2010.11.001 · Cited by 87
Evidence for Microbial Involvement in Pool Finger Precipitation, Hidden Cave, New Mexico
Melim, K. M. S. L. A. (2001) · Geomicrobiology Journal · doi:10.1080/01490450152467813 · Cited by 82
Dhami, N. K., Alsubhi, W. R., Watkin, E. L. J., & Mukherjee, A. (2017) · Frontiers in Microbiology · doi:10.3389/fmicb.2017.01267 · Cited by 81
Self-citationBiofilm and Microbial Applications in Biomineralized Concrete
Dhami, N. K., Sudhakara, M., & Mukherjee, A. (2012) · InTech eBooks · doi:10.5772/31124 · Cited by 70
Self-citationBacteria and free-living amoeba in the Lascaux Cave
Bastián, F., Alabouvette, C., & Sáiz‐Jiménez, C. (2008) · Research in Microbiology · doi:10.1016/j.resmic.2008.10.001 · Cited by 66
HOW SPELEOTHEMS GROW: AN INTRODUCTION TO THE ONTOGENY OF CAVE MINERALS
Self, C. A., & Hill, C. A. (2003) · Cited by 65
Formation of amorphous calcium carbonate in caves and its implications for speleothem research
Demény, A., Németh, P., Czuppon, G., Leél‐Őssy, S., Szabó, M. Z., Judik, K., Németh, T., & Stieber, J. (2016) · Scientific Reports · doi:10.1038/srep39602 · Cited by 56
Baskar, S., Baskar, R., Lee, N., & Theophilus, P. K. (2008) · Environmental Geology · doi:10.1007/s00254-008-1413-y · Cited by 55
Vahabi, A., Ramezanianpour, A. A., Sharafi, H., Zahiri, H. S., Vali, H., & Noghabi, K. A. (2013) · Journal of Basic Microbiology · doi:10.1002/jobm.201300560 · Cited by 54
Shirakawa, M. A., Cincotto, M. A., Atencio, D., Gaylarde, C. C., & John, V. M. (2011) · Brazilian Journal of Microbiology · doi:10.1590/s1517-83822011000200014 · Cited by 52
Influence of Exopolymeric Materials on Bacterially Induced Mineralization of Carbonates
Bains, A., Dhami, N. K., Mukherjee, A., & Reddy, M. S. (2015) · Applied Biochemistry and Biotechnology · doi:10.1007/s12010-015-1524-3 · Cited by 51
Self-citationThe Mineralogy of Castleguard Cave, Columbia Icefields, Alberta, Canada
Harmon, R. S., Atkinson, T. C., & Atkinson, J. L. (1983) · Arctic and Alpine Research · doi:10.2307/1551236 · Cited by 51
Metagenomic Analysis from the Interior of a Speleothem in Tjuv-Ante's Cave, Northern Sweden
Mendoza, M. L. Z., Lundberg, J., Ivarsson, M., Campos, P. F., Nylander, J. A. A., Sallstedt, T., & Dalén, L. (2016) · PLoS ONE · doi:10.1371/journal.pone.0151577 · Cited by 50
Reticulated filaments in cave pool speleothems: microbe or mineral?
Melim, L. A., Northup, D. E., Spilde, M., Jones, B., Boston, P. J., & Bixby, R. J. (2018) · doi:10.7939/r3j38kz7v · Cited by 49
Presser, V., Gerlach, K., Vohrer, A., Nickel, K. G., & Dreher, W. (2010) · Journal of Materials Science · doi:10.1007/s10853-010-4208-y · Cited by 47
Bacterial community survey of sediments at Naracoorte Caves, Australia
Adetutu, E. M., Thorpe, K., Shahsavari, E., Bourne, S., Xiangsheng, C., Fard, R. M. N., Kirby, G., & Ball, A. S. (2012) · International Journal of Speleology · doi:10.5038/1827-806x.41.2.2 · Cited by 46
Ronholm, J., Schumann, D., Sapers, H. M., Izawa, M. R. M., Applin, D. M., Berg, B., Mann, P. J., Vali, H., Flemming, R. L., Cloutis, E. A., et al. (2014) · Geobiology · doi:10.1111/gbi.12102 · Cited by 45
Synergistic chemical and microbial cementation for stabilization of aggregates
Porter, H., Dhami, N. K., & Mukherjee, A. (2017) · Cement and Concrete Composites · doi:10.1016/j.cemconcomp.2017.07.015 · Cited by 44
Self-citationGarcía G., M., Márquez G., M. A., & Moreno H., C. X. (2016) · Microbiological Research · doi:10.1016/j.micres.2015.09.006 · Cited by 38
Joshi, S. R., & Banerjee, S. (2014) · Journal of Microscopy and Ultrastructure · doi:10.1016/j.jmau.2014.06.001 · Cited by 37
Pacton, M., Breitenbach, S. F. M., Lechleitner, F. A., Вакс, А., Rollion‐Bard, C., Gutareva, O. S., Osintcev, A. V., & Vásconcelos, C. (2013) · Biogeosciences · doi:10.5194/bg-10-6115-2013 · Cited by 36
Microbial Biogeography of Arctic Streams: Exploring Influences of Lithology and Habitat
Larouche, J. R., Bowden, W. B., Giordano, R., Flinn, M. B., & Crump, B. C. (2012) · Frontiers in Microbiology · doi:10.3389/fmicb.2012.00309 · Cited by 34
Baskar, S., Baskar, R., Lee, N., Kaushik, A. K., & Theophilus, P. K. (2007) · Environmental Geology · doi:10.1007/s00254-007-1159-y · Cited by 32
Cacchio, P., Ercole, C., Contento, R., Cappuccio, G., Martinez, M. P., Gallo, M. D., & Lepidi, A. A. (2012) · Journal of Cave and Karst Studies · doi:10.4311/2010mb0136r · Cited by 32
Andrei, A., Pausan, M.-R., Tămaş, T., Har, N., Barbu–Tudoran, L., Leopold, N., & Banciu, H. L. (2017) · Frontiers in Microbiology · doi:10.3389/fmicb.2017.00372 · Cited by 29
Jones, B. (2010) · Sedimentary Geology · doi:10.1016/j.sedgeo.2010.03.004 · Cited by 28
Microbial Community Diversity of Moonmilk Deposits at Ballynamintra Cave, Co. Waterford, Ireland
Rooney, D. C., Hutchens, E., Clipson, N., Baldini, J. U. L., & McDermott, F. P. (2010) · Microbial Ecology · doi:10.1007/s00248-010-9693-7 · Cited by 24
Environmental implications of competitive growth fabrics in stalactitic carbonate
Broughton, P. L. (1983) · International Journal of Speleology · doi:10.5038/1827-806x.13.1.3 · Cited by 24
Müller, W. E. G., Neufurth, M., Schloßmacher, U., Schröder, H. C., Pisignano, D., & Wang, X. (2013) · RSC Advances · doi:10.1039/c3ra45193c · Cited by 23
Minerals and speleothems of the József-hegy Cave (Budapest, Hungary)
Leél‐Őssy, S., Szanyi, G., & Surányi, G. (2011) · International Journal of Speleology · doi:10.5038/1827-806x.40.2.11 · Cited by 22
Morphological and mechanical characterization of composite calcite/SWCNT–COOH single crystals
Calvaresi, M., Falini, G., Pasquini, L., Reggi, M., Fermani, S., Gazzadi, G. C., Frabboni, S., & Zerbetto, F. (2013) · Nanoscale · doi:10.1039/c3nr01568h · Cited by 21
Moonmilk Mineralogy in Some Romanian and Norwegian Caves
Onac, B. P., & Ghergari, L. (1993) · Digital Commons - University of South Florida (University of South Florida) · Cited by 20
Comparative study of carp otolith hardness: Lapillus and asteriscus
Ren, D., Meyers, M. A., Zhou, B., & Feng, Q. (2012) · Materials Science and Engineering C · doi:10.1016/j.msec.2012.10.015 · Cited by 18
Eberhard, S. M. (2004) · Murdoch University Research Portal · Cited by 17
Lattice deformation and curvature in stalactitic carbonate
Broughton, P. L. (1983) · International Journal of Speleology · doi:10.5038/1827-806x.13.1.2 · Cited by 13
Secondary origin of the radial fabric in stalactitic carbonate
Broughton, P. L. (1983) · International Journal of Speleology · doi:10.5038/1827-806x.13.1.4 · Cited by 11
Minerals of Jenolan Caves, New South Wales, Australia: Geological and biological interactions
Pogson, R. E., Osborne, R., & Colchester, D. M. (2019) · Proceedings of the Linnean Society of New South Wales · doi:10.5281/zenodo.16061742 · Cited by 5
Research works printed but not linked: 8
- Eberhard, 2011, Impacts of drying climate on aquatic cave fauna in Jewel cave and other caves in Southwest Western Australia., J. Australas. Cave Karst Manag. Assoc., 83, 6
- 2016, Margaret River Western Australia.
- Hill, 1986, Cave Minerals of the World
- Hill, 1997, Cave Minerals of the World.
- Hoffman, 1991, VDLUFA-Methodenbuch: Die Untersuchung von Böden
- Jasinska, 1997, Fauna of Aquatic Root Mats in Caves of Southwestern Australia: Origins and Ecology.
- Skinner, 2004, “Biomineralization,” in, Biochemistry, 117
- White, 1962, Introduction to the symposium on cave mineralogy., Natl. Speleol. Soc. Bull., 24, 55
Cited by
Stockbridge, R. B., & Wackett, L. P. (2024) · Nature Communications · doi:10.1038/s41467-024-49018-1 · Cited by 80
Lü, X., He, Q., Wang, Z., Cao, M., Zhao, J., Jiang, J., Zhao, R., & Zhang, H. (2019) · Chemical Geology · doi:10.1016/j.chemgeo.2019.119331 · Cited by 26
Metadata
- Authors
- Dhami, N. K., Mukherjee, A., & Watkin, E. L. J.
- Venue
- Frontiers in Microbiology
- Publisher
- Frontiers Media SA
- Published
- 2018-02-02
- Volume
- 9
- ISSN
- 1664-302X
- PMC
- PMC5810276
- Cited by
- 73
- References
- 95
- Funders
- Curtin University of Technology
About these checks
Registry, retraction, Cites and statistics results are computed, not judged, with one exception: a printed reference that no index lists is read once by a model before it counts as a citation error. Claims are extracted by a model and kept only when their quote appears verbatim in the text; each cited source is then checked, with a model’s help, for whether it says what the claim relies on. Those verdicts can be wrong — read the claim’s quote and the cited source before relying on one.
Statistics and arithmetic are recomputed, not judged.
Confidence bands are shown only for fields calibrated on our annotated test set. None is calibrated yet, so no band is shown.
What counts as a claim ›How we measure confidence ›How we check this ›
Are you an author, or do you see a problem with this page? Request a review
Data sources
Bibliographic data: Semantic Scholar, OpenAlex, Crossref.
Contains information from the Semantic Scholar Academic Graph Datasets, made available under the ODC Attribution License (ODC-BY 1.0).
Semantic Scholar’s data is described in: Kinney, R., et al. (2023). The Semantic Scholar Open Data Platform. arXiv:2301.10140.
