

The DOI matches its Crossref record; 2 of the 2 references it cites were found in a registry or an index.
An AI-based approach for detecting cells and microbial byproducts in low volume scanning electron microscope images of biofilms
Abstract
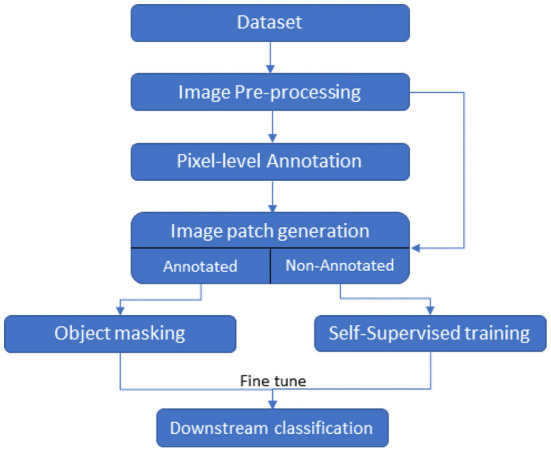
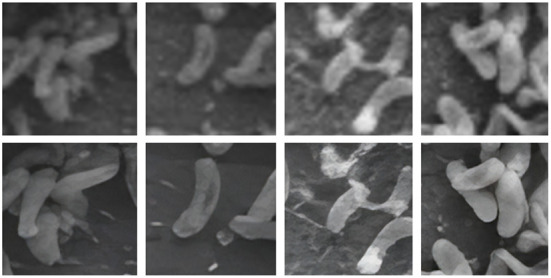
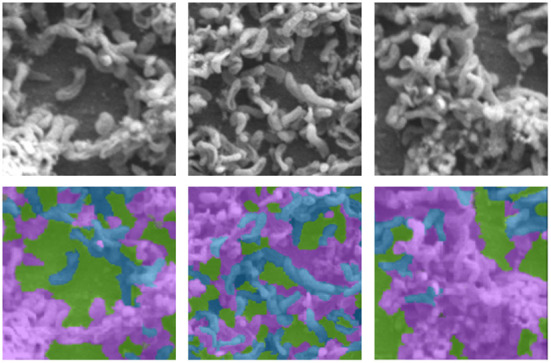
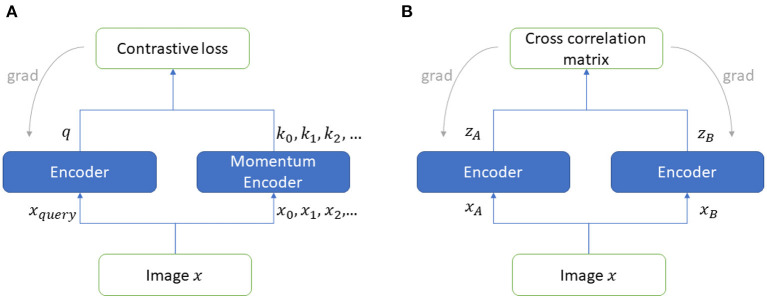
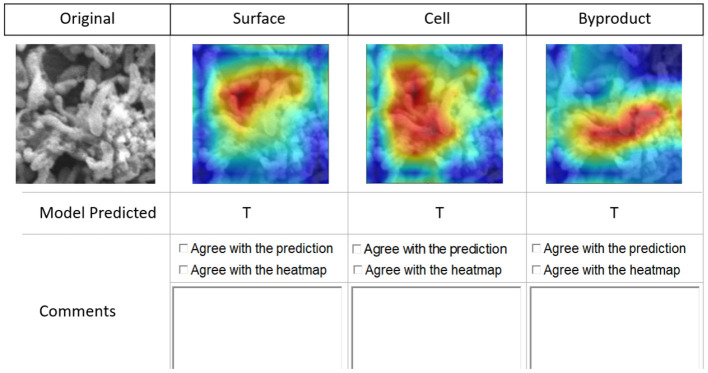
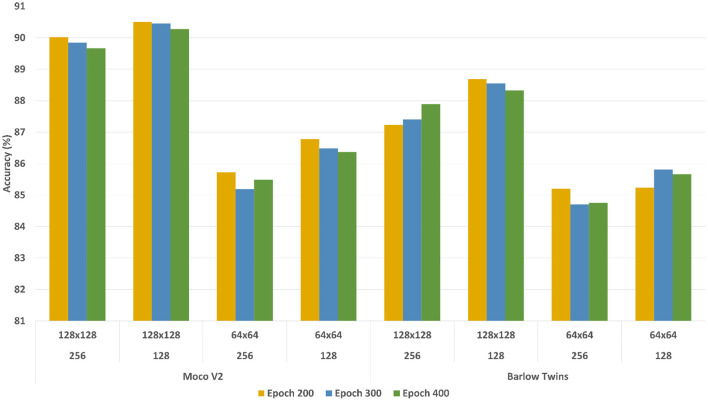
Microbially induced corrosion (MIC) of metal surfaces caused by biofilms has wide-ranging consequences. Analysis of biofilm images to understand the distribution of morphological components in images such as microbial cells, MIC byproducts, and metal surfaces non-occluded by cells can provide insights into assessing the performance of coatings and developing new strategies for corrosion prevention. We present an automated approach based on self-supervised deep learning methods to analyze Scanning Electron Microscope (SEM) images and detect cells and MIC byproducts. The proposed approach develops models that can successfully detect cells, MIC byproducts, and non-occluded surface areas in SEM images with a high degree of accuracy using a low volume of data while requiring minimal expert manual effort for annotating images. We develop deep learning network pipelines involving both contrastive (Barlow Twins) and non-contrastive (MoCoV2) self-learning methods and generate models to classify image patches containing three labels—cells, MIC byproducts, and non-occluded surface areas. Our experimental results based on a dataset containing seven grayscale SEM images show that both Barlow Twin and MoCoV2 models outperform the state-of-the-art supervised learning models achieving prediction accuracy increases of approximately 8 and 6%, respectively. The self-supervised pipelines achieved this superior performance by requiring experts to annotate only ~10% of the input data. We also conducted a qualitative assessment of the proposed approach using experts and validated the classification outputs generated by the self-supervised models. This is perhaps the first attempt toward the application of self-supervised learning to classify biofilm image components and our results show that self-supervised learning methods are highly effective for this task while minimizing the expert annotation effort.
Overview
The claims and statistics of this paper haven’t been checked yet.
Run the check — free, no account needed. It reads the open-access text and checks the sources it cites.
Integrity signals
Registry
Cites
Statistics
Figures
Verification
Claims the paper makes
The claims and statistics of this paper haven’t been checked yet.
Run the check — free, no account needed. It reads the open-access text and checks the sources it cites.
Claims other papers make about this one
Each is checked against this paper’s own text: does it say what the citing paper says it does?
In the citing paper
“Deep-learning procedures based on convolutional neural networks have already been utilized to automate the SEM image analysis. However, such solutions have been practiced mostly in the context of material sciences.61-64”
From SEMTWIST Quantification of Biofilm Infection in Human Chronic Wound Using Scanning Electron Microscopy and Machine Learning (2025) · cites this paper as [61]
Self-check
Percentages, sums and reported differences re-computed from the paper’s own numbers.
The self-check needs the paper’s full text.
Citations
Cites
Distinctive Image Features from Scale-Invariant Keypoints
Lowe, D. G. (2004) · International Journal of Computer Vision · doi:10.1023/b:visi.0000029664.99615.94 · Cited by 55,589
Embracing imperfect datasets: A review of deep learning solutions for medical image segmentation
Tajbakhsh, N., Jeyaseelan, L., Li, Q., Chiang, J. N., Wu, Z., & Ding, X. (2020) · Medical Image Analysis · doi:10.1016/j.media.2020.101693 · Cited by 1,095 · cited 1×
“Due to the large volume of expert annotated images needed to train these models several alternative machine learning methods that work with scant annotated data are being developed (Tajbakhsh et al., 2020; Chakravarthy et al., 2022), Self-supervised learning is a popular method categorized under the techniques support…”
Background
Research works printed but not linked: 44
- Atha, 2018, Evaluation of deep learning approaches based on convolutional neural networks for corrosion detection, Struct. Health Monitor, 17, 1110, 10.1177/1475921717737051 · DOI
- Azizi, 2021, Big self-supervised models advance medical image classification, arXiv preprint arXiv:2101.05224, 10.1109/ICCV48922.2021.00346 · DOI · Paper page
- Balestriero, 2022, Contrastive and non-contrastive self-supervised learning recover global and local spectral embedding methods, arXiv preprint arXiv:2205.11508, 10.48550/arXiv.2205.11508 · DOI
- Barlow, 1961, Possible principles underlying the transformation of sensory messages, Sensory Commun, 1, 217, 10.7551/mitpress/9780262518420.003.0013 · DOI
- Bay, 2006, Surf: speeded up robust features,”, 404
- Bogachev, 2018, Fast and simple tool for the quantification of biofilm-embedded cells sub-populations from fluorescent microscopic images, PLoS ONE, 13, e0193267, 10.1371/journal.pone.0193267 · DOI
- Bommanapally, 2021, Self-supervised learning approach to detect corrosion products in biofilm images,”, 3555, 10.1109/BIBM52615.2021.9669343 · DOI
- Buetti-Dinh, 2019, Deep neural networks outperform human expert's capacity in characterizing bioleaching bacterial biofilm composition, Biotechnol. Rep, 22, e00321, 10.1016/j.btre.2019.e00321 · DOI
- Chakravarthy, 2022, Semantic image segmentation using scant pixel annotations, Mach. Learn. Knowledge Extract, 4, 621, 10.3390/make4030029 · DOI
- Chen, A simple framework for contrastive learning of visual representations,”, 1597
- Chen, Improved baselines with momentum contrastive learning, arXiv preprint arXiv:2003.04297, 10.48550/arXiv.2003.04297 · DOI
- Chen, 2020, Exploring simple siamese representation learning, arXiv preprint arXiv:2011.10566, 10.1109/CVPR46437.2021.01549 · DOI · Paper page
- Chilkoor, 2020, Hexagonal boron nitride for sulfur corrosion inhibition, ACS Nano, 14, 14809, 10.1021/acsnano.0c03625 · DOI
- Ciga, 2021, Overcoming the limitations of patch-based learning to detect cancer in whole slide images, Sci. Rep, 11, 1, 10.1038/s41598-021-88494-z · DOI
- Dedysh, 2015, Methylocapsa palsarum sp. nov., a methanotroph isolated from a subarctic discontinuous permafrost ecosystem, Int. J. Syst. Evol. Microbiol, 65, 3618, 10.1099/ijsem.0.000465 · DOI
- Dong, 2021, A survey on deep learning and its applications, Comput. Sci. Rev, 40, 100379, 10.1016/j.cosrev.2021.100379 · DOI
- Grill, 2020, Bootstrap your own latent: a new approach to self-supervised learning, arXiv preprint arXiv:2006.07733, 10.48550/arXiv.2006.07733 · DOI · Paper page
- Hartmann, 2021, Quantitative image analysis of microbial communities with biofilmq, Nature microbiology, 6, 151, 10.1038/s41564-020-00817-4 · DOI
- He, 2020, Momentum contrast for unsupervised visual representation learning,”, 9729
- He, 2016, Deep residual learning for image recognition,”, 770
- Hough, 1962, Method and means for recognizing complex patterns, US Patent 3069654
- Huang, 2019, Deep Learning: Fundamentals, Theory and Applications, 10.1007/978-3-030-06073-2 · DOI
- Jaiswal, 2020, A survey on contrastive self-supervised learning, Technologies, 9, 2, 10.3390/technologies9010002 · DOI · Paper page
- Jamaludin, 2017, Self-supervised learning for spinal MRIs,”, 294, 10.1007/978-3-319-67558-9_34 · DOI
- Kornblith, 2019, Do better imagenet models transfer better?”, 2661
- Lam, 2017, Automated detection of diabetic retinopathy using deep learning,”, 147
- Li, 2004, Lazy snapping, ACM Trans. Graph, 23, 303, 10.1145/1015706.1015719 · DOI
- Liang, 2021, SwinIR: image restoration using swin transformer,”, 1833
- Little, 2020, Microbially influenced corrosion–any progress?, Corrosion Sci, 170, 108641, 10.1016/j.corsci.2020.108641 · DOI
- Mian, 2006, Three-dimensional model-based object recognition and segmentation in cluttered scenes, IEEE Trans. Pattern Anal. Mach. Intell, 28, 1584, 10.1109/TPAMI.2006.213 · DOI
- Ragi, 2021, Artificial intelligence-driven image analysis of bacterial cells and biofilms, arXiv:2112.01577, 10.48550/597ARXIV.2112.01577 · DOI
- Rueden, 2017, Imagej2: Imagej for the next generation of scientific image data, BMC Bioinformatics, 18, 529, 10.1186/s12859-017-1934-z · DOI
- Soda, 2009, Aggregation of classifiers for staining pattern recognition in antinuclear autoantibodies analysis, IEEE Trans. Inform. Technol. Biomed, 13, 322, 10.1109/TITB.2008.2010855 · DOI
- Stoean, 2018, Deep learning for metal corrosion control: can convolutional neural networks measure inhibitor efficiency?”, 387, 10.1109/SYNASC.2018.00065 · DOI
- Susarla, 2021, Corrosion resistance of sulfur-selenium alloy coatings, Adv. Mater, 33, 2104467, 10.1002/adma.202104467 · DOI
- Tajbakhsh, 2019, Surrogate supervision for medical image analysis: effective deep learning from limited quantities of labeled data,”, 1251, 10.1109/ISBI.2019.8759553 · DOI
- Tian, 2021, Understanding self-supervised learning dynamics without contrastive pairs,”, 10268
- Tsai, 2022, Multi-scale patch-based representation learning for image anomaly detection and segmentation,”, 3992
- Wang, 2021, Real-ESRGAN: training real-world blind super-resolution with pure synthetic data,”, 1905
- Zaidi, 2022, A survey of modern deep learning based object detection models, Digit. Signal Process, 126, 103514, 10.1016/j.dsp.2022.103514 · DOI
- Zbontar, 2021, Barlow twins: self-supervised learning via redundancy reduction, arXiv preprint arXiv:2103.03230, 10.48550/ARXIV.2103.03230 · DOI
- Zhang, 2021, Designing a practical degradation model for deep blind image super-resolution,”, 4791
- Zhou, 2016, Learning deep features for discriminative localization,”, 10.1109/CVPR.2016.319 · DOI · Paper page
- Zhou, 2017, Multi-Label Learning, 10.1007/978-1-4899-7687-1_910 · DOI
Cited by
Sorted by citations
Singh, S., Muniz De Oliveira, F., Wang, C., Kumar, M., Xuan, Y., DeMazumder, D., Sen, C. K., & Roy, S. (2025) · Advances in Wound Care · doi:10.1089/wound.2024.0291 · Cited by 6
Metadata
- Authors
- Abeyrathna, D., Ashaduzzaman, M., Malshe, M., Kalimuthu, J., Gadhamshetty, V., Chundi, P., & Subramaniam, M.
- Venue
- Frontiers in Microbiology
- Publisher
- Frontiers Media SA
- Published
- 2022-12-01
- Volume
- 13
- ISSN
- 1664-302X
- PMC
- PMC9751328
- Cited by
- 17
- References
- 2
About these checks
Registry, retraction, Cites and statistics results are computed, not judged, with one exception: a printed reference that no index lists is read once by a model before it counts as a citation error. Claims are extracted by a model and kept only when their quote appears verbatim in the text; each cited source is then checked, with a model’s help, for whether it says what the claim relies on. Those verdicts can be wrong — read the claim’s quote and the cited source before relying on one.
Statistics and arithmetic are recomputed, not judged.
Confidence bands are shown only for fields calibrated on our annotated test set. None is calibrated yet, so no band is shown.
What counts as a claim ›How we measure confidence ›How we check this ›
Are you an author, or do you see a problem with this page? Request a review
