

The DOI matches its Crossref record; 12 of the 12 references it cites were found in a registry or an index.
Uncovering neuroinflammation-related modules and potential repurposing drugs for Alzheimer's disease through multi-omics data integrative analysis
Open accessAbstract
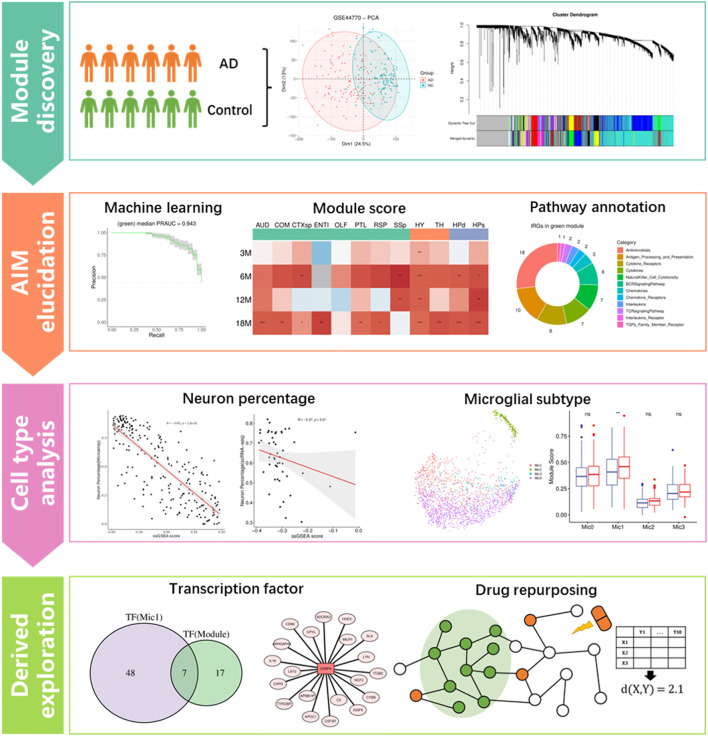
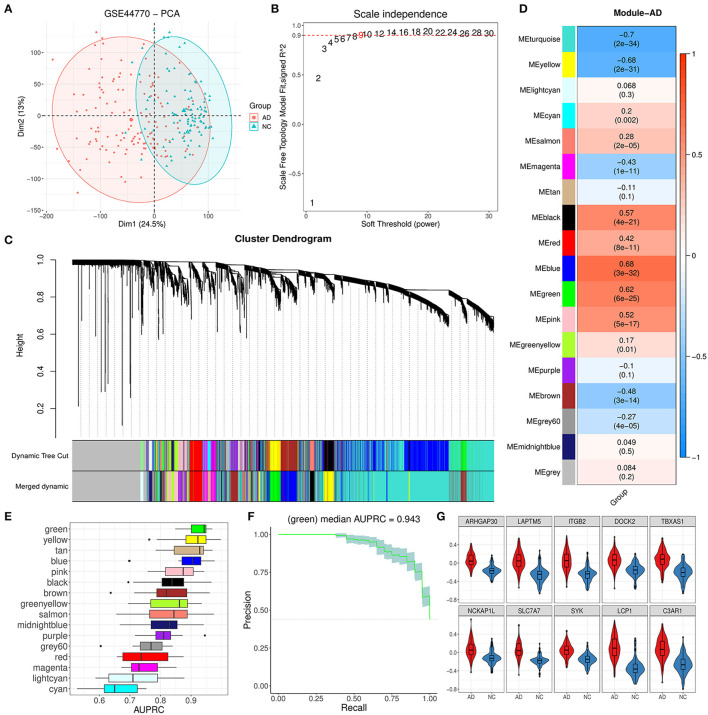
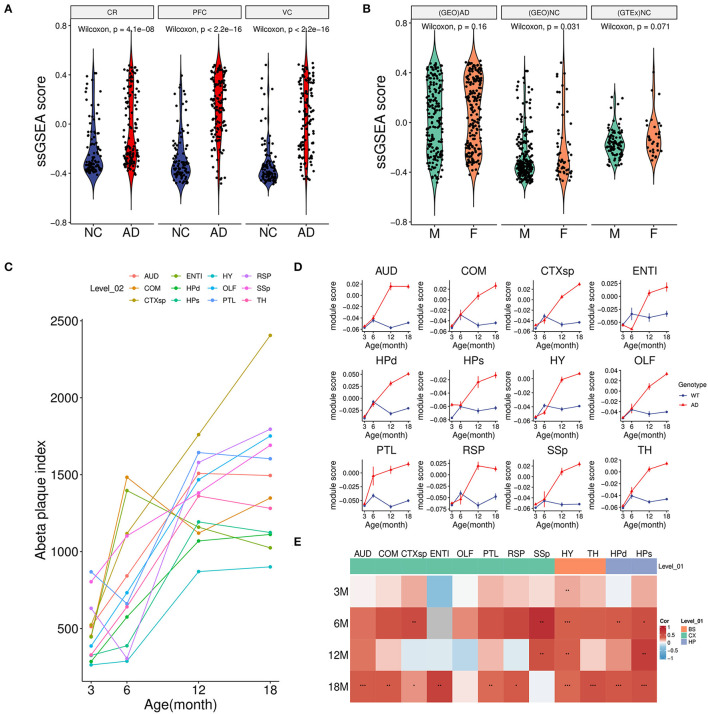
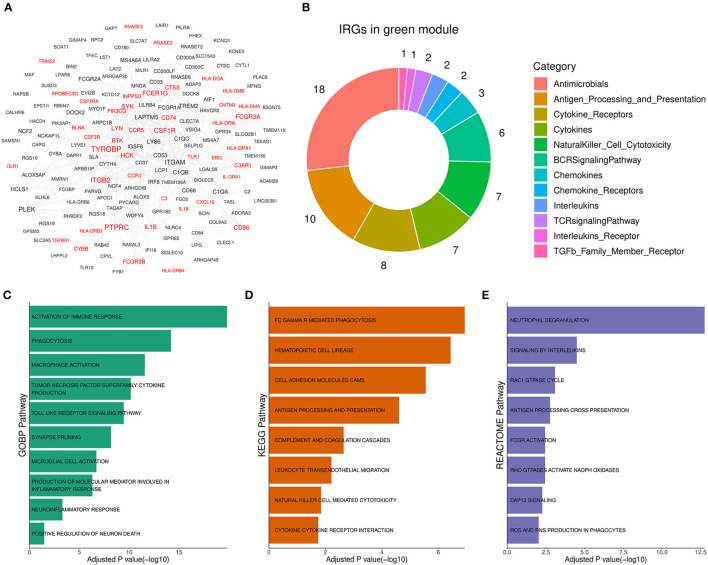
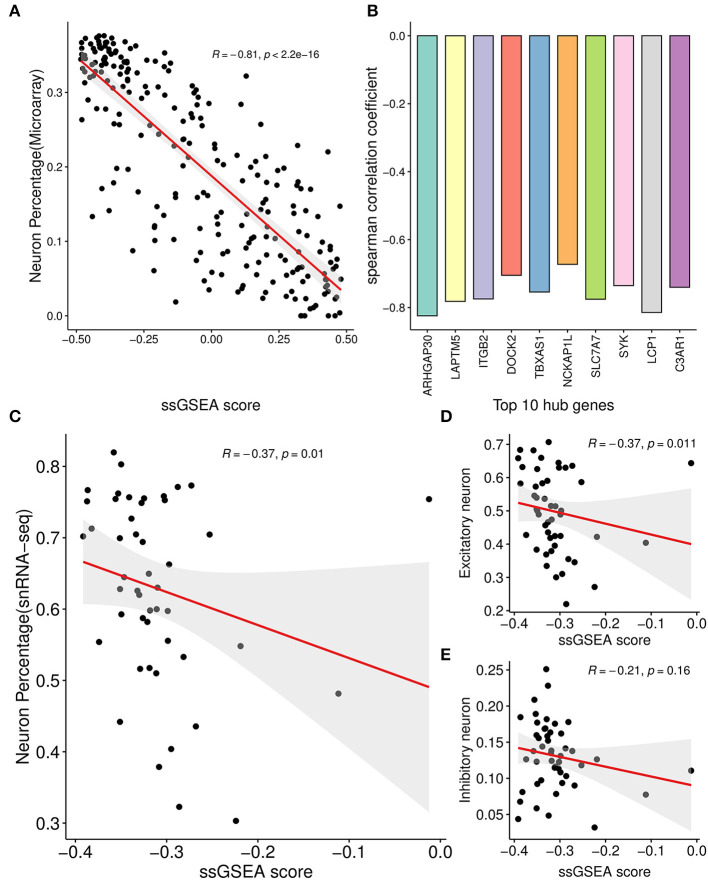
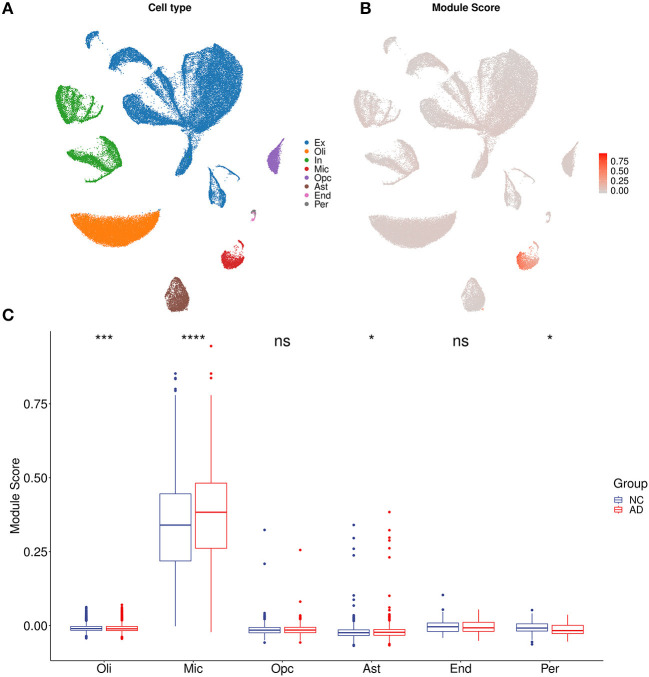
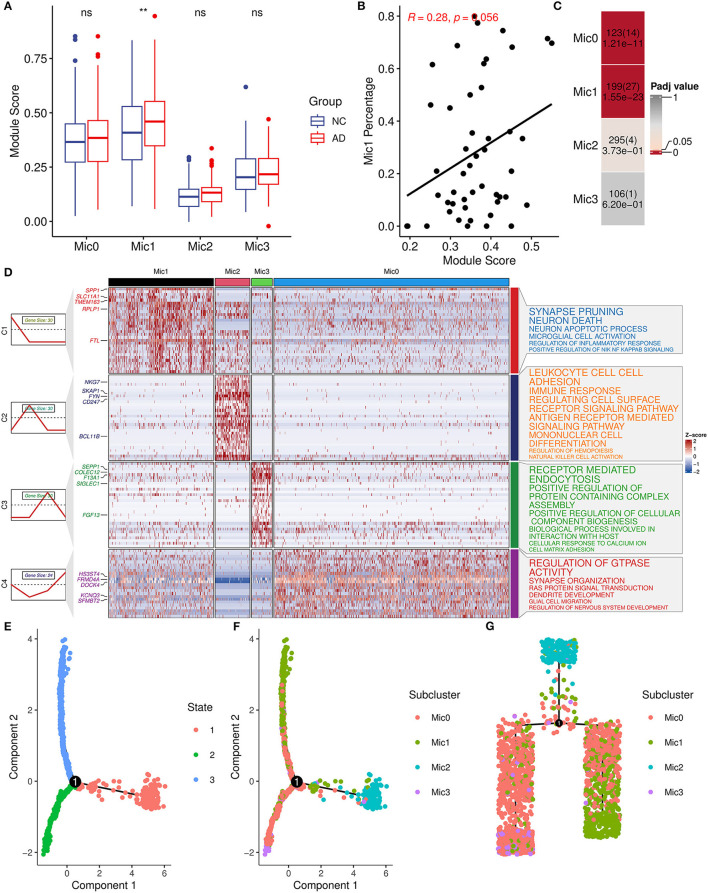
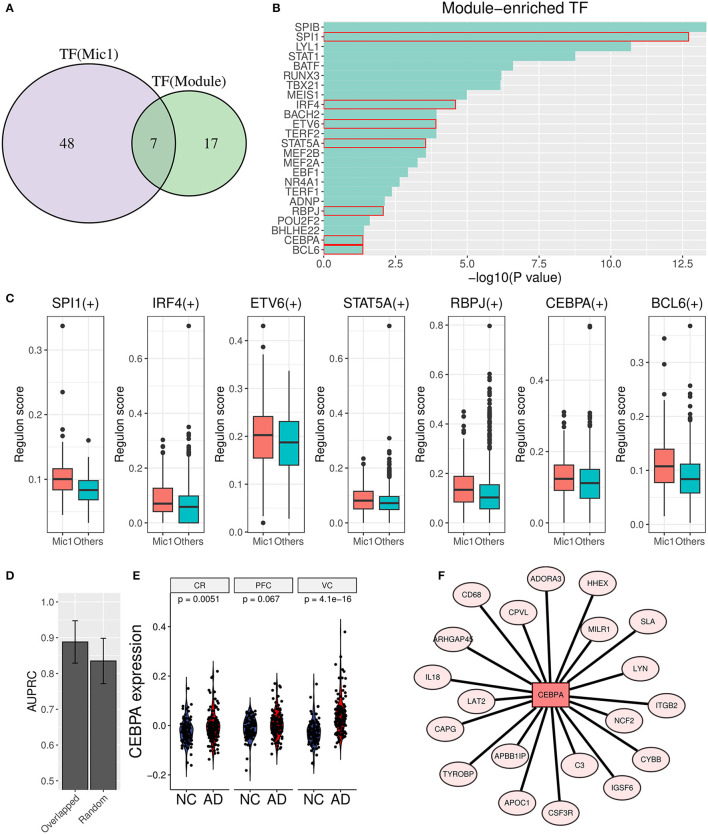
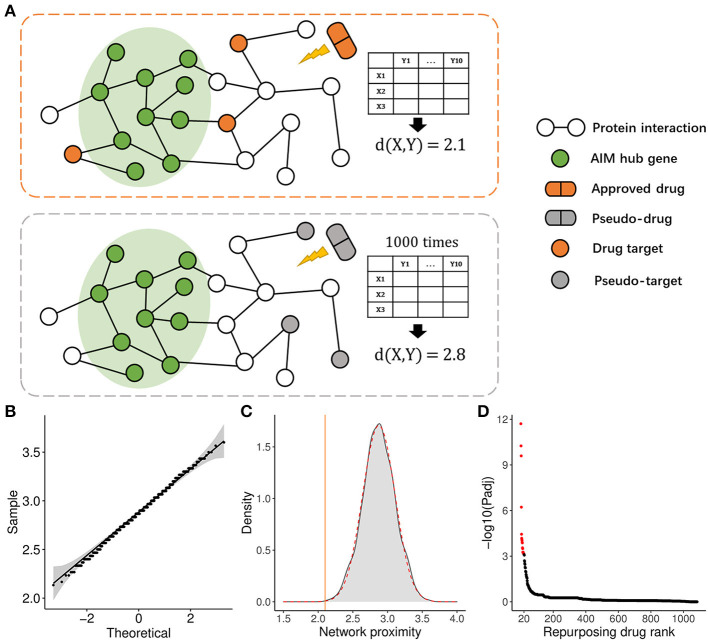
Background: Neuroinflammation is one of the key factors leading to neuron death and synapse dysfunction in Alzheimer's disease (AD). Amyloid-β (Aβ) is thought to have an association with microglia activation and trigger neuroinflammation in AD. However, inflammation response in brain disorders is heterogenous, and thus, it is necessary to unveil the specific gene module of neuroinflammation caused by Aβ in AD, which might provide novel biomarkers for AD diagnosis and help understand the mechanism of the disease. Methods: Transcriptomic datasets of brain region tissues from AD patients and the corresponding normal tissues were first used to identify gene modules through the weighted gene co-expression network analysis (WGCNA) method. Then, key modules highly associated with Aβ accumulation and neuroinflammatory response were pinpointed by combining module expression score and functional information. Meanwhile, the relationship of the Aβ-associated module to the neuron and microglia was explored based on snRNA-seq data. Afterward, transcription factor (TF) enrichment and the SCENIC analysis were performed on the Aβ-associated module to discover the related upstream regulators, and then a PPI network proximity method was employed to repurpose the potential approved drugs for AD. Results: A total of 16 co-expression modules were primarily obtained by the WGCNA method. Among them, the green module was significantly correlated with Aβ accumulation, and its function was mainly involved in neuroinflammation response and neuron death. Thus, the module was termed the amyloid-β induced neuroinflammation module (AIM). Moreover, the module was negatively correlated with neuron percentage and showed a close association with inflammatory microglia. Finally, based on the module, several important TFs were recognized as potential diagnostic biomarkers for AD, and then 20 possible drugs including ibrutinib and ponatinib were picked out for the disease. Conclusion: In this study, a specific gene module, termed AIM, was identified as a key sub-network of Aβ accumulation and neuroinflammation in AD. Moreover, the module was verified as having an association with neuron degeneration and inflammatory microglia transformation. Moreover, some promising TFs and potential repurposing drugs were presented for AD based on the module. The findings of the study shed new light on the mechanistic investigation of AD and might make benefits the treatment of the disease.
Overview
The claims and statistics of this paper haven’t been checked yet.
Run the check — free, no account needed. It reads the open-access text and checks the sources it cites.
Integrity signals
Registry
Cites
Statistics
Figures
Verification
Claims the paper makes
The claims and statistics of this paper haven’t been checked yet.
Run the check — free, no account needed. It reads the open-access text and checks the sources it cites.
Claims other papers make about this one
Each is checked against this paper’s own text: does it say what the citing paper says it does?
The check wasn’t confident either way, so it gives no verdict — never disputed.
In the citing paper
“Other network-centric models, including AlzGPS, map genetic variants onto protein interaction networks to identify modifiable disease nodes. One such node, ATP6V1A, was found to be pharmacologically targetable, with compounds like pioglitazone modulating its associated neuroinflammatory pathways251,334,337,339,340.”
From Artificial intelligence-driven multi-omics approaches in Alzheimer's disease: Progress, challenges, and future directions (2025) · cites this paper as [334]
Experimental — accuracy not yet measured
Self-check
Percentages, sums and reported differences re-computed from the paper’s own numbers.
The self-check needs the paper’s full text.
Citations
Cites
Neuropathological stageing of Alzheimer-related changes.
Braak, H., & Braak, E. (1991) · Acta Neuropathologica · doi:10.1007/bf00308809 · Cited by 16,123
Microglia Sculpt Postnatal Neural Circuits in an Activity and Complement-Dependent Manner
Schafer, D. P., Lehrman, E. K., Kautzman, A. G., Koyama, R., Mardinly, A. R., Yamasaki, R., Ransohoff, R. M., Greenberg, M. E., Barres, B. A., & Stevens, B. (2012) · Neuron · doi:10.1016/j.neuron.2012.03.026 · Cited by 4,089
Microglia as a source and target of cytokines
Hanisch, U. (2002) · Glia · doi:10.1002/glia.10161 · Cited by 1,645 · cited 1×
“Aβ cascade hypothesis supposes amyloid plaque is a major cause of neuron death and synapse dysfunction (Hardy and Higgins, 1992).”
BackgroundAlzheimer’s Disease: The Challenge of the Second Century
Holtzman, D. M., Morris, J. C., & Goate, A. M. (2011) · Science Translational Medicine · doi:10.1126/scitranslmed.3002369 · Cited by 1,424
ChEA3: transcription factor enrichment analysis by orthogonal omics integration
Keenan, A. B., Torre, D., Lachmann, A., Leong, A. K., Wojciechowicz, M. L., Utti, V., Jagodnik, K. M., Kropiwnicki, E., Wang, Z., & Ma’ayan, A. (2019) · Nucleic Acids Research · doi:10.1093/nar/gkz446 · Cited by 1,136
Integrating single-cell and spatial transcriptomics to elucidate intercellular tissue dynamics
Longo, S. K., Guo, M. G., Ji, A. L., & Khavari, P. A. (2021) · Nature Reviews Genetics · doi:10.1038/s41576-021-00370-8 · Cited by 1,059
ARUK Consortium, Sims, R., GERAD/PERADES, C., van der Lee, S. J., Naj, A. C., Bellenguez, C., Badarinarayan, N., Jakobsdottir, J., Kunkle, B. W., Boland, A., et al. (2017) · Nature Genetics · doi:10.1038/ng.3916 · Cited by 1,012
Self-citationNeuronal subtypes and diversity revealed by single-nucleus RNA sequencing of the human brain
Lake, B. B., Ai, R., Kaeser, G. E., Salathia, N. S., Yung, Y. C., Liu, R., Wildberg, A., Gao, D., Fung, H.-L., Chen, S., et al. (2016) · Science · doi:10.1126/science.aaf1204 · Cited by 957
The amyloid hypothesis in Alzheimer disease: new insights from new therapeutics
Karran, E., & De Strooper, B. (2022) · Nature Reviews Drug Discovery · doi:10.1038/s41573-022-00391-w · Cited by 742
Dhapola, R., Hota, S. S., Sarma, P., Bhattacharyya, A., Medhi, B., & Reddy, D. H. (2021) · Inflammopharmacology · doi:10.1007/s10787-021-00889-6 · Cited by 383
TREM2 Acts Downstream of CD33 in Modulating Microglial Pathology in Alzheimer's Disease
Griciuc, A., Patel, S., Federico, A. N., Choi, S. H., Innes, B. J., Oram, M. K., Cereghetti, G., McGinty, D., Anselmo, A., Sadreyev, R. I., et al. (2019) · Neuron · doi:10.1016/j.neuron.2019.06.010 · Cited by 378
Immune Signaling in Neurodegeneration
Hammond, T. R., Marsh, S. E., & Stevens, B. (2019) · Immunity · doi:10.1016/j.immuni.2019.03.016 · Cited by 336
Research works printed but not linked: 49
- Akiyama, 2000, Inflammation and Alzheimer's disease, Neurobiol. Aging, 21, 383, 10.1016/S0197-4580(00)00124-X · DOI · Paper page
- Andrews, 2021, Tutorial: guidelines for the computational analysis of single-cell RNA sequencing data, Nat. Protoc., 16, 1, 10.1038/s41596-020-00409-w · DOI
- Chen, 2019, Ponatinib protects mice from lethal influenza infection by suppressing cytokine storm, Front. Immunol., 10, 1393, 10.3389/fimmu.2019.01393 · DOI
- Cheng, 2019, Network-based prediction of drug combinations, Nat. Commun., 10, 1197, 10.1038/s41467-019-09186-x · DOI
- Cheng, 2021, Microglial Calhm2 regulates neuroinflammation and contributes to Alzheimer's disease pathology, Sci. Adv, 7, abe3600, 10.1126/sciadv.abe3600 · DOI
- Cheng, 2014, Btk inhibition targets in vivo CLL proliferation through its effects on B-cell receptor signaling activity, Leukemia, 28, 649, 10.1038/leu.2013.358 · DOI
- Doig, 2017, Why is research on amyloid-β failing to give new drugs for Alzheimer's disease?, ACS Chem. Neurosci., 8, 1435, 10.1021/acschemneuro.7b00188 · DOI
- Etienne-Manneville, 2002, Rho Gtpases in cell biology, Nature, 420, 629, 10.1038/nature01148 · DOI
- Feng, 2022, Integrative analysis from multicenter studies identifies a WGCNA-derived cancer-associated fibroblast signature for ovarian cancer, Front. Immunol., 13, 951582, 10.3389/fimmu.2022.951582 · DOI
- Fu, 2019, Targeting neuroinflammation as a therapeutic strategy for Alzheimer's disease: mechanisms, drug candidates, and new opportunities, ACS Chem. Neurosci., 10, 872, 10.1021/acschemneuro.8b00402 · DOI
- Gao, 2019, Transcriptional regulation of homeostatic and disease-associated-microglial genes by IRF1, LXRβ, and CEBPα, Glia, 67, 1958, 10.1002/glia.23678 · DOI
- 2022, Estimation of the global prevalence of dementia in 2019 and forecasted prevalence in 2050: an analysis for the global burden of disease study 2019, Lancet Public Health, 7, e105, 10.1016/S2468-2667(21)00249-8 · DOI · Paper page
- Gomez Perdiguero, 2015, Tissue-resident macrophages originate from yolk-sac-derived erythro-myeloid progenitors, Nature, 518, 547, 10.1038/nature13989 · DOI · Paper page
- Griciuc, 2021, The role of innate immune genes in Alzheimer's disease, Curr. Opin. Neurol., 34, 228, 10.1097/WCO.0000000000000911 · DOI
- Han, 2020, Regorafenib regulates Ad pathology, neuroinflammation, and dendritic spinogenesis in cells and a mouse model of Ad, Cells, 9, 1655, 10.3390/cells9071655 · DOI
- Hardy, 1992, Alzheimer's disease: the amyloid cascade hypothesis, Science, 256, 184, 10.1126/science.1566067 · DOI · Paper page
- Heneka, 2015, Neuroinflammation in Alzheimer's disease, Lancet Neurol., 14, 388, 10.1016/S1474-4422(15)70016-5 · DOI · Paper page
- Jain, 2021, Role of Jak/Stat in the neuroinflammation and its association with neurological disorders, Ann Neurosci, 28, 191, 10.1177/09727531211070532 · DOI
- Jansen, 2019, Genome-wide meta-analysis identifies new loci and functional pathways influencing Alzheimer's disease risk, Nat. Genet., 51, 404, 10.1038/s41588-018-0311-9 · DOI · Paper page
- Jin, 2021, Inference and analysis of cell-cell communication using cellchat, Nat. Commun., 12, 1088, 10.1038/s41467-021-21246-9 · DOI · Paper page
- Keren-Shaul, 2017, A unique microglia type associated with restricting development of Alzheimer's disease, Cell, 169, 1276, 10.1016/j.cell.2017.05.018 · DOI · Paper page
- Kolodziejczyk, 2015, The technology and biology of single-cell RNA sequencing, Mol. Cell, 58, 610, 10.1016/j.molcel.2015.04.005 · DOI · Paper page
- Kulminski, 2022, Definitive roles of Tomm40-Apoe-Apoc1 variants in the Alzheimer's risk, Neurobiol. Aging, 110, 122, 10.1016/j.neurobiolaging.2021.09.009 · DOI
- Kumar, 2021, Inference of gene regulatory network from single-cell transcriptomic data using pyscenic, Methods Mol. Biol., 2328, 171, 10.1007/978-1-0716-1534-8_10 · DOI
- Langfelder, 2008, Wgcna: an R package for weighted correlation network analysis, BMC Bioinformatics, 9, 559, 10.1186/1471-2105-9-559 · DOI · Paper page
- Lannfelt, 2014, Amyloid-ß-directed immunotherapy for Alzheimer's disease, J. Intern. Med., 275, 284, 10.1111/joim.12168 · DOI
- Lee, 2021, Ibrutinib modulates Aβ/Tau pathology, neuroinflammation, and cognitive function in mouse models of Alzheimer's disease, Aging Cell, 20, e13332, 10.1111/acel.13332 · DOI
- Leng, 2021, Neuroinflammation and microglial activation in Alzheimer disease: where do we go from here?, Nat. Rev. Neurol., 17, 157, 10.1038/s41582-020-00435-y · DOI · Paper page
- Leroy, 2005, CEBPA point mutations in hematological malignancies, Leukemia, 19, 329, 10.1038/sj.leu.2403614 · DOI
- Li, 2021, Ibrutinib alleviates LPS-induced neuroinflammation and synaptic defects in a mouse model of depression, Brain Behav. Immun., 92, 10, 10.1016/j.bbi.2020.11.008 · DOI
- Lin, 2021, Role of calcium signaling pathway-related gene regulatory networks in ischemic stroke based on multiple WGCNA and single-cell analysis, Oxid. Med. Cell. Longev., 2021, 8060477, 10.1155/2021/8060477 · DOI
- Lin, 2022, Ponatinib modulates the metabolic profile of obese mice by inhibiting adipose tissue macrophage inflammation, Front. Pharmacol., 13, 1040999, 10.3389/fphar.2022.1040999 · DOI
- Mathys, 2019, Single-cell transcriptomic analysis of Alzheimer's disease, Nature, 570, 332, 10.1038/s41586-019-1195-2 · DOI · Paper page
- Micheau, 2003, Induction of Tnf receptor I-mediated apoptosis via two sequential signaling complexes, Cell, 114, 181, 10.1016/S0092-8674(03)00521-X · DOI · Paper page
- Miguel-Álvarez, 2015, Non-steroidal anti-inflammatory drugs as a treatment for Alzheimer's disease: a systematic review and meta-analysis of treatment effect, Drugs Aging, 32, 139, 10.1007/s40266-015-0239-z · DOI
- Mishra, 2012, Synapse loss induced by interleukin-1β requires pre- and post-synaptic mechanisms, J. Neuroimmune Pharmacol., 7, 571, 10.1007/s11481-012-9342-7 · DOI · Paper page
- Nam, 2018, Ibrutinib suppresses LPS-induced neuroinflammatory responses in Bv2 microglial cells and wild-type mice, J. Neuroinflammation, 15, 271, 10.1186/s12974-018-1308-0 · DOI
- Nguyen, 2017, Differential Kv1.3, Kca3.1, and Kir2.1 expression in “classically” and “alternatively” activated microglia, Glia, 65, 106, 10.1002/glia.23078 · DOI · Paper page
- Obradovic, 2021, Single-cell protein activity analysis identifies recurrence-associated renal tumor macrophages, Cell, 184, 2988, 10.1016/j.cell.2021.04.038 · DOI
- Ousman, 2012, Immune surveillance in the central nervous system, Nat. Neurosci., 15, 1096, 10.1038/nn.3161 · DOI
- Plescher, 2018, Plaque-dependent morphological and electrophysiological heterogeneity of microglia in an Alzheimer's disease mouse model, Glia, 66, 1464, 10.1002/glia.23318 · DOI
- Sampath, 2017, Cognitive dysfunction in major depression and Alzheimer's disease is associated with hippocampal-prefrontal cortex dysconnectivity, Neuropsychiatr. Dis. Treat., 13, 1509, 10.2147/NDT.S136122 · DOI
- Sun, 2022, Acetylcholine deficiency disrupts extratelencephalic projection neurons in the prefrontal cortex in a mouse model of Alzheimer's disease, Nat. Commun., 13, 998, 10.1038/s41467-022-28493-4 · DOI
- Tan, 2020, Microglial regional heterogeneity and its role in the brain, Mol. Psychiatry, 25, 351, 10.1038/s41380-019-0609-8 · DOI · Paper page
- Wilhelmson, 2020, Ccaat enhancer binding protein alpha (CEBPA) biallelic acute myeloid leukaemia: cooperating lesions, molecular mechanisms and clinical relevance, Br. J. Haematol., 190, 495, 10.1111/bjh.16534 · DOI
- Xue, 2021, Large-scale sequencing studies expand the known genetic architecture of Alzheimer's disease, Alzheimers. Dement., 13, e12255, 10.1002/dad2.12255 · DOI
- Yu, 2017, Mir-124 contributes to M2 polarization of microglia and confers brain inflammatory protection via the C/Ebp-α pathway in intracerebral hemorrhage, Immunol. Lett., 182, 1, 10.1016/j.imlet.2016.12.003 · DOI · Paper page
- Yu, 2015, Microglial Aβ receptors in Alzheimer's disease, Cell. Mol. Neurobiol., 35, 71, 10.1007/s10571-014-0101-6 · DOI · Paper page
- Yuksel, 2019, Trafficking and proteolytic processing of amyloid precursor protein and secretases in Alzheimer's disease development: an up-to-date review, Eur. J. Pharmacol., 856, 172415, 10.1016/j.ejphar.2019.172415 · DOI
Cited by
Sorted by citations
Ren, F., Wei, J., Chen, Q., Hu, M., Yu, L., Mi, J., Zhou, X., Qin, D., Wu, J., & Wu, A. (2025) · Acta Pharmaceutica Sinica B · doi:10.1016/j.apsb.2025.07.030 · Cited by 97
Metadata
- Authors
- Li, S., Lu, C., Zhao, Z., Lu, D., & Zheng, G.
- Affiliations
- Shanghai University of Traditional Chinese Medicine (CN)
- University of Sassari (IT)
- Corresponding author
- Lu, Dong
- Zheng, Guangyong
- Venue
- Frontiers in Aging Neuroscience
- Publisher
- Frontiers Media SA
- Published
- 2023-06-02
- Volume
- 15
- Pages
- 1161405-1161405
- ISSN
- 1663-4365 (ISSN-L)
- PMC
- PMC10272561
- OpenAlex
- W4379185140
- Cited by
- 12
- References
- 12
- Citations by year
- 2026: 2 · 2025: 3 · 2024: 7
- FWCI
- 1.24
- Type
- journal article
- Language
- en
- Open access
- gold
- doi.org
- Licence
- Locations
- Frontiers in Aging Neuroscience (publishedVersion, cc-by)
- PubMed Central (publishedVersion, cc-by)
- PubMed (publishedVersion)
- DOAJ (DOAJ: Directory of Open Access Journals) (submittedVersion, cc-by-sa)
- Funders
- National Natural Science Foundation of China (82104521)
- Universidade de Macau
- Topics
- Life Sciences › Neuroscience › Neurology › Neuroinflammation and Neurodegeneration Mechanisms
- Life Sciences › Neuroscience › Cellular and Molecular Neuroscience › Alzheimer's disease research and treatments
- Health Sciences › Medicine › Psychiatry and Mental health › Dementia and Cognitive Impairment Research
- Keywords
- Alzheimer's disease, neuroinflammation, amyloid-beta, microglial activation, gene co-expression modules, drug repurposing, neuronal cell death, diagnostic biomarkers, ibrutinib, ponatinib
About these checks
Registry, retraction, Cites and statistics results are computed, not judged, with one exception: a printed reference that no index lists is read once by a model before it counts as a citation error. Claims are extracted by a model and kept only when their quote appears verbatim in the text; each cited source is then checked, with a model’s help, for whether it says what the claim relies on. Those verdicts can be wrong — read the claim’s quote and the cited source before relying on one.
Statistics and arithmetic are recomputed, not judged.
Confidence bands are shown only for fields calibrated on our annotated test set. None is calibrated yet, so no band is shown.
What counts as a claim ›How we measure confidence ›How we check this ›
Are you an author, or do you see a problem with this page? Request a review
