

The DOI matches its Crossref record; 63 of the 63 references it cites were found in a registry or an index.
Microglia Morphological Categorization in a Rat Model of Neuroinflammation by Hierarchical Cluster and Principal Components Analysis
Open accessAbstract
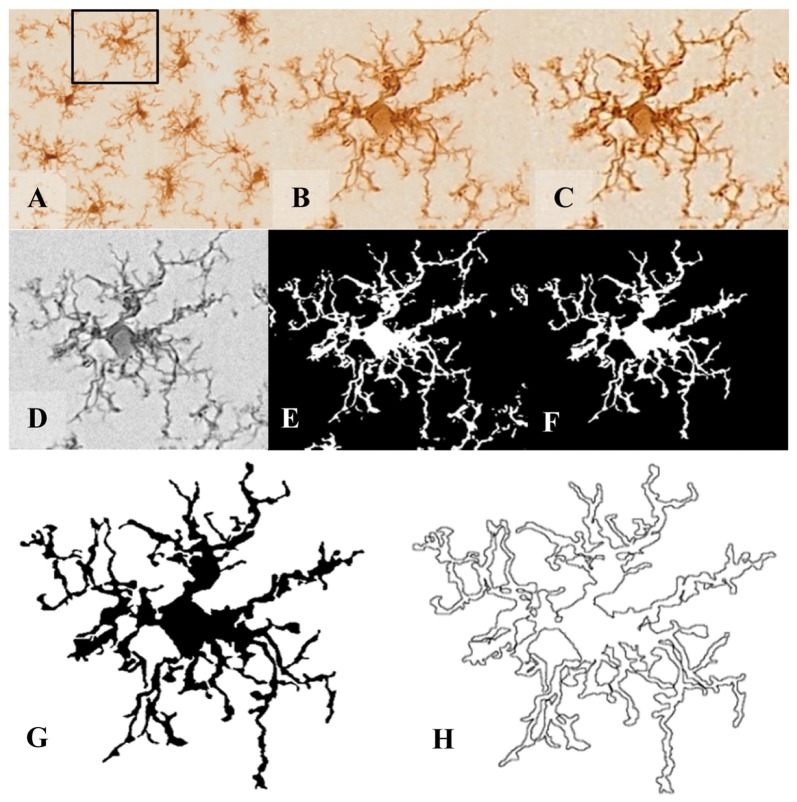
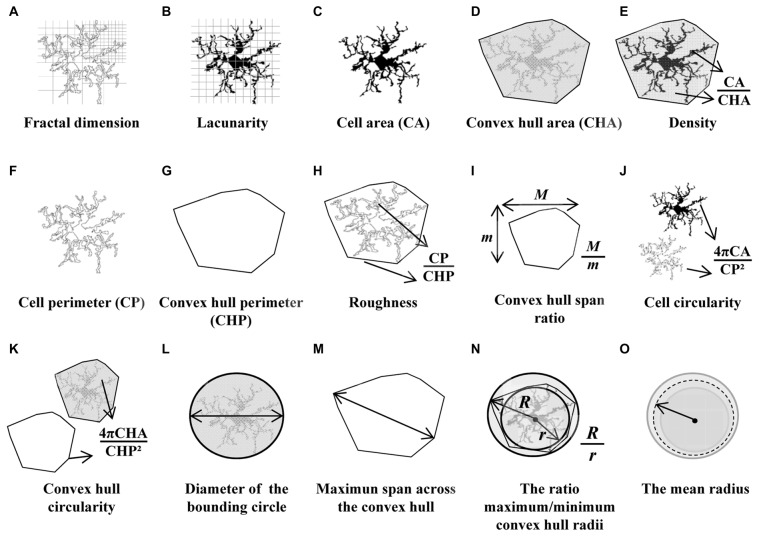
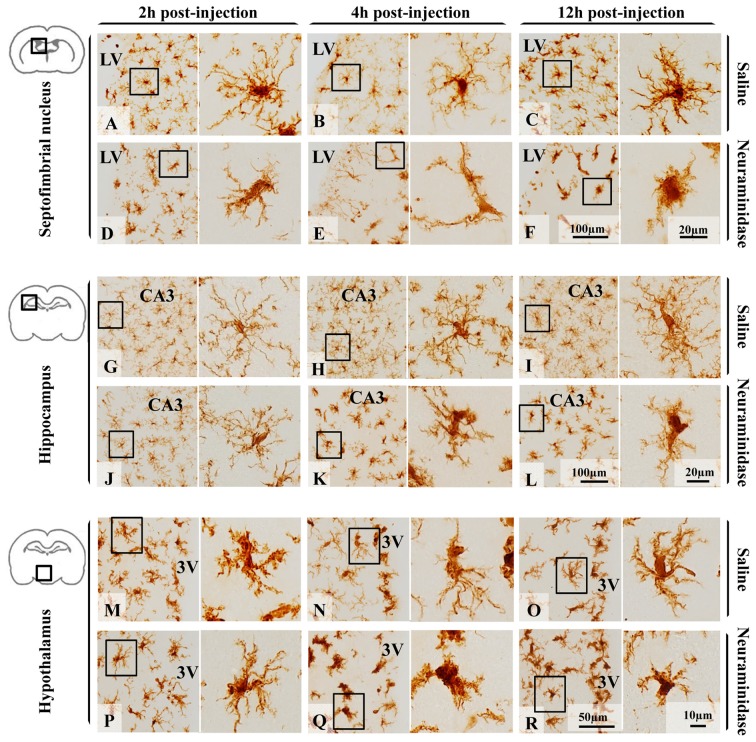
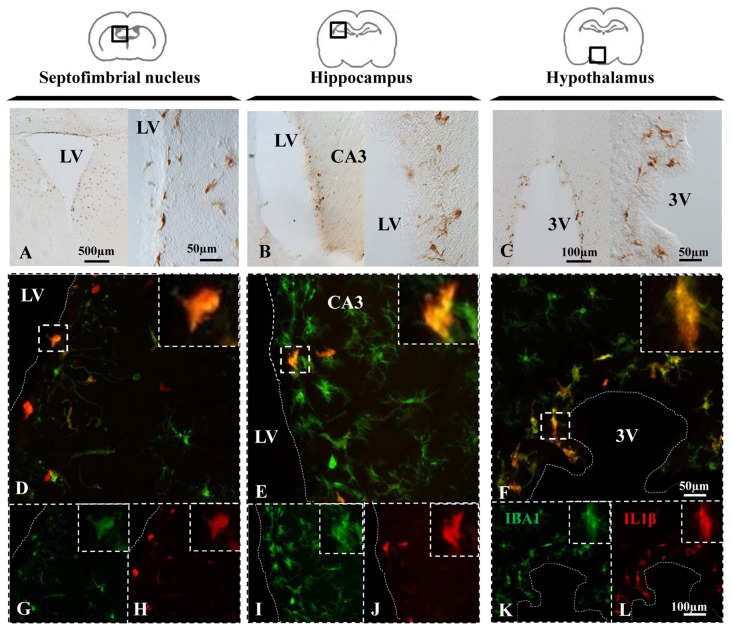
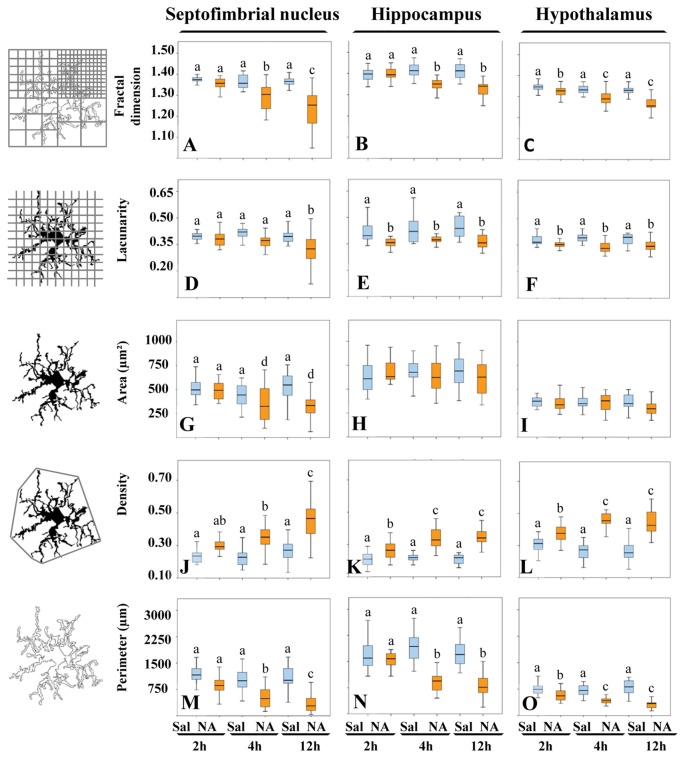
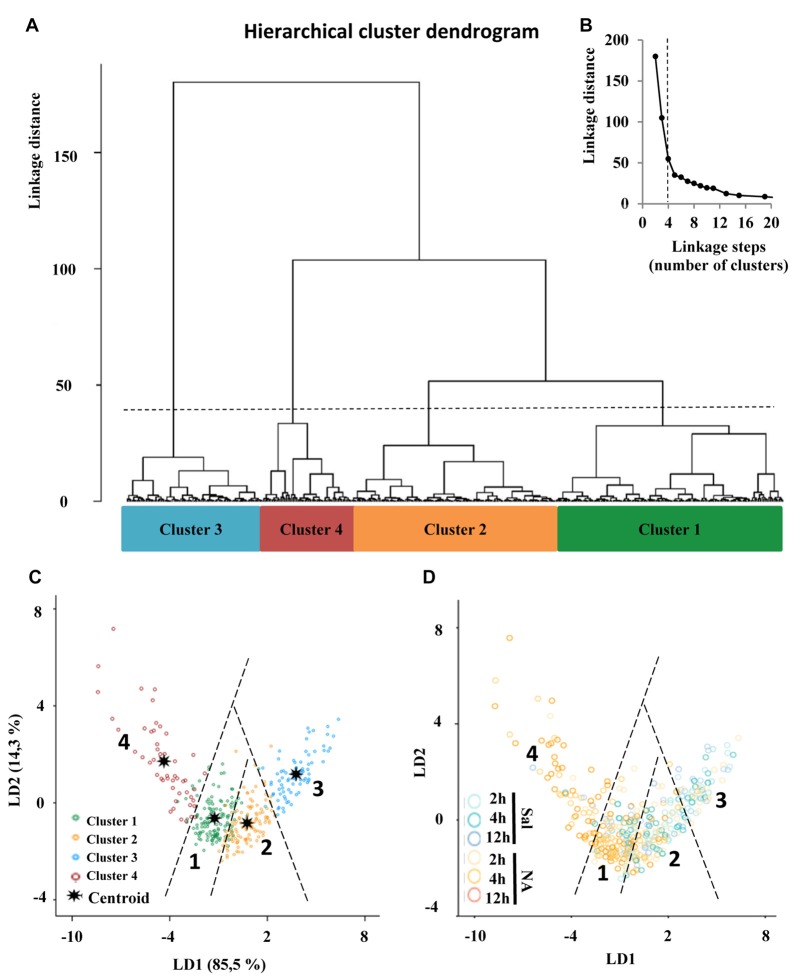
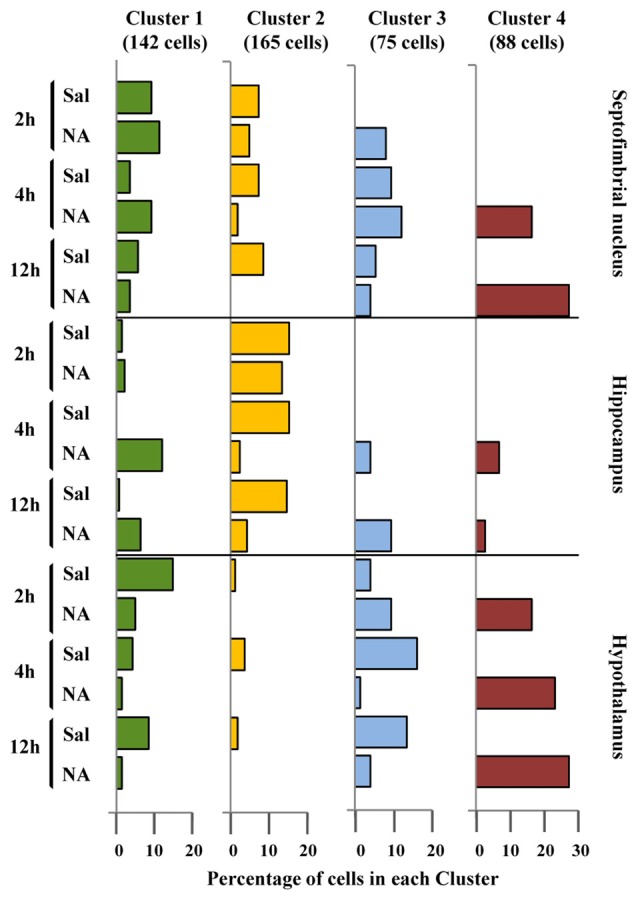
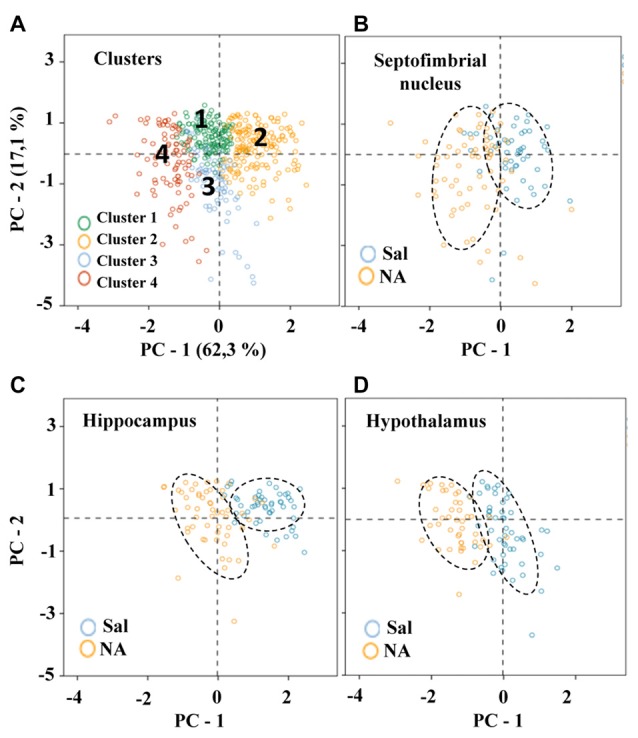
It is known that microglia morphology and function are closely related, but only few studies have subjectively described different morphological subtypes. To address this issue, morphological parameters of microglial cells were analyzed in a rat model of aseptic neuroinflammation. After the injection of a single dose of the enzyme neuraminidase within the lateral ventricle an acute inflammatory process occurs. Sections from NA-injected animals and sham controls were immunolabeled with the microglial marker IBA1, which highlights ramifications and features of the cell shape. Using images obtained by section scanning, individual microglial cells were sampled from various regions (septofimbrial nucleus, hippocampus and hypothalamus) at different times post-injection (2, 4 and 12 hours). Each cell yielded a set of 15 morphological parameters by means of image analysis software. Five initial parameters (including fractal measures) were statistically different in cells from NA-injected rats (most of them IL-1β positive, i.e. M1-state) compared to those from control animals (none of them IL-1β positive, i.e. surveillant state). However, additional multimodal parameters were revealed more suitable for hierarchical cluster analysis. This method pointed out the classification of microglia population in four clusters. Furthermore, a linear discriminant analysis suggested three specific parameters to objectively classify any microglia by a decision tree. In addition, a principal components analysis revealed two extra valuable variables that allowed to further classifying microglia in a total of eight sub-clusters or types. The spatio-temporal distribution of these different morphotypes in our rat inflammation model allowed to relate specific morphotypes with microglial activation status and brain location. An objective method for microglia classification based on morphological parameters is proposed.
Overview
The claims and statistics of this paper haven’t been checked yet.
Run the check — free, no account needed. It reads the open-access text and checks the sources it cites.
Integrity signals
Registry
Cites
Statistics
Figures
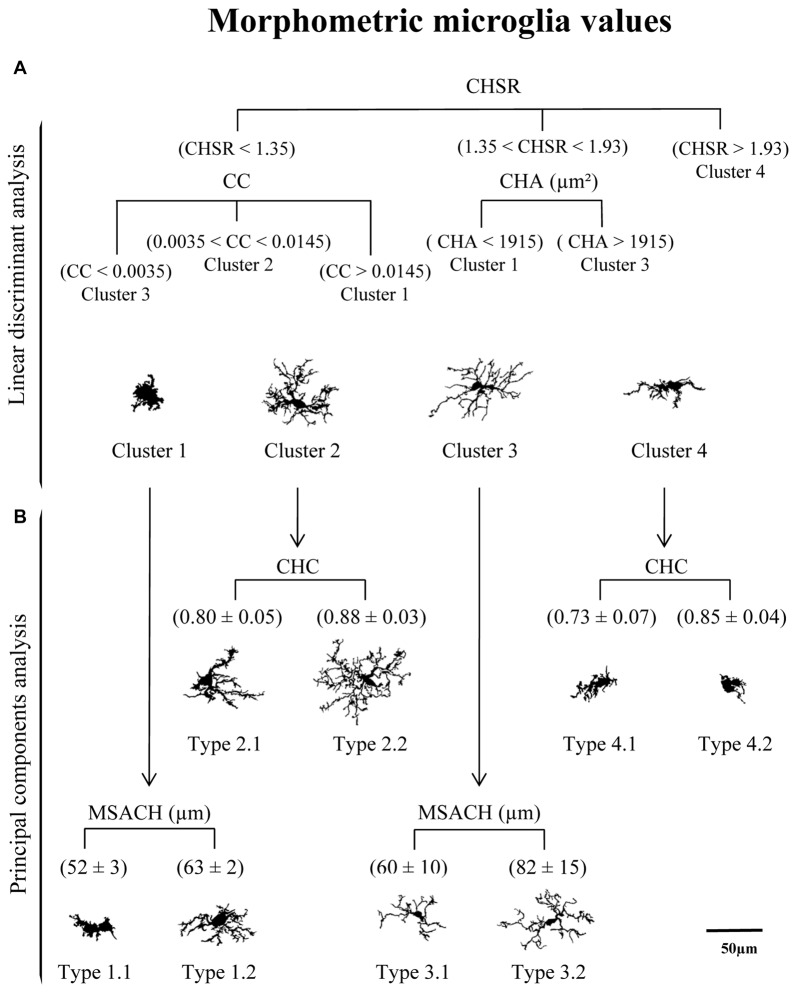
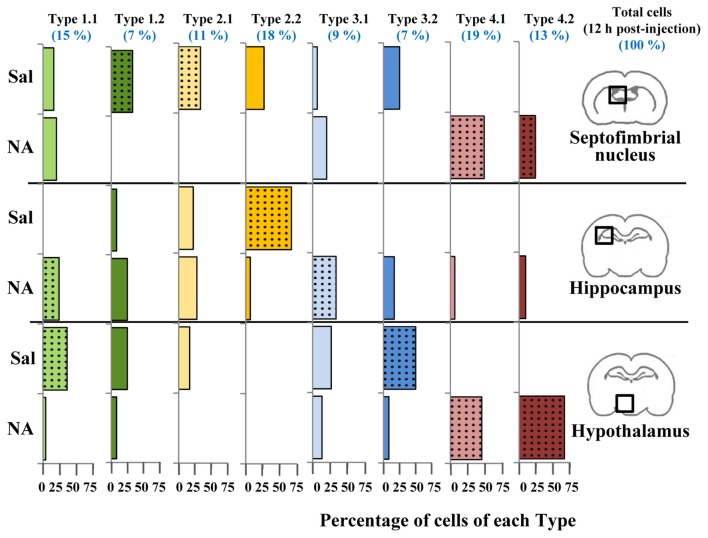
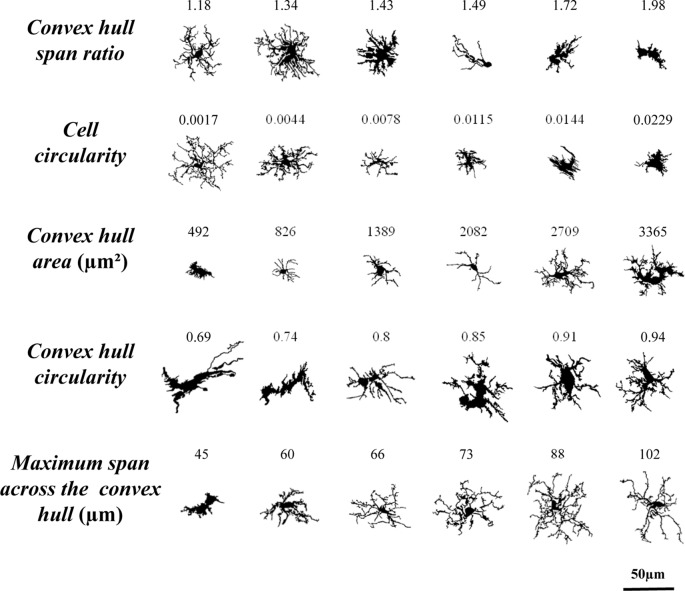
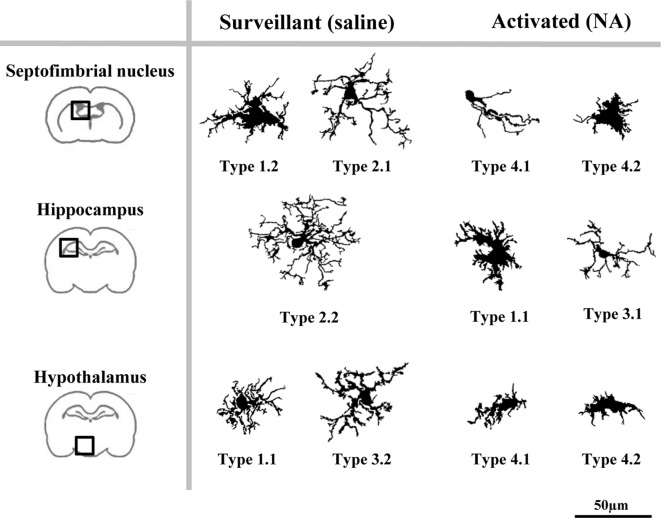
Verification
Claims the paper makes
The claims and statistics of this paper haven’t been checked yet.
Run the check — free, no account needed. It reads the open-access text and checks the sources it cites.
Claims other papers make about this one
Each is checked against this paper’s own text: does it say what the citing paper says it does?
The cited source says what the claim attributes to it.
In the citing paper
“We found that, upon LPS/ATP treatment, iMG infused into our tubular organoids displayed a lower complexity in patterns as well as a spherical shape, exemplified by lower fractal dimensions, lower lacunarity, and higher convex-hull circularity (Figure 6c).56”
From Tubular human brain organoids to model microglia-mediated neuroinflammation (2021) · cites this paper as [56]
Self-check
Percentages, sums and reported differences re-computed from the paper’s own numbers.
The self-check needs the paper’s full text.
Citations
Cites
The Rat Brain in Stereotaxic Coordinates
Paxinos, G., & Watson, C. (1983) · Elsevier eBooks · doi:10.1016/c2009-0-63235-9 · Cited by 28,585
The Fractal Geometry of Nature
Mandelbrot, B. B., & WHEELER, J. A. (1983) · American Journal of Physics · doi:10.1119/1.13295 · Cited by 21,964
Hierarchical Grouping to Optimize an Objective Function
Ward, J. H. (1963) · Journal of the American Statistical Association · doi:10.1080/01621459.1963.10500845 · Cited by 21,341
THE USE OF MULTIPLE MEASUREMENTS IN TAXONOMIC PROBLEMS
FISHER, R. A. (1936) · Annals of Eugenics · doi:10.1111/j.1469-1809.1936.tb02137.x · Cited by 15,227
Resting microglial cells are highly dynamic surveillants of brain parenchyma in vivo
Nimmerjahn, A., Kirchhoff, F., & Helmchen, F. (2005) · Science · doi:10.1126/science.1110647 · Cited by 5,827
A dendrite method for cluster analysis
Caliński, T., & Harabasz, J. (1974) · Communications in Statistics · doi:10.1080/03610927408827101 · Cited by 4,480
Synaptic Pruning by Microglia Is Necessary for Normal Brain Development
Paolicelli, R. C., Bolasco, G., Pagani, F., Maggi, L., Scianni, M., Panzanelli, P., Giustetto, M., Ferreira, T. A., Guiducci, E., Dumas, L., et al. (2011) · Science · doi:10.1126/science.1202529 · Cited by 4,244
Microglia Sculpt Postnatal Neural Circuits in an Activity and Complement-Dependent Manner
Schafer, D. P., Lehrman, E. K., Kautzman, A. G., Koyama, R., Mardinly, A. R., Yamasaki, R., Ransohoff, R. M., Greenberg, M. E., Barres, B. A., & Stevens, B. (2012) · Neuron · doi:10.1016/j.neuron.2012.03.026 · Cited by 4,089
Kettenmann, H., Hanisch, U.-K., Noda, M., & Verkhratsky, A. (2011) · Physiological Reviews · doi:10.1152/physrev.00011.2010 · Cited by 3,547
Hierarchical Grouping to Optimize an Objective Function
Ward, J. H. (1963) · Journal of the American Statistical Association · doi:10.2307/2282967 · Cited by 3,294
Research works printed but not linked: 4
- Río-Hortega, El “tercer elemento de los centros nerviosos”. I. La microglía en estado normal, Boletín Soc. Española Biol., 8, 67
- Río-Hortega, El “tercer elemento de los centros nerviosos”. II. Intervención de la microglía en los procesos patológicos (células en bastoncito y cuerpos granuloadiposos), Boletín Soc. Española Biol., 8, 91
- Río-Hortega, El “tercer elemento de los centros nerviosos”. III. Naturaleza probable de la microglía, Boletín Soc. Española Biol., 8, 108
- Río-Hortega, El “tercer elemento de los centros nerviosos”. IV. Poder fagocitario y movilidad de la microglía, Boletín Soc. Española Biol., 8, 154
Cited by
Sorted by citations
Items 301–400 of 416
MorphoMacro for in vivo and ex vivo quantitative morphometric analysis of microglia
Melo, P., Silveira, M. S., Pinto, I. M., & Relvas, J. B. (2022) · Methods in cell biology · doi:10.1016/bs.mcb.2022.08.003 · Cited by 2
Classification of Activated Microglia by Convolutional Neural Networks
Hsu, C., Agaronyan, A., Raffensperger, K. V., Kadden, M., Ton, H. T., Wu, M.-F., Lin, Y.-S., Lee, Y., Wang, P. C., Shoykhet, M., et al. (2022) · IEEE Biomedical Circuits and Systems Conference (BioCAS) · doi:10.1109/biocas54905.2022.9948635 · Cited by 2
Guignet, M. A., Schmuck, M., Harvey, D. J., Nguyen, D. V., Bruun, D. A., Echeverri, A., Gurkoff, G. G., & Lein, P. J. (2023) · Heliyon · doi:10.1016/j.heliyon.2023.e13449 · Cited by 3
A Primary Neural Cell Culture Model for NeuroinflammationPreprint
Goshi, N., Morgan, R. K., Lein, P. J., & Şeker, E. (2020) · bioRxiv (Cold Spring Harbor Laboratory) · doi:10.1101/2020.01.23.914226 · Cited by 2
Lack of cortistatin drives neuroimmune and vascular dysfunction in brain ischemiaPreprint
Castillo-González, J., Vargas-Rodríguez, P., Serrano-Martínez, I., Cuenca-Martagón, A., Forte-Lago, I., Price, M., Buscemi, L., Hirt, L., Ruiz, J. L., & González-Rey, E. (2024) · bioRxiv (Cold Spring Harbor Laboratory) · doi:10.1101/2024.09.11.611691 · Cited by 2
Nieto-Quero, A., Infantes-López, M. I., Zambrana-Infantes, E. N., Chaves-Peña, P., Gavito, A., Munoz-Martin, J., Tabbai, S., Márquez, J., de Fonseca, F. R., Garcia‐Fernandez, M. I., et al. (2023) · Cells · doi:10.3390/cells12182290 · Cited by 1
Mujtaba, S., Patro, N., & Patro, I. K. (2025) · Annals of Neurosciences · doi:10.1177/09727531251324716 · Cited by 1
Chawla, V., Mendez, Y. S., Siebold, L., Vickery, J. C., Sacks, M., Mladenov, G., Radulescu, A., & Wilson, C. G. (2025) · World Journal of Pediatric Surgery · doi:10.1136/wjps-2025-001049 · Cited by 1
Boufidis, D., Krizman, E. N., Smith, C. M., Xie, Y., Garg, R., O’Donnell, J. C., Vitale, F., & Cullen, D. K. (2025) · Advanced Materials Interfaces · doi:10.1002/admi.202500261 · Cited by 1
Wrap it up: myelination of transplanted neurons for repair
Martínez-Reza, M. F., & Götz, M. (2025) · Frontiers in Cellular Neuroscience · doi:10.3389/fncel.2025.1635551 · Cited by 1
Ma, H., Bewick, G. S., & Huang, W. (2025) · European Journal of Neuroscience · doi:10.1111/ejn.70286 · Cited by 1
Microglia Display Altered Spatial Morphology and Proteome After Stroke
Wanrooy, B. J., Wilson, J. L., Suthya, A. R., Bourne, J. H., Steele, J. R., Kahrood, H. V., Schittenhelm, R. B., Ballerin, G., Skinner, C., Wen, S., et al. (2025) · PROTEOMICS · doi:10.1002/pmic.70072 · Cited by 1
Ortega-Xique, A., Ordaz, B., Lorea-Hernández, J. J., & Peña‐Ortega, F. (2026) · Inflammation · doi:10.1007/s10753-026-02467-w · Cited by 1
Differential Cytokine Regulation in Microglial Endotoxin Tolerance
Kadiyala, S., Vakil, M. K., & Zhou, H. (2026) · Neuroglia · doi:10.3390/neuroglia7020013 · Cited by 1
Pasten-Castrejón, N. J., Martínez-Orozco, H., Gutiérrez-Silerio, G. Y., Hernández-Montiel, H. L., Maya-Arteaga, J. P., Poblano-Paez, I., García‐Solís, P., & Díaz-Miranda, S. Y. (2026) · International Journal of Molecular Sciences · doi:10.3390/ijms27115022 · Cited by 1
Salia, S., Burry, N., Hinks, M., Sparkes, K. M., Randell, A. M., Maekawa, A. S., Reid, N., Fowler, L. F., Kelly, R. Q., Francis, J.-L., et al. (2026) · Journal of Neuroinflammation · doi:10.1186/s12974-026-03881-5 · Cited by 1
Boland, S. W., Coyner, G. N., Risen, S. J., Alsulami, A., McGrath, S., & Moreno, J. A. (2026) · Frontiers in Aging · doi:10.3389/fragi.2026.1829442 · Cited by 1
Lack of cortistatin drives neuroimmune and vascular dysfunction in brain ischemia
Castillo-González, J., Vargas-Rodríguez, P., Serrano-Martínez, I., Cuenca-Martagón, A., Forte‐Lago, I., Price, M., Buscemi, L., Hirt, L., Ruiz, J. L., & González‐Rey, E. (2026) · Journal of Biomedical Science · doi:10.1186/s12929-026-01271-w · Cited by 3
León‐Rodríguez, A., Fernández‐Arjona, M. D. M., Pedraza, C., López‐Aranda, M. F., Visser, R., & López-Ávalos, M. D. (2026) · Frontiers in Immunology · doi:10.3389/fimmu.2026.1828445 · Cited by 1
Self-citationCarver, C. M., Gomez, P. T., Rodriguez, S. L., Redden, J. T., Latham, A. S., Ha, Y., Kachergus, J. M., Liu, Y., Shi, J., Tran, T., et al. (2026) · Nature Aging · doi:10.1038/s43587-026-01154-7 · Cited by 3
TLR4-mediated chronic neuroinflammation has no effect on tangle pathology in a tauopathy mouse model
Basheer, N., Muhammadi, M. K., Freites, C. L., Avila, M., Momand, M. U. D., Hryntsova, N. B., Smolek, T., Katina, S., & Žilka, N. (2024) · Frontiers in Aging Neuroscience · doi:10.3389/fnagi.2024.1468602 · Cited by 1
Prevosti, S., Passalacqua, A., Regondi, M. C., D'Ambrosio, G., Morano, A., Romoli, M., Maira, G., Villani, F., Mattioli, P., Franciotta, D. M., et al. (2025) · Epilepsia · doi:10.1111/epi.18600 · Cited by 1
Sakurai, L., Yoshimoto, R., Soya, S., & Sakurai, T. (2025) · Journal of Neuroscience · doi:10.1523/jneurosci.1035-25.2025 · Cited by 1
Microglia and border-associated macrophages in the central nervous system
Zanluqui, N. G., Polonio, C. M., de Oliveira, M. G., de Oliveira, L. G., Faria, L. C., & Peron, J. P. S. (2022) · Elsevier eBooks · doi:10.1016/b978-0-12-821385-8.00013-5 · Cited by 1
MORPHIOUS: A Machine Learning Workflow to Naively Detect the Activation of Microglia and AstrocytesPreprint
Silburt, J., & Aubert, I. (2020) · bioRxiv (Cold Spring Harbor Laboratory) · doi:10.1101/2020.08.17.251843 · Cited by 1
Stetzik, L. A., Mercado, G., Smith, L., Sonia, G., Emmanuel, Q., Luda, K. M., Emily, S., Lindsay, M., Lindquist, A., Bergsma, A. L., et al. (2022) · bioRxiv (Cold Spring Harbor Laboratory) · doi:10.1101/2022.03.11.483994 · Cited by 1
Systemic inflammation causes microglial dysfunction with a mixed AD-like pathologyPreprint
Bathini, P., Dupanloup, I., Zenaro, E., Terrabuio, E., Fischer, A., Ballabani, E., Doucey, M., & Alberi, L. A. (2020) · bioRxiv (Cold Spring Harbor Laboratory) · doi:10.1101/2020.07.27.223198 · Cited by 1
Investigation of microglial diversity in a mouse model of Parkinson’s disease pathologyPreprint
Iovino, L., VanderZwaag, J., Kaur, G., Khakpour, P., Giusti, V., Chiavegato, A., Lopes, L. T., Greggio, E., Tremblay, M., & Civiero, L. (2023) · bioRxiv (Cold Spring Harbor Laboratory) · doi:10.1101/2023.11.23.567809 · Cited by 1
Dissecting Reactive Astrocyte Responses: Lineage Tracing and Morphology-based ClusteringPreprint
Delgado‐García, L. M., Ojalvo‐Sanz, A. C., Nakamura, T. K. E., Martín-López, E., Porcionatto, M. A., & López‐Mascaraque, L. (2024) · bioRxiv (Cold Spring Harbor Laboratory) · doi:10.1101/2024.04.01.587565 · Cited by 1
Meseguer-Beltrán, M., Sánchez‐Sarasúa, S., Kerekes, N., Landry, M., Real‐López, M., & Sánchez‐Pérez, A. M. (2024) · bioRxiv (Cold Spring Harbor Laboratory) · doi:10.1101/2024.05.15.592910 · Cited by 1
Ganesan, K., Ghorbanpour, S. M., Kendall, W., Broome, S. T., Gladding, J. M., Dhungana, A., Abiero, A., Mahmoudi, M., Castorina, A., Kendig, M. D., et al. (2024) · bioRxiv (Cold Spring Harbor Laboratory) · doi:10.1101/2024.05.19.594460 · Cited by 1
MIC-MAC: High-throughput analysis of three-dimensional microglia morphology in mammalian brainsPreprint
Salamanca, L., Mechawar, N., Murai, K. K., Balling, R., Bouvier, D. S., & Skupin, A. (2018) · bioRxiv (Cold Spring Harbor Laboratory) · doi:10.1101/388397
Systemic Inflammation Causes Microglial Dysfunction with a Mixed AD-Like Pathology.Preprint
Bathini, P., Dupanloup, I., Zenaro, E., Terrabuio, E., Fisher, A., Babaliani, E., Doucey, M., & Alberi, L. A. (2020) · Research Square · doi:10.21203/rs.3.rs-48807/v1
Bryant, J. D., Kodali, M., Shuai, B., Menissy, S. S., Graves, P. J., Shetty, A. K., West, L. C., & West, A. P. (2020) · bioRxiv (Cold Spring Harbor Laboratory) · doi:10.1101/2020.08.28.271833
Early-life stress facilitates the development of Alzheimer’s disease pathology via angiopathyPreprint
Tanaka, T., Hirai, S., Hosokawa, M., Saito, T., Sakuma, H., Saido, T. C., Hasegawa, M., & Okado, H. (2020) · bioRxiv (Cold Spring Harbor Laboratory) · doi:10.1101/2020.04.27.062729
Antioxidant-loaded nanoparticles for the treatment of excitotoxicity in neurological disease
Liao, R. (2020) · ResearchWorks at the University of Washington (University of Washington)
p38α-MAPK-deficient myeloid cells ameliorate symptoms and pathology of APP-transgenic AD micePreprint
Luo, Q., Schnöder, L., Hao, W., Litzenburger, K., Decker, Y., Tomic, I., Menger, M. D., Fassbender, K. C., & Liu, Y. (2021) · bioRxiv (Cold Spring Harbor Laboratory) · doi:10.1101/2021.10.18.464870
Berthou, A., Bourgeon, P., & Vicard, V. (2013) · Quarterly selection of articles - Bulletin de la Banque de France
dos Reis, I. M. (2022) · Research Publications (Maastricht University) · doi:10.26481/dis.20220126im
Gabrielli, L., Piccirilli, G., Gabrielli, L., Bonasoni, M. P., Chiereghin, A., Turello, G., Caterina, B. E., Simonazzi, G., Felici, S., Leone, M., et al. (2022) · Research Square · doi:10.21203/rs.3.rs-1303512/v1
Sharon, A., Erez, H., & Spira, M. E. (2022) · bioRxiv (Cold Spring Harbor Laboratory) · doi:10.1101/2022.02.22.481449
Microglial reprogramming by Hv1 antagonism provides protection from inflammatory neurotoxicityPreprint
Hernández-Espinosa, D. R., Gale, J. R., Scrabis, M. G., & Aizenman, E. (2022) · Research Square · doi:10.21203/rs.3.rs-1527316/v1
Systemic inflammation causes microglial dysfunction with a mixed AD-like pathologyPreprint
Bathini, P., Dupanloup, I., Zenaro, E., Terrabuio, E., Fischer, A., Ballabani, E., Doucey, M., & Alberi, L. A. (2021) · Research Square · doi:10.21203/rs.3.rs-145868/v1
Systemic Inflammation Causes Microglial Dysfunction With a Mixed Ad-like PathologyPreprint
Bathini, P., Dupanloup, I., Zenaro, E., Terrabuio, E., Fisher, A., Babaliani, E., Doucey, M., & Alberi, L. A. (2020) · Research Square · doi:10.21203/rs.3.rs-80087/v1
Carús-Cadavieco, M., Berenguer, I., Canelo, A. M., Serrano-Lope, M. A., de la Fuente, S. G., Fernández‐Rodrigo, A., Saido, T. C., Garcia, A., Venero, C., Esteban, J. A., et al. (2022) · Research Square · doi:10.21203/rs.3.rs-1869956/v1
Protective Effect of Bruton Tyrosine Kinase Inhibitor in Murine Model of Chronic DemyelinationPreprint
Pol, S. U., Dhanraj, R., Ding, Y., Taher, A., & Zivadinov, R. (2022) · Research Square · doi:10.21203/rs.3.rs-2090036/v1
Tsirka, S. E., Kokkosis, A. G., Madeira, M. M., Valais, K., & Hage, Z. (2022) · Research Square · doi:10.21203/rs.3.rs-1991809/v1
Téglás, T., Mihok, E., Cziáky, Z., Oláh, N.-K., Nyakas, C. J., & Máthé, E. (2022) · Preprints.org · doi:10.20944/preprints202210.0435.v1
Research Progress on the Role of DAP12 Mediated Microglia Activation in Nervous System
张, 童. (2022) · Advances in Clinical Medicine · doi:10.12677/acm.2022.12121728
Choi, S., Hill, D., Young, J., & Cordeiro, M. F. (2023) · Methods in cell biology · doi:10.1016/bs.mcb.2022.12.008
Kurnia, R. S., Silaen, O. S. M., Harun, V. H., Krisnamurti, D. G. B., Indrawati, A., Poetri, O. N., Natih, K. K. N., Tarigan, S., Ibrahim, F., Sudarmono, P. P., et al. (2023) · Research Square · doi:10.21203/rs.3.rs-2522908/v1
Reactive Changes in Rat Spinal Cord Microgliocytes under Acute Systemic Inflammation
Kolos, E. A., & Korzhevsky, D. E. (2023) · Journal of Evolutionary Biochemistry and Physiology · doi:10.1134/s002209302304021x
Kurnia, R. S., Soebandrio, A., Harun, V. H., Nugroho, C. M. H., Krisnamurti, D. G. B., Poetri, O. N., Indrawati, A., Tarigan, S., Natih, K. K. N., Ibrahim, F., et al. (2024) · Journal of Advanced Veterinary and Animal Research · doi:10.5455/javar.2023.j722
Rat primary cortical cell tri-culture to study effects of amyloid-beta on microglia functionPreprint
Kim, H., Le, B., Goshi, N., Zhu, K., Grodzki, A. C., Lein, P. J., Zhao, M., & Şeker, E. (2024) · bioRxiv (Cold Spring Harbor Laboratory) · doi:10.1101/2024.03.15.584736
Reactive Changes of Rat Spinal Cord Microgliocytes after Acute Systemic Inflammation
Kolos, E. A., & Korzhevsky, D. E. (2023) · Российский физиологический журнал им И М Сеченова · doi:10.31857/s0869813923070063
Stereological Approaches to Microglia Morphometry
García‐Magro, N., & Avendaño, C. (2024) · Neuromethods · doi:10.1007/978-1-0716-3977-1_3
Trejos, J., & Schanne, F. J. (2024) · Research Square · doi:10.21203/rs.3.rs-4682521/v1
Benkeder, S., Dinh, S.-M., Marchal, P., Gea, P. D., Thoby‐Brisson, M., Hubert, V., Hristovska, I., Pitollat, G., Combet, K., Cardoit, L., et al. (2024) · eLife · doi:10.7554/elife.101630.1
Benkeder, S., Dinh, S.-M., Marchal, P., Gea, P. D., Thoby‐Brisson, M., Hubert, V., Hristovska, I., Pitollat, G., Combet, K., Cardoit, L., et al. (2025) · eLife · doi:10.7554/elife.101630.2
Trejos, A. J., & Schanne, A. X. F. (2025) · Cellular and Molecular Neurobiology · doi:10.1007/s10571-025-01545-1
Carr, L. M., Guglietti, B., Wee, I. C., Musgrave, I., Mustafa, S., Corrigan, F., & Collins‐Praino, L. E. (2025) · Brain Pathology · doi:10.1111/bpa.70036
Czimbalmos, O., Kőrösi, G., Kékesi, G., & Horvath, G. (2025) · International Convention on Information and Communication Technology, Electronics and Microelectronics · doi:10.1109/mipro65660.2025.11131733
Nicola, C., Pédard, M., Dubois, M., Desrues, L., Neveu, P., Riou, G., Johnston, I., Kleouforo, P. D., Lecras, P., Vaudry, D., et al. (2025) · bioRxiv (Cold Spring Harbor Laboratory) · doi:10.1101/2025.09.03.673981
Roy, P. M. D., Cuba, J., Milligan, K., Shi, W., Wang, D., & LaPlaca, M. C. (2025) · Neurotrauma Reports · doi:10.1177/2689288x251377030 · Cited by 1
Rauk, Z., & Setkowicz, Z. (2025) · Brain Structure and Function · doi:10.1007/s00429-025-03019-y
Soares, N. P., Marçal, A. P., de Oliveira, A. C., Briânis, R. C., Santos, R. P. C., Ferreira, A. V. M., & de Aguiar, D. C. (2025) · Metabolic Brain Disease · doi:10.1007/s11011-025-01731-6
Rhythmic patterns in microglial cells within the circadian pineal gland from male rats
Freites, C. L., Avila, M., Amiotti, J. B., & Muñoz, E. M. (2025) · The Anatomical Record · doi:10.1002/ar.70099
Zhu, W., Zhang, J., & Arebi, P. (2025) · Communications in Statistics - Simulation and Computation · doi:10.1080/03610918.2025.2585394
Yuge, M., Koiwa, J., Shiromizu, T., Wakai, E., Mizoguchi, A., & Nishimura, Y. (2025) · Current Research in Toxicology · doi:10.1016/j.crtox.2025.100276
Schmidt, E. K. A., Raposo, P. J. F., Espin, A. T., Fenrich, K. K., & Fouad, K. (2021) · Figshare · doi:10.6084/m9.figshare.14853219
Schmidt, E. K. A., Raposo, P. J. F., Espin, A. T., Fenrich, K. K., & Fouad, K. (2021) · Figshare · doi:10.6084/m9.figshare.14853213
Delgado‐García, L. M., Ojalvo‐Sanz, A. C., Nakamura, T. K. E., Martín-López, E., Porcionatto, M. A., & López‐Mascaraque, L. (2024) · Figshare · doi:10.6084/m9.figshare.26777254
Schmidt, E. K. A., Raposo, P. J. F., Espin, A. T., Fenrich, K. K., & Fouad, K. (2021) · Figshare · doi:10.6084/m9.figshare.14853225
Schmidt, E. K. A., Raposo, P. J. F., Espin, A. T., Fenrich, K. K., & Fouad, K. (2021) · Figshare · doi:10.6084/m9.figshare.14853204
Schmidt, E. K. A., Raposo, P. J. F., Espin, A. T., Fenrich, K. K., & Fouad, K. (2021) · Figshare · doi:10.6084/m9.figshare.14853210
Schmidt, E. K. A., Raposo, P. J. F., Espin, A. T., Fenrich, K. K., & Fouad, K. (2021) · Figshare · doi:10.6084/m9.figshare.14853222
Additional file 2 of Neuroinflammation and protein pathology in Parkinson’s disease dementia
Kouli, A., Camacho, M., Allinson, K., & Williams‐Gray, C. H. (2020) · Figshare · doi:10.6084/m9.figshare.13331727
Delgado‐García, L. M., Ojalvo‐Sanz, A. C., Nakamura, T. K. E., Martín-López, E., Porcionatto, M. A., & López‐Mascaraque, L. (2024) · Figshare · doi:10.6084/m9.figshare.26777257
Additional file 1 of Neuroinflammation and protein pathology in Parkinson’s disease dementia
Kouli, A., Camacho, M., Allinson, K., & Williams‐Gray, C. H. (2020) · Figshare · doi:10.6084/m9.figshare.13331724
Bashir, S. T., Redden, C. R., Raj, K., Arcanjo, R. B., Stasiak, S., Li, Q., Steelman, A. J., & Nowak, R. A. (2024) · Figshare · doi:10.6084/m9.figshare.26572954
Additional file 3 of Neuroinflammation and protein pathology in Parkinson’s disease dementia
Kouli, A., Camacho, M., Allinson, K., & Williams‐Gray, C. H. (2020) · Figshare · doi:10.6084/m9.figshare.13331730
Additional file 4 of Neuroinflammation and protein pathology in Parkinson’s disease dementia
Kouli, A., Camacho, M., Allinson, K., & Williams‐Gray, C. H. (2020) · Figshare · doi:10.6084/m9.figshare.13331733
Goshi, N., Morgan, R. K., Lein, P. J., & Şeker, E. (2020) · Figshare · doi:10.6084/m9.figshare.12284750
Uzunallı, G., Herr, S., Dieterly, A. M., Shi, R., & Lyle, L. T. (2021) · Figshare · doi:10.6084/m9.figshare.13545920
Schmidt, E. K. A., Raposo, P. J. F., Espin, A. T., Fenrich, K. K., & Fouad, K. (2021) · Figshare · doi:10.6084/m9.figshare.14853207
Schmidt, E. K. A., Raposo, P. J. F., Espin, A. T., Fenrich, K. K., & Fouad, K. (2021) · Figshare · doi:10.6084/m9.figshare.14853201
Schmidt, E. K. A., Raposo, P. J. F., Espin, A. T., Fenrich, K. K., & Fouad, K. (2021) · Figshare · doi:10.6084/m9.figshare.14853216
Liu, W., Wang, Y.-Q., & Chu, Y. (2026) · Behavioural Brain Research · doi:10.1016/j.bbr.2026.116165
西本, 慎., Watanabe, H., Hoshi-Numahata, M., Nakanishi-Kimura, A., Tanaka, T., Takakura, A., Takao-Kawabata, R., Sato, Y., & Iimura, T. (2026) · Microscopy · doi:10.1093/jmicro/dfag018
Hemonnot-Girard, A.-L. (2021) · theses.fr (ABES) · doi:10.70675/9c8a4775zd774z494ez9bbazf7566faefa8f
Impact cérébral précoce de l'inhalation chez le rat, le tungstène comme contaminant émergent
Macé, L. (2021) · theses.fr (ABES) · doi:10.70675/c7da5a7czefe9z4aa7zaa25z91a53cbb43b9
Metadata
- Authors
- Fernández-Arjona, M. D. M., Grondona, J. M., Granados-Durán, P., Fernández-Llebrez, P., & López-Ávalos, M. D.
- Affiliations
- Instituto de Investigación Biomédica de Málaga (ES)
- Corresponding author
- López-Ávalos, María D.
- Venue
- Frontiers in Cellular Neuroscience
- Publisher
- Frontiers Media SA
- Published
- 2017-08-08
- Volume
- 11
- Pages
- 235-235
- ISSN
- 1662-5102 (ISSN-L)
- PMC
- PMC5550745
- OpenAlex
- W2742827847
- Cited by
- 417
- References
- 61
- Citations by year
- 2026: 26 · 2025: 47 · 2024: 52 · 2023: 46 · 2022: 72 · 2021: 81 · 2020: 56 · 2019: 20 · 2018: 16
- FWCI
- 12.53
- Type
- journal article
- Language
- en
- Open access
- gold
- doi.org
- Licence
- cc-by
- Locations
- Frontiers in Cellular Neuroscience (publishedVersion, cc-by)
- Europe PMC (PubMed Central) (publishedVersion, cc-by)
- PubMed Central (publishedVersion, cc-by)
- PubMed (publishedVersion)
- RISalud Institutional Health Repository of Andalucía (submittedVersion, cc-by)
- DOAJ (DOAJ: Directory of Open Access Journals) (submittedVersion, cc-by-sa)
- Funders
- Consejería de Economía, Innovación, Ciencia y Empleo, Junta de Andalucía (P11-CVI-07637)
- Topics
- Life Sciences › Neuroscience › Neurology › Neuroinflammation and Neurodegeneration Mechanisms
- Life Sciences › Biochemistry, Genetics and Molecular Biology › Biophysics › Cell Image Analysis Techniques
- Life Sciences › Neuroscience › Cellular and Molecular Neuroscience › Neuroscience and Neuropharmacology Research
- Keywords
- microglial morphology, Iba1, fractal analysis, IL-1β, microglial activation states, hippocampus, hypothalamus, rat model
About these checks
Registry, retraction, Cites and statistics results are computed, not judged, with one exception: a printed reference that no index lists is read once by a model before it counts as a citation error. Claims are extracted by a model and kept only when their quote appears verbatim in the text; each cited source is then checked, with a model’s help, for whether it says what the claim relies on. Those verdicts can be wrong — read the claim’s quote and the cited source before relying on one.
Statistics and arithmetic are recomputed, not judged.
Confidence bands are shown only for fields calibrated on our annotated test set. None is calibrated yet, so no band is shown.
What counts as a claim ›How we measure confidence ›How we check this ›
Are you an author, or do you see a problem with this page? Request a review
