

The DOI matches its Crossref record; 87 of the 87 references it cites were found in a registry or an index.
Obstructive Sleep Apnea Syndrome, Objectively Measured Physical Activity and Exercise Training Interventions: A Systematic Review and Meta-Analysis
Open accessAbstract
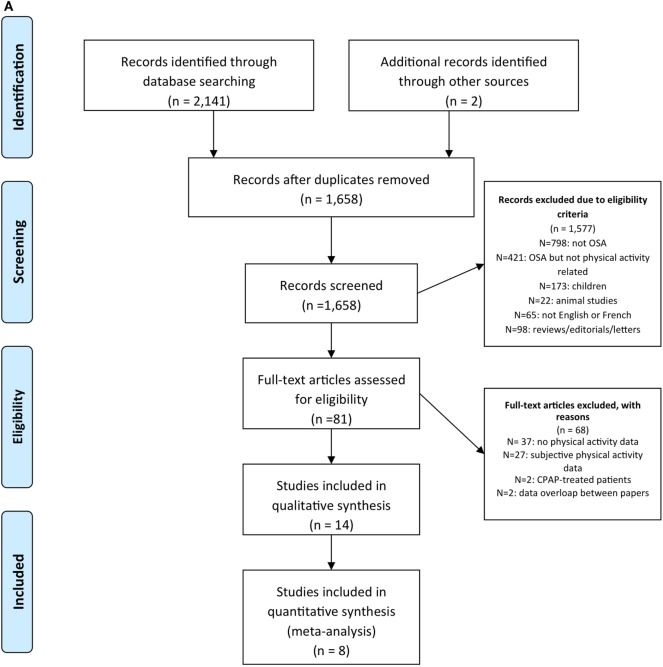
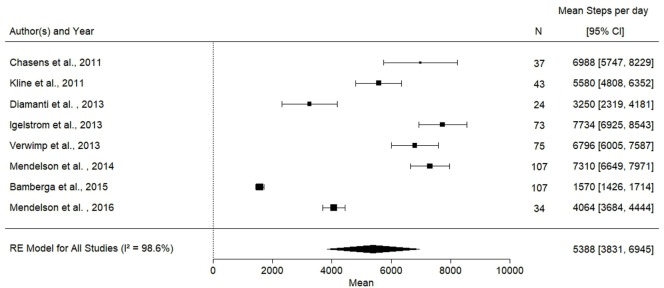
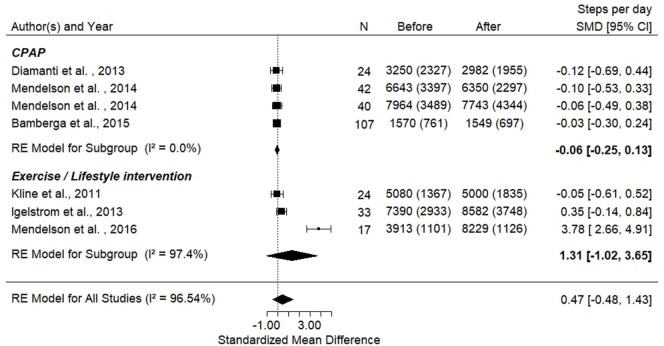
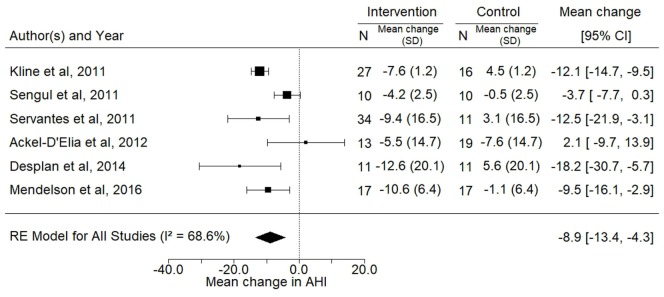
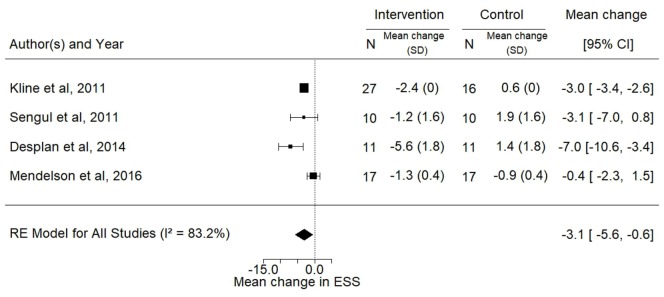
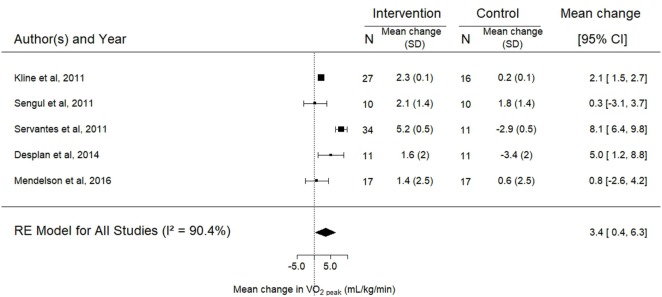
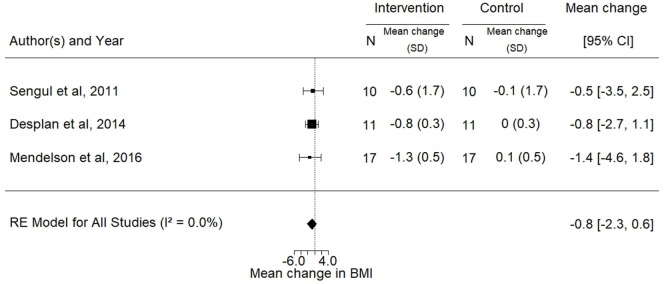
A systematic review of English and French articles using Pubmed/Medline and Embase included studies assessing objectively-measured physical activity levels of OSA patients and exploring the effects of exercise training on OSA severity, body mass index, sleepiness and cardiorespiratory fitness (VO2peak). Two independent reviewers analysed the studies, extracted the data and assessed the quality of evidence. For objectively-measured physical activity levels, 8 studies were included. The mean number of steps per day across studies was 5,388 (95% CI: 3,831 to 6,945; p<0.001), which was by far lower than the recommended threshold of 10,000 steps per day. For exercise training, 6 randomized trials were included. There was a significant decrease in apnea-hypopnea-index following exercise training (mean decrease of 8.9 events/h; 95% CI: -13.4 to -4.3; p<0.01), which was accompanied by a reduction in subjective sleepiness, an increase in VO2peak and no change in BMI. OSA patients present low levels of physical activity and exercise training is associated with improved outcomes. Future interventions (including exercise training) focusing on increasing physical activity levels may have important clinical impacts on both OSA severity and the burden of associated co-morbidities. Objective measurement of physical activity in routine OSA management and well-designed clinical trials are recommended.
Overview
The claims and statistics of this paper haven’t been checked yet.
Run the check — free, no account needed. It reads the open-access text and checks the sources it cites.
Integrity signals
Registry
Cites
Statistics
Figures
Verification
Claims the paper makes
The claims and statistics of this paper haven’t been checked yet.
Run the check — free, no account needed. It reads the open-access text and checks the sources it cites.
Claims other papers make about this one
Each is checked against this paper’s own text: does it say what the citing paper says it does?
The cited source says what the claim attributes to it.
In the citing paper
“Finally, self-reported physical activity or exercise interventions may have potential beneficial effects to lower the incidence of depression20 and lower the severity of obstructive sleep apnea and associated comorbidities21.”
From Association of step counts over time with the risk of chronic disease in the All of Us Research Program (2022) · cites this paper as [21]
Self-check
Percentages, sums and reported differences re-computed from the paper’s own numbers.
The self-check needs the paper’s full text.
Citations
Cites
Measuring inconsistency in meta-analyses
Higgins, J. P. T., Thompson, S. G., Deeks, J. J., & Altman, D. G. (2003) · BMJ · doi:10.1136/bmj.327.7414.557 · Cited by 63,139 · cited 1×
“An I2 index higher than 60% reflects increasing heterogeneity (28).”
BackgroundToprak, Ö., Kurt, H., Sarı, Y., Şarkış, C., Us, H., & Kırık, A. (2017) · Kidney & Blood Pressure Research · doi:10.1159/000468530 · Cited by 29,772
Liberati, A., Altman, D. G., Tetzlaff, J., Mulrow, C., Gøtzsche, P. C., Ioannidis, J. P. A., Clarke, M., Devereaux, P. J., Kleijnen, J., & Moher, D. (2009) · PLoS Medicine · doi:10.1371/journal.pmed.1000100 · Cited by 28,164
Conducting Meta-Analyses in R with the metafor Package
Viechtbauer, W. (2010) · Journal of Statistical Software · doi:10.18637/jss.v036.i03 · Cited by 20,464
Liberati, A., Altman, D. G., Tetzlaff, J., Mulrow, C., Gotzsche, P. C., Ioannidis, J. P. A., Clarke, M., Devereaux, P. J., Kleijnen, J., & Moher, D. (2009) · BMJ · doi:10.1136/bmj.b2700 · Cited by 17,648
Assessing the quality of reports of randomized clinical trials: Is blinding necessary?
Jadad, A. R., Moore, R. A., Carroll, D., Jenkinson, C., Reynolds, D. J. M., Gavaghan, D. J., & McQuay, H. J. (1996) · Controlled Clinical Trials · doi:10.1016/0197-2456(95)00134-4 · Cited by 17,582 · cited 2×
“methodological Quality assessment The quality of the studies was peer-reviewed by Monique Mendelson and Mathieu Marillier using a modified version of the Newcastle-Ottawa Scale (NOS) for observational studies (23) and the Jadad scale for randomized trials (24).”
MethodChobanian, A. V., Bakris, G. L., Black, H. R., Cushman, W. C., Green, L. A., Izzo, J. L., Jones, D. W., Materson, B. J., Oparil, S., Wright, J. T., et al. (2003) · Hypertension · doi:10.1161/01.hyp.0000107251.49515.c2 · Cited by 13,271 · cited 1×
“9 reduction in diastolic blood pressure in hypertensive patients (72).”
BackgroundZhang, Q., Wang, C., Zheng, M., Li, Y., Li, J., Zhang, L., Shang, X., & Yan, C. (2014) · Cerebrovascular Diseases · doi:10.1159/000369778 · Cited by 11,609
(1985) · Europe PMC (PubMed Central) · Cited by 9,143
(2007) · Circulation · doi:10.1161/circulationaha.107.185649 · Cited by 6,545 · cited 1×
“Spontaneous Physical activity and OSa Based on a systematic review and meta-analysis of the reported findings, OSA patients present low levels of objectively measured physical activity when compared with public health physical activity guidelines (15, 34).”
Result
Research works printed but not linked: 2
- 2006, ACSM’s Metabolic Calculations Handbook
- 2008, Physical Activity Guidelines Advisory Committee Report
Cited by
Sorted by citations
Dauvilliers, Y. A., Verbraecken, J. A., Partinen, M., Hedner, J. A., Saaresranta, T., Georgiev, O. B., Tiholov, R., Lecomte, I., Tamisier, R., Levy, P. A., et al. (2020) · American Journal of Respiratory and Critical Care Medicine · doi:10.1164/rccm.201907-1284oc · Cited by 273
Self-citationMaster, H., Annis, J., Huang, S., Beckman, J. A., Ratsimbazafy, F., Marginean, K., Carroll, R., Natarajan, K., Harrell, F. E., Roden, D. M., et al. (2022) · Nature Medicine · doi:10.1038/s41591-022-02012-w · Cited by 220
Kline, C. E., Hillman, C. H., Sheppard, B. B., Tennant, B., Conroy, D. E., Macko, R. F., Márquez, D. X., Petruzzello, S. J., Powell, K. E., & Erickson, K. I. (2021) · Sleep Medicine Reviews · doi:10.1016/j.smrv.2021.101489 · Cited by 157
Muscle quality index is associated with trouble sleeping: a cross-sectional population based study
You, Y., Chen, Y., Zhang, Q., Yan, N., Ning, Y., & Cao, Q. (2023) · BMC Public Health · doi:10.1186/s12889-023-15411-6 · Cited by 122
“Sleep duration was assessed by interview and was categorized into three groups: < 7 h for short duration, [7, 9) hours for normal duration, and ≥ 9 h for long duration.”
BackgroundMethodMultimodal Remote Monitoring of High Cardiovascular Risk Patients With OSA Initiating CPAP
Pépin, J., Jullian‐Desayes, I., Sapène, M., Treptow, E. C., Joyeux‐Faure, M., Benmerad, M., Bailly, S., Grillet, Y., Stach, B., Richard, P., et al. (2018) · CHEST Journal · doi:10.1016/j.chest.2018.11.007 · Cited by 86
Self-citation
Metadata
- Authors
- Mendelson, M., Bailly, S., Marillier, M., Flore, P., Borel, J. C., Vivodtzev, I., Doutreleau, S., Verges, S., Tamisier, R., & Pépin, J.-L.
- Affiliations
- Inserm (FR)
- Corresponding author
- Mendelson, Monique
- ORCID
- Venue
- Frontiers in Neurology
- Publisher
- Frontiers Media SA
- Published
- 2018-02-22
- Volume
- 9
- Pages
- 73-73
- ISSN
- 1664-2295 (ISSN-L)
- PMC
- PMC5827163
- OpenAlex
- W2791102933
- Cited by
- 134
- References
- 87
- Citations by year
- 2026: 11 · 2025: 17 · 2024: 18 · 2023: 14 · 2022: 15 · 2021: 20 · 2020: 22 · 2019: 7 · 2018: 9
- FWCI
- 1.90
- Type
- journal article
- Language
- en
- Open access
- gold
- doi.org
- Locations
- Frontiers in Neurology (publishedVersion, cc-by)
- PubMed Central (publishedVersion, cc-by)
- PubMed (publishedVersion)
- HAL (submittedVersion)
- DOAJ (DOAJ: Directory of Open Access Journals) (submittedVersion, cc-by-sa)
- Funders
- Fondation Air Liquide
- ResMed
- Agence Nationale de la Recherche (IDEX-02, ANR‐15‐IDEX‐02, ANR-15-IDEX-0002, 15-IDEX-02)
- Agir pour les Maladies Chroniques
- Topics
- Health Sciences › Medicine › Physiology (medical) › Obstructive Sleep Apnea Research
- Social Sciences › Psychology › Experimental and Cognitive Psychology › Sleep and related disorders
- Health Sciences › Medicine › Public Health, Environmental and Occupational Health › Physical Activity and Health
- Keywords
- obstructive sleep apnea, physical activity, exercise training, step count, apnea-hypopnea index, daytime sleepiness, cardiorespiratory fitness, body mass index, OSA severity
About these checks
Registry, retraction, Cites and statistics results are computed, not judged, with one exception: a printed reference that no index lists is read once by a model before it counts as a citation error. Claims are extracted by a model and kept only when their quote appears verbatim in the text; each cited source is then checked, with a model’s help, for whether it says what the claim relies on. Those verdicts can be wrong — read the claim’s quote and the cited source before relying on one.
Statistics and arithmetic are recomputed, not judged.
Confidence bands are shown only for fields calibrated on our annotated test set. None is calibrated yet, so no band is shown.
What counts as a claim ›How we measure confidence ›How we check this ›
Are you an author, or do you see a problem with this page? Request a review
