

The DOI matches its Crossref record; 13 of the 13 references it cites were found in a registry or an index.
Using SPM 12’s Second-Level Bayesian Inference Procedure for fMRI Analysis: Practical Guidelines for End Users
Open accessPublished version of a preprint
Abstract
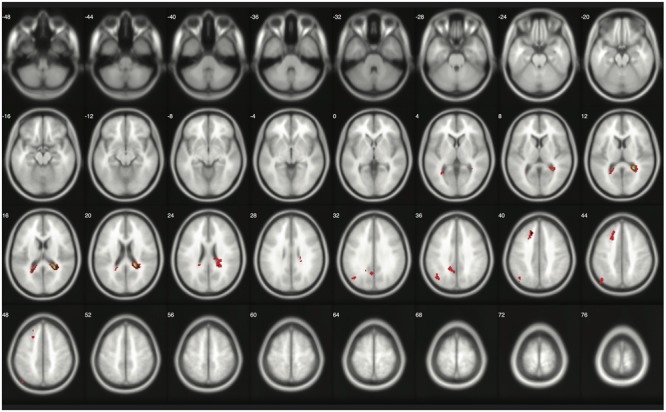
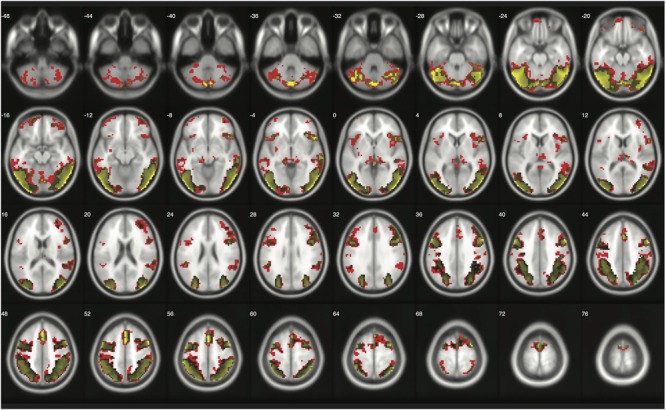
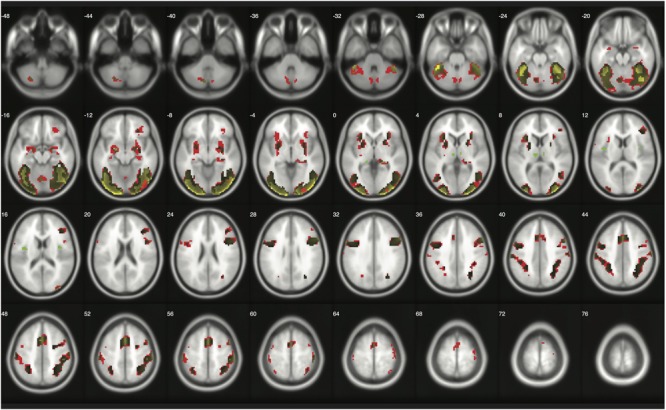
< 0.05, have spurred researchers to consider alternative ways to analyze fMRI data. A group of methodologists and statisticians have considered Bayesian inference as a candidate methodology. However, few previous studies have attempted to provide end users of fMRI analysis tools, such as SPM 12, with practical guidelines about how to conduct Bayesian inference. In the present study, we aim to demonstrate how to utilize Bayesian inference, Bayesian second-level inference in particular, implemented in SPM 12 by analyzing fMRI data available to public via NeuroVault. In addition, to help end users understand how Bayesian inference actually works in SPM 12, we examine outcomes from Bayesian second-level inference implemented in SPM 12 by comparing them with those from classical second-level inference. Finally, we provide practical guidelines about how to set the parameters for Bayesian inference and how to interpret the results, such as Bayes factors, from the inference. We also discuss the practical and philosophical benefits of Bayesian inference and directions for future research.
Overview
The claims and statistics of this paper haven’t been checked yet.
Run the check — free, no account needed. It reads the open-access text and checks the sources it cites.
Integrity signals
Registry
Cites
Statistics
Figures
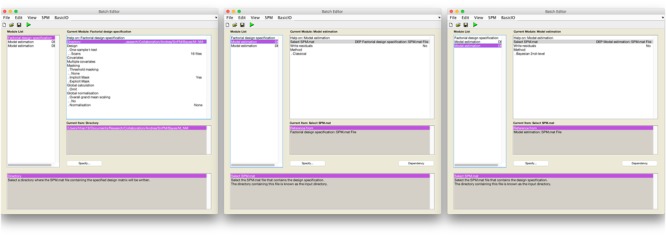
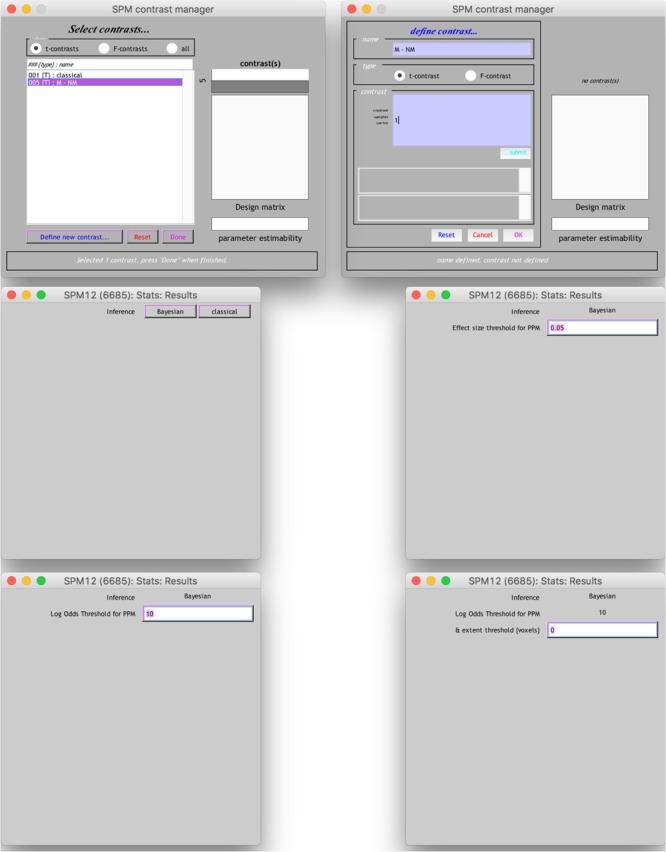
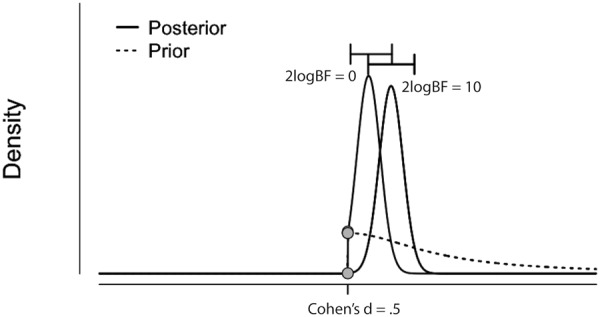
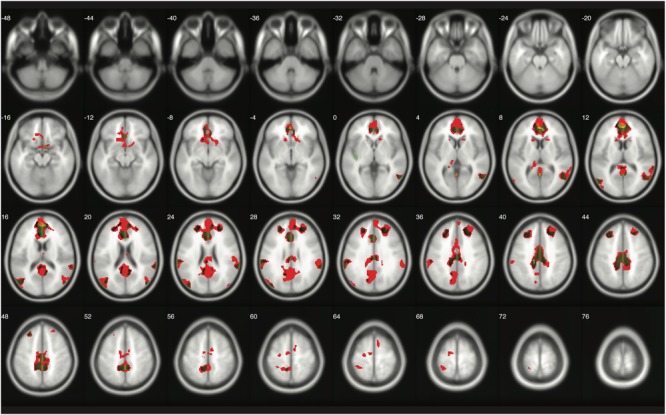
Verification
Claims the paper makes
The claims and statistics of this paper haven’t been checked yet.
Run the check — free, no account needed. It reads the open-access text and checks the sources it cites.
Claims other papers make about this one
Each is checked against this paper’s own text: does it say what the citing paper says it does?
The cited source says what the claim attributes to it.
In the citing paper
“To account for the liberal threshold of small volume corrections in the ROI analyses, the robustness of observed group differences in trust‐associated brain activity was probed by conducting Bayesian inference analyses as implemented in SPM.[ 55 ]”
From Loneliness and the Social Brain: How Perceived Social Isolation Impairs Human Interactions (2021) · cites this paper as [55]
Self-check
Percentages, sums and reported differences re-computed from the paper’s own numbers.
The self-check needs the paper’s full text.
Citations
Cites
Estimating the reproducibility of psychological science
Open Science Collaboration (2015) · Science · doi:10.1126/science.aac4716 · Cited by 8,515
Power failure: why small sample size undermines the reliability of neuroscience
Button, K. S., Ioannidis, J. P. A., Mokrysz, C., Nosek, B. A., Flint, J., Robinson, E. S. J., & Munafò, M. R. (2013) · Nature Reviews Neuroscience · doi:10.1038/nrn3475 · Cited by 7,641 · cited 3×
“This requirement would make psychological studies utilizing fMRI data analysis more challenging, because it would require studies to increase their sample size by at least 60% (Button et al., 2013).”
BackgroundInfluentialSimmons, J. P., Nelson, L. D., & Simonsohn, U. (2011) · Psychological Science · doi:10.1177/0956797611417632 · Cited by 6,567
The ASA Statement on p -Values: Context, Process, and Purpose
Wasserstein, R. L., & Lazar, N. A. (2016) · The American Statistician · doi:10.1080/00031305.2016.1154108 · Cited by 6,306
Nonparametric permutation tests for functional neuroimaging: A primer with examples
Nichols, T. E., & Holmes, A. P. (2002) · Human Brain Mapping · doi:10.1002/hbm.1058 · Cited by 6,256
SMITH, S., & NICHOLS, T. (2009) · NeuroImage · doi:10.1016/j.neuroimage.2008.03.061 · Cited by 5,250
1,500 scientists lift the lid on reproducibility
Baker, M. (2016) · Nature · doi:10.1038/533452a · Cited by 4,209
A practical solution to the pervasive problems ofp values
Wagenmakers, E.-J. (2007) · Psychonomic Bulletin & Review · doi:10.3758/bf03194105 · Cited by 2,490
Scientific method: Statistical errors
Nuzzo, R. (2014) · Nature · doi:10.1038/506150a · Cited by 1,536
The Extent and Consequences of P-Hacking in Science
Head, M. L., Holman, L., Lanfear, R., Kahn, A. T., & Jennions, M. D. (2015) · PLOS Biology · doi:10.1371/journal.pbio.1002106 · Cited by 1,388
Pashler, H., & Wagenmakers, E. (2012) · Perspectives on Psychological Science · doi:10.1177/1745691612465253 · Cited by 1,321
Cluster-extent based thresholding in fMRI analyses: Pitfalls and recommendations
Woo, C.-W., Krishnan, A., & Wager, T. D. (2014) · NeuroImage · doi:10.1016/j.neuroimage.2013.12.058 · Cited by 1,253
Bennett, C., Miller, M., & Wolford, G. (2009) · NeuroImage · doi:10.1016/s1053-8119(09)71202-9 · Cited by 400
Research works printed but not linked: 52
- Amalric, 2016, Origins of the brain networks for advanced mathematics in expert mathematicians., Proc. Natl. Acad. Sci., 113, 4909, 10.1073/pnas.1603205113 · DOI · Paper page
- Ashburner, 2016, SPM 12 Manual.
- Benjamini, 1995, Controlling the false discovery rate: a practical and powerful approach to multiple testing., J. R. Stat. Soc. B, 57, 289, 10.2307/2346101 · DOI
- Chang, 2009, Relationship between respiration, end-tidal CO2, and BOLD signals in resting-state fMRI., Neuroimage, 47, 1381, 10.1016/j.neuroimage.2009.04.048 · DOI
- Cohen, 1992, A power primer., Psychol. Bull., 112, 155, 10.1037/0033-2909.112.1.155 · DOI · Paper page
- Cohen, 1994, The earth is round (p < 0.05): rejoinder., Am. Psychol., 50, 1103, 10.1037/0003-066X.50.12.1103 · DOI
- Cox, 2017, FMRI clustering in AFNI: false-Positive rates redux., Brain Connect., 7, 152, 10.1089/brain.2016.0475 · DOI
- Cui, 2015, Xjview.
- Eklund, 2016, Cluster failure: why fMRI inferences for spatial extent have inflated false-positive rates., Proc. Natl. Acad. Sci. U.S.A., 113, 7900, 10.1073/pnas.1602413113 · DOI · Paper page
- Ellison, 1996, An introduction to Bayesian inference for ecological research and environmental decision-making., Ecol. Appl., 6, 1036, 10.2307/2269588 · DOI · Paper page
- Eres, 2017, Common and distinct neural networks involved in fMRI studies investigating morality: an ALE meta-analysis., Soc. Neurosci., 1, 10.1080/17470919.2017.1357657 · DOI
- Flandin, 2017, Analysis of family-wise error rates in statistical parametric mapping using random field theory., Hum. Brain Mapp., 10.1002/hbm.23839 · DOI
- Francis, 2012, Too good to be true: publication bias in two prominent studies from experimental psychology., Psychon. Bull. Rev., 19, 151, 10.3758/s13423-012-0227-9 · DOI
- Friston, 2003, Dynamic causal modelling., Neuroimage, 19, 1273, 10.1016/S1053-8119(03)00202-7 · DOI · Paper page
- Friston, 2003, Posterior probability maps and SPMs., Neuroimage, 19, 1240, 10.1016/S1053-8119(03)00144-7 · DOI
- Gelman, 2012, Why we (Usually) don’t have to worry about multiple comparisons., J. Res. Educ. Effs., 5, 189, 10.1080/19345747.2011.618213 · DOI · Paper page
- Gigerenzer, 2004, Mindless statistics., J. Socio. Econ., 33, 587, 10.1016/j.socec.2004.09.033 · DOI · Paper page
- Glover, 2009, SPIRAL IN/OUT Postprocessing for FMRI.
- Glover, 2001, Spiral-in/out BOLD fMRI for increased SNR and reduced susceptibility artifacts., Magn. Reson. Med., 46, 515, 10.1002/Mrm.1222 · DOI
- Glover, 2000, Image-based method for retrospective correction of physiological motion effects in fMRI: RETROICOR., Magn. Reson. Med., 44, 162, 10.1002/1522-2594(200007)44:1<162::AID-MRM23>3.0.CO;2-E · DOI
- Gordon, 2017, Precision functional mapping of individual human brains., Neuron, 95, 791.e7, 10.1016/j.neuron.2017.07.011 · DOI · Paper page
- Gorgolewski, 2015, NeuroVault.org: a web-based repository for collecting and sharing unthresholded statistical maps of the human brain., Front. Neuroinform., 9, 10.3389/fninf.2015.00008 · DOI
- Greene, 2004, The neural bases of cognitive conflict and control in moral judgment., Neuron, 44, 389, 10.1016/j.neuron.2004.09.027 · DOI · Paper page
- Greene, 2001, An fMRI investigation of emotional engagement in moral judgment., Science, 293, 2105, 10.1126/science.1062872 · DOI · Paper page
- Han, 2017, Neural correlates of moral sensitivity and moral judgment associated with brain circuitries of selfhood: a meta-analysis., J. Moral Educ., 46, 97, 10.1080/03057240.2016.1262834 · DOI
- Han, 2016, Influence of the cortical midline structures on moral emotion and motivation in moral decision-making., Behav. Brain Res., 302, 237, 10.1016/j.bbr.2016.01.001 · DOI
- Han, 2017, Evaluating methods of correcting for multiple comparisons implemented in SPM12 in social neuroscience fMRI studies: an example from moral psychology., Soc. Neurosci., 1, 10.1080/17470919.2017.1324521 · DOI
- Henson, 2002, Detecting latency differences in event-related BOLD responses: application to words versus nonwords and initial versus repeated face presentations., Neuroimage, 15, 83, 10.1006/nimg.2001.0940 · DOI
- Ioannidis, 2005, Why most published research findings are false., PLOS Med., 2, 10.1371/journal.pmed.0020124 · DOI · Paper page
- Jeffreys, 1961, Theory of Probability.
- Kass, 1995, Bayes Factors., J. Am. Stat. Assoc., 90, 773, 10.2307/2291091 · DOI
- Lieberman, 2009, Type I and Type II error concerns in fMRI research: re-balancing the scale., Soc. Cogn. Affect. Neurosci., 4, 423, 10.1093/scan/nsp052 · DOI · Paper page
- Love, 2017, JASP (Version 0.8.2).
- Magerkurth, 2015, Objective Bayesian fMRI analysis-a pilot study in different clinical environments., Front. Neurosci., 9, 10.3389/fnins.2015.00168 · DOI
- Maxwell, 2004, The persistence of underpowered studies in psychological research: causes, consequences, and remedies., Psychol. Methods, 9, 147, 10.1037/1082-989X.9.2.147 · DOI
- Mueller, 2017, Commentary: cluster failure: Why fMRI inferences for spatial extent have inflated false-positive rates., Front. Hum. Neurosci., 11, 10.3389/fnhum.2017.00345 · DOI · Paper page
- Neumann, 2003, Bayesian second-level analysis of functional magnetic resonance images., Neuroimage, 20, 1346, 10.1016/S1053-8119(03)00443-9 · DOI
- Nichols, 2012, Multiple testing corrections, nonparametric methods, and random field theory., Neuroimage, 62, 811, 10.1016/j.neuroimage.2012.04.014 · DOI
- Nichols, 2003, Controlling the familywise error rate in functional neuroimaging: a comparative review., Stat. Methods Med. Res., 12, 419, 10.1191/0962280203sm341ra · DOI
- Peng, 2015, The reproducibility crisis in science: a statistical counterattack., Significance, 12, 30, 10.1111/j.1740-9713.2015.00827.x · DOI · Paper page
- Penny, 2005, Bayesian Analysis of Single-Subject fMRI Data: User Guide.
- Penny, 2005, “Bayesian analysis of fMRI data with spatial priors,” in, Proceedings of the Joint Statistical Meeting (JSM) American Statistical Association
- Penny, 2007, “Bayesian treatments of neuroimaging data,” in, Bayesian Brain: Probabilistic Approaches to Neural Coding, 91
- Poldrack, 2017, Scanning the horizon: towards transparent and reproducible neuroimaging research., Nat. Rev. Neurosci., 18, 115, 10.1038/nrn.2016.167 · DOI · Paper page
- Rouder, 2009, Bayesian t tests for accepting and rejecting the null hypothesis., Psychon. Bull. Rev., 16, 225, 10.3758/PBR.16.2.225 · DOI · Paper page
- Scott, 2010, Bayes and empirical-Bayes multiplicity adjustment in the variable-selection problem., Ann. Stat., 38, 2587, 10.1214/10-AOS792 · DOI
- Sidén, 2017, Fast Bayesian whole-brain fMRI analysis with spatial 3D priors., Neuroimage, 146, 211, 10.1016/j.neuroimage.2016.11.040 · DOI
- Stern, 2016, A test by any other name: P values, bayes factors, and statistical inference., Multivariate Behav. Res., 51, 23, 10.1080/00273171.2015.1099032 · DOI
- Trafimow, 2015, Editorial., Basic Appl. Soc. Psych., 37, 1, 10.1080/01973533.2015.1012991 · DOI
- Wagenmakers, 2017, Bayesian inference for psychology. Part I: theoretical advantages and practical ramifications., Psychon. Bull. Rev., 10.3758/s13423-017-1343-3 · DOI
- Webster, 2017, FEAT/UserGuide.
- Woolrich, 2012, Bayesian inference in FMRI., Neuroimage, 62, 801, 10.1016/j.neuroimage.2011.10.047 · DOI
Cited by
Sorted by citations
Loneliness and the Social Brain: How Perceived Social Isolation Impairs Human Interactions
Lieberz, J., Shamay‐Tsoory, S. G., Saporta, N., Esser, T., Kuskova, E., Stoffel‐Wagner, B., Hurlemann, R., & Scheele, D. (2021) · Advanced Science · doi:10.1002/advs.202102076 · Cited by 116
Han, H., Glenn, A. L., & Dawson, K. J. (2019) · Brain Sciences · doi:10.3390/brainsci9080198 · Cited by 34
Self-citation
Metadata
- Authors
- Han, H., & Park, J.
- Affiliations
- University of Alabama (US)
- The Ohio State University (US)
- Corresponding author
- Han, Hyemin
- ORCID
- Han, Hyemin
- Venue
- Frontiers in Neuroinformatics
- Publisher
- Frontiers Media SA
- Published
- 2018-02-02
- Volume
- 12
- Pages
- 1-1
- ISSN
- 1662-5196 (ISSN-L)
- PMC
- PMC5801291
- OpenAlex
- W2789413038
- Cited by
- 103
- References
- 13
- Citations by year
- 2026: 2 · 2025: 9 · 2024: 3 · 2023: 7 · 2022: 4 · 2021: 39 · 2020: 18 · 2019: 18 · 2018: 3
- FWCI
- 10.29
- Type
- journal article
- Language
- en
- Open access
- gold
- doi.org
- Locations
- Frontiers in Neuroinformatics (publishedVersion, cc-by)
- Europe PMC (PubMed Central) (publishedVersion, cc-by)
- PubMed Central (publishedVersion, cc-by)
- PubMed (publishedVersion)
- DOAJ (DOAJ: Directory of Open Access Journals) (submittedVersion, cc-by-sa)
- PsyArXiv (OSF Preprints) (submittedVersion)
- OSF Preprints (OSF Preprints) (submittedVersion, cc-by)
- OSF Preprints (OSF Preprints) (submittedVersion)
- PsyArXiv (OSF Preprints) (submittedVersion, cc-by)
- Topics
- Life Sciences › Neuroscience › Cognitive Neuroscience › Functional Brain Connectivity Studies
- Physical Sciences › Mathematics › Statistics and Probability › Statistical Methods and Bayesian Inference
- Health Sciences › Medicine › Radiology, Nuclear Medicine and Imaging › Advanced MRI Techniques and Applications
- Keywords
- Bayesian inference, fMRI data analysis, Bayes factor
About these checks
Registry, retraction, Cites and statistics results are computed, not judged, with one exception: a printed reference that no index lists is read once by a model before it counts as a citation error. Claims are extracted by a model and kept only when their quote appears verbatim in the text; each cited source is then checked, with a model’s help, for whether it says what the claim relies on. Those verdicts can be wrong — read the claim’s quote and the cited source before relying on one.
Statistics and arithmetic are recomputed, not judged.
Confidence bands are shown only for fields calibrated on our annotated test set. None is calibrated yet, so no band is shown.
What counts as a claim ›How we measure confidence ›How we check this ›
Are you an author, or do you see a problem with this page? Request a review
