

The DOI matches its Crossref record; 74 of the 74 references it cites were found in a registry or an index.
Gradual Disturbances of the Amplitude of Low-Frequency Fluctuations (ALFF) and Fractional ALFF in Alzheimer Spectrum
Open accessAbstract
Background: Alzheimer’s disease (AD) is a common neurodegenerative disease in which the brain undergoes alterations for decades before symptoms become obvious. Subjective cognitive decline (SCD) have self-complain of persistent decline in cognitive function especially in memory but perform normally on standard neuropsychological tests. SCD with the presence of AD pathology is the transitional stage 2 of Alzheimer’s continuum, earlier than the prodromal stage, mild cognitive impairment (MCI), which seems to be the best target to research AD. In this study, we aimed to detect the transformational patterns of the intrinsic brain activity as the disease burden got heavy. Method: In this study, we enrolled 44 SCD, 55 amnestic MCI (aMCI), 47 AD dementia (d-AD) patients and 57 normal controls (NC) in total. A machine learning classification was utilized to detect identification accuracies between groups by using ALFF, fALFF, and fusing ALFF with fALFF features. Then, we measured the amplitude of the low-frequency fluctuation (ALFF) and fractional ALFF (fALFF) levels in three frequency bands (classic: 0.01-0.1 Hz; slow-5: 0.01–0.027 Hz; and slow-4: 0.027–0.073 Hz) and compared alterations in patients with NC. Results: In the machine learning verification, the identification accuracy of SCD, aMCI, d-AD from NC was higher when fused ALFF and fALFF features (76.44%, 81.94%, and 91.83%, respectively) than only using ALFF or fALFF features. Several brain regions showed significant differences in ALFF/fALFF within these bands among four groups: brain regions presented decreasing trend of values, including the Cingulum_Mid_R (aal), bilateral inferior cerebellum lobe, bilateral precuneus, and the Cingulum_Ant_R (aal); increasing trend of values were detected in the Hippocampus_L (aal), Frontal_Mid_Orb_R (aal), Frontal_Sup_R (aal) and Paracentral_Lobule_R (aal) as disease progressed. The normalized ALFF/fALFF values of these features were significantly correlated with the neuropsychological test scores. Conclusions: This study revealed gradual disturbances in intrinsic brain activity as the disease progressed: the normal objective performance in SCD may be dependent on compensation; as disease advanced, the cognitive function gradually impaired and decompensated in aMCI, severer in d-AD. Our results indicated that the ALFF and fALFF may help detect the underlying pathological mechanism in AD continuum.
Overview
The claims and statistics of this paper haven’t been checked yet.
Run the check — free, no account needed. It reads the open-access text and checks the sources it cites.
Integrity signals
Registry
Cites
Statistics
Figures
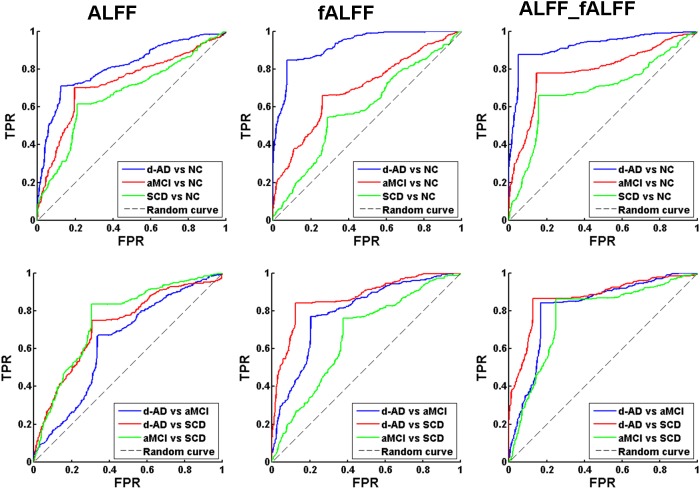
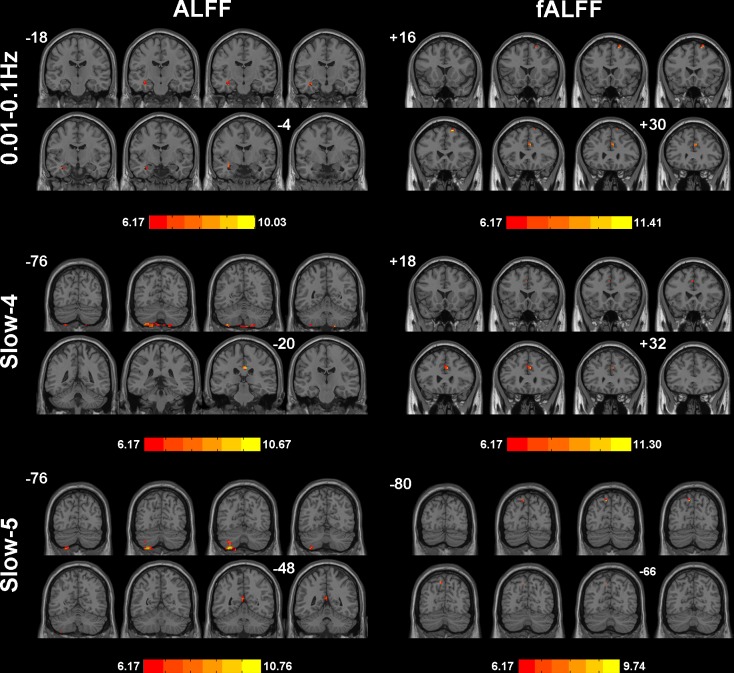
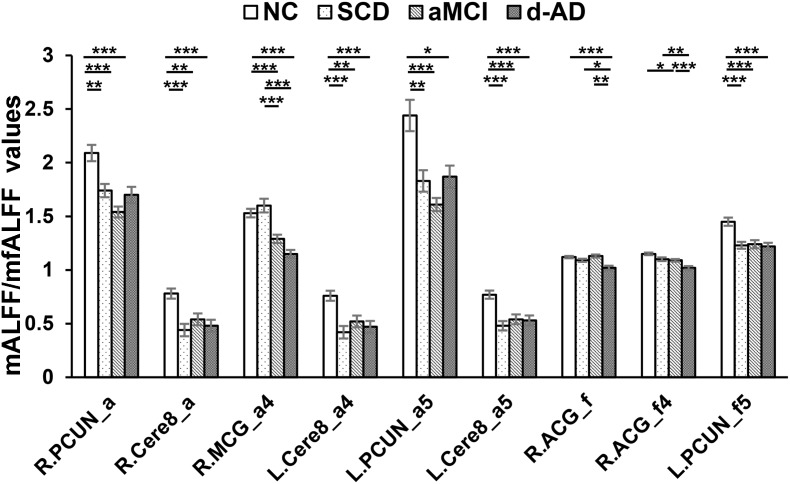
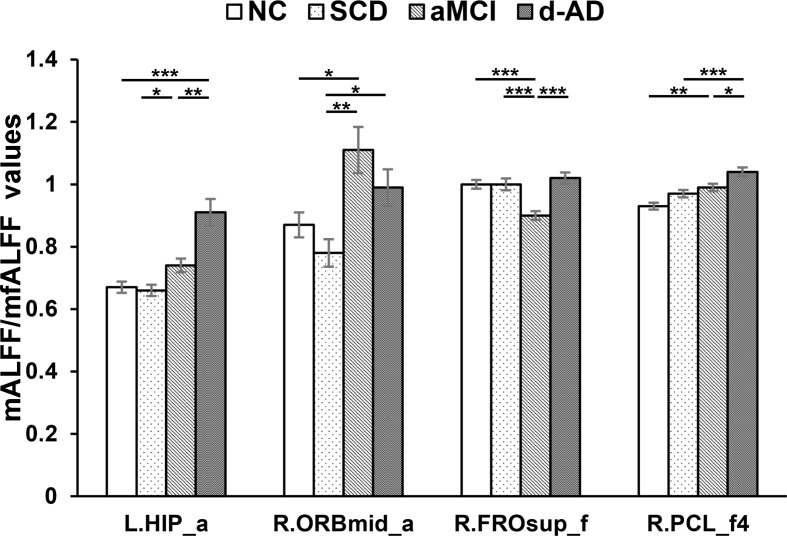
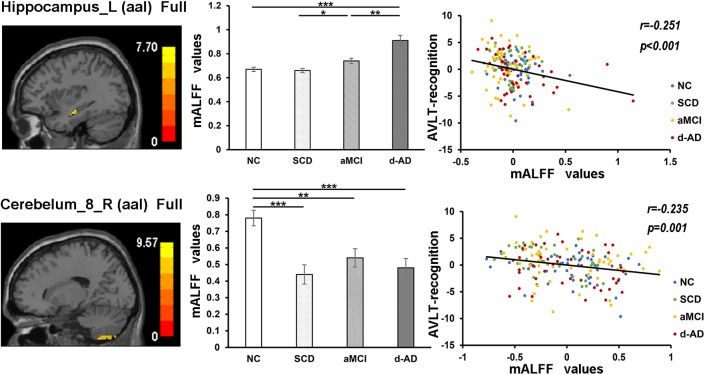
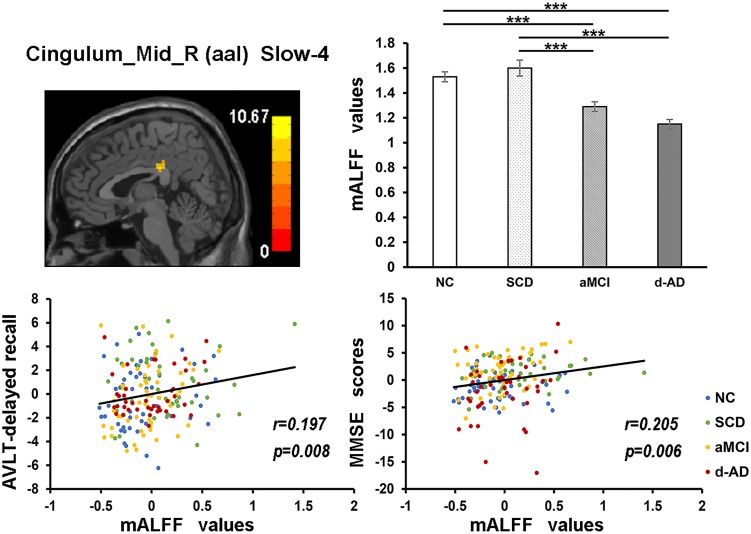
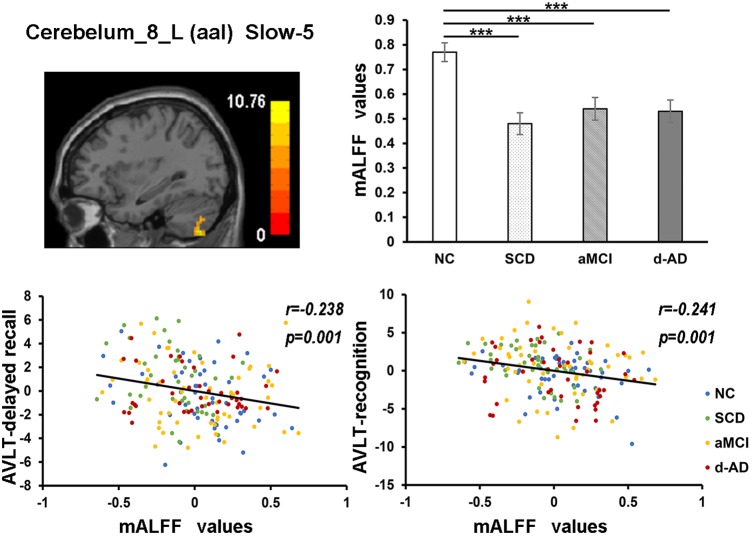
Verification
Claims the paper makes
The claims and statistics of this paper haven’t been checked yet.
Run the check — free, no account needed. It reads the open-access text and checks the sources it cites.
Claims other papers make about this one
Each is checked against this paper’s own text: does it say what the citing paper says it does?
The source backs part of the claim, not all of it — or backs it for a different population, condition or comparison.
In the citing paper
“For subjects with SCD, our group reported a higher amplitude of low-frequency fluctuations (ALFF) of spontaneous brain activity in the left inferior parietal lobule and right middle occipital gyrus and a lower ALFF in the precuneus and cerebellum than in HCs [122, 135].”
From Neuroimaging advances regarding subjective cognitive decline in preclinical Alzheimer's disease (2020) · cites this paper as [135]
Experimental — accuracy not yet measuredThe cited source says what the claim attributes to it.
In the citing paper
“Yang et al. observed a higher accuracy of discriminating individuals with SCD from HCs when ALFF and fractional ALFF features were combined than when only single features were used [135].”
From Neuroimaging advances regarding subjective cognitive decline in preclinical Alzheimer's disease (2020) · cites this paper as [135]
The check wasn’t confident either way, so it gives no verdict — never disputed.
In the citing paper
“However, until recently, neuroimaging-based studies for classifying SCD have been scarce [111, 126, 135, 204–206].”
From Neuroimaging advances regarding subjective cognitive decline in preclinical Alzheimer's disease (2020) · cites this paper as [135]
Experimental — accuracy not yet measured
Self-check
Percentages, sums and reported differences re-computed from the paper’s own numbers.
The self-check needs the paper’s full text.
Citations
Cites
Hamilton, M. (1960) · Journal of Neurology, Neurosurgery & Psychiatry · doi:10.1136/jnnp.23.1.56 · Cited by 32,817
McKhann, G. M., Knopman, D. S., Chertkow, H., Hyman, B. T., Jack, C. R., Kawas, C. H., Klunk, W. E., Koroshetz, W. J., Manly, J. J., Mayeux, R., et al. (2011) · Alzheimer's & Dementia · doi:10.1016/j.jalz.2011.03.005 · Cited by 18,657
NIA‐AA Research Framework: Toward a biological definition of Alzheimer's disease
Jack, C. R., Bennett, D. A., Blennow, K., Carrillo, M. C., Dunn, B., Haeberlein, S. B., Holtzman, D. M., Jagust, W., Jessen, F., Karlawish, J., et al. (2018) · Alzheimer's & Dementia · doi:10.1016/j.jalz.2018.02.018 · Cited by 10,537
Libsvm : A library for support vector machines
Ferrari, V. (2008) · Medical Entomology and Zoology · Cited by 10,123
The Clinical Dementia Rating (CDR): Current version and scoring rules
Morris, J. C. (1993) · Neurology · doi:10.1212/wnl.43.11.2412-a · Cited by 9,882
The Brain's Default Network: Anatomy, Function, and Relevance to Disease
Buckner, R. L., Andrews‐Hanna, J. R., & Schacter, D. L. (2008) · Annals of the New York Academy of Sciences · doi:10.1196/annals.1440.011 · Cited by 9,761 · cited 1×
“These regions all belong to the DMN, which is involved in episodic memory processing, significantly correlated with hippocampal formation and has been consistently associated with the successful recollection of previously studied items (Buckner et al., 2008; Raichle, 2015).”
ResultSperling, R. A., Aisen, P. S., Beckett, L. A., Bennett, D. A., Craft, S., Fagan, A. M., Iwatsubo, T., Jack, C. R., Kaye, J., Montine, T. J., et al. (2011) · Alzheimer's & Dementia · doi:10.1016/j.jalz.2011.03.003 · Cited by 7,155
Spontaneous fluctuations in brain activity observed with functional magnetic resonance imaging
Fox, M. D., & Raichle, M. E. (2007) · Nature Reviews Neuroscience · doi:10.1038/nrn2201 · Cited by 6,700
Neuronal Oscillations in Cortical Networks
Buzsáki, G., & Draguhn, A. (2004) · Science · doi:10.1126/science.1099745 · Cited by 6,576
What is cognitive reserve? Theory and research application of the reserve concept
STERN, Y. (2002) · Journal of the International Neuropsychological Society · doi:10.1017/s1355617702813248 · Cited by 3,951
Research works printed but not linked: 3
- Guo, 2007, Norm of auditory verbal learning test in the normal aged in Chinese community., Chin. J. Clin. Psychol., 15, 132
- Zhang, 1999, The minimental state examination in the Chinese residents population aged 55 years and over in the urban and rural areas of Beijing., Chin. J. Neurol., 32, 149, 10.3760/j.issn:1006-7876.1999.03.006 · DOI
- Zhao, 2012, Amplitude of low-frequency fluctuation in patients with alzheimer’s disease based on resting-state functional MRI., J. China Med. Univ., 41, 329
Cited by
Sorted by citations
Neuroimaging advances regarding subjective cognitive decline in preclinical Alzheimer's disease
Wang, X., Huang, W., Su, L., Xing, Y., Jessen, F., Sun, Y., Shu, N., & Han, Y. (2020) · Molecular Neurodegeneration · doi:10.1186/s13024-020-00395-3 · Cited by 265
Self-citationHu, B., Yan, L., Sun, Q., Yu, Y., Zhang, J. C., Dai, Y., Yang, Y., Hu, Y., Nan, H., Zhang, X., et al. (2019) · NeuroImage Clinical · doi:10.1016/j.nicl.2019.101802 · Cited by 101
Functional neuroimaging in subjective cognitive decline: current status and a research path forward
Viviano, R. P., & Damoiseaux, J. S. (2020) · Alzheimer s Research & Therapy · doi:10.1186/s13195-020-00591-9 · Cited by 85
Cao, R., Wang, X., Gao, Y., Li, T., Zhang, H., Hussain, W., Xie, Y., Wang, J., Wang, B., & Xiang, J. (2020) · Frontiers in Neurology · doi:10.3389/fneur.2020.00053 · Cited by 81
Liu, Y., Yan, Y., Li, Y., Hu, X., Lu, J., Chan, P., Yan, T., & Han, Y. (2019) · Brain Imaging and Behavior · doi:10.1007/s11682-019-00169-6 · Cited by 73
Self-citation
Metadata
- Authors
- Yang, L., Yan, Y., Wang, Y., Hu, X., Lu, J., Chan, P., Yan, T., & Han, Y.
- Affiliations
- Beijing Institute of Technology (CN)
- University of Cologne (DE)
- Capital Medical University (CN)
- Corresponding author
- Yan, Tianyi
- Han, Ying
- Venue
- Frontiers in Neuroscience
- Publisher
- Frontiers Media SA
- Published
- 2018-12-20
- Volume
- 12
- Pages
- 975-975
- ISSN
- 1662-453X (ISSN-L)
- PMC
- PMC6306691
- OpenAlex
- W2904195085
- Cited by
- 182
- References
- 74
- Citations by year
- 2026: 9 · 2025: 22 · 2024: 16 · 2023: 27 · 2022: 36 · 2021: 37 · 2020: 20 · 2019: 14
- FWCI
- 10.57
- Type
- journal article
- Language
- en
- Open access
- gold
- doi.org
- Licence
- Locations
- Frontiers in Neuroscience (publishedVersion, cc-by)
- Europe PMC (PubMed Central) (publishedVersion, cc-by)
- PubMed Central (publishedVersion, cc-by)
- PubMed (publishedVersion)
- Kölner Universitäts PublikationsServer (Universität zu Köln) (publishedVersion)
- DOAJ (DOAJ: Directory of Open Access Journals) (submittedVersion, cc-by-sa)
- Funders
- National Natural Science Foundation of China (61633018, 81430037, 81471731, 31371007, 81671776, 61727807, 81522021)
- Beijing Municipal Natural Science Foundation (7132147)
- Beijing Municipal Science and Technology Commission (Z161100002616020)
- Beijing Nova Program (Z171100001117057)
- Topics
- Life Sciences › Neuroscience › Cognitive Neuroscience › Functional Brain Connectivity Studies
- Health Sciences › Medicine › Psychiatry and Mental health › Dementia and Cognitive Impairment Research
- Life Sciences › Neuroscience › Cellular and Molecular Neuroscience › Alzheimer's disease research and treatments
- Keywords
- Alzheimer's disease, subjective cognitive decline, amnestic mild cognitive impairment, Alzheimer's dementia, amplitude of low-frequency fluctuation, fractional ALFF, intrinsic brain activity, machine learning classification, disease progression, hippocampus, precuneus, cingulum, neuropsychological test performance, early detection of Alzheimer's disease, mild cognitive impairment
About these checks
Registry, retraction, Cites and statistics results are computed, not judged, with one exception: a printed reference that no index lists is read once by a model before it counts as a citation error. Claims are extracted by a model and kept only when their quote appears verbatim in the text; each cited source is then checked, with a model’s help, for whether it says what the claim relies on. Those verdicts can be wrong — read the claim’s quote and the cited source before relying on one.
Statistics and arithmetic are recomputed, not judged.
Confidence bands are shown only for fields calibrated on our annotated test set. None is calibrated yet, so no band is shown.
What counts as a claim ›How we measure confidence ›How we check this ›
Are you an author, or do you see a problem with this page? Request a review
