

The DOI matches its Crossref record; 35 of the 36 references it cites were found in a registry or an index; none of the 44 sources its claims cite is checked for support yet.
Assessment of Dietary Intake and Eating Attitudes in Recreational and Competitive Adolescent Rock Climbers: A Pilot Study
Open accessAbstract
The dietary intake patterns and eating attitudes of adolescent climbers has not been studied. To fill this gap, we administered three surveys to 22 rock climbers (13 males, 9 females, age 14.21.9 years): climbing ability, three-day dietary recall, and Eating Attitude Test-26 (EAT-26). The majority (82%) of climbers did not meet their target energy intake (target = 2471493 kcalday-1; actual = 1963 581 kcalday-1) (p=0.003) and 86% of climbers consumed below their target carbohydrate intake (target = 28367 gday-1; actual intake = 22672 gday-1) (p=0.009). Average dietary protein intake was 95 51 gday-1, with the majority of climbers meeting their target intake of 8821 g (p=0.580). Seventy-three percent of climbers consumed below their target dietary fat intake (target = 9021 gday-1; actual = 6920 gday-1) (p=0.001). Average EAT-26 scores were 5.3± 4.1, indicating minimal risk of disordered eating attitudes/behaviors. There were no significant differences in boulderers vs. top rope climbers for energy/macronutrient intake, BMI, and EAT-26 score. There were no associations between energy intake and EAT-26 score (R2= 0.245, p=0.271) or climbing ability and EAT-26 score (R2=, p=0.217). These data suggest that adolescent climbers fail to meet target dietary intakes except protein, and exhibit minimal risk of disordered eating.
Overview
CoChat Summary
TL;DR
In a pilot study of 22 adolescent rock climbers, most failed to meet target energy, carbohydrate, and fat intakes, while protein intake generally met or exceeded targets. EAT-26 scores indicated minimal risk of disordered eating, with no significant differences by climbing type or ability for most intake variables.
Key findings
- 82% consumed below target energy intake (target 2,471 ± 493 kcal/day; actual 1,963 ± 581 kcal/day; p = 0.002 in Results/Table 2; abstract reports p = 0.003). 86% consumed below target carbohydrate intake (target 283 ± 67 g/day; actual 226 ± 72 g/day; p = 0.009), and 73% consumed below target fat intake (target 90 ± 21 g/day; actual 69 ± 20 g/day; p = 0.001).
- Protein intake was generally adequate: 23% consumed below target (target 88 ± 21 g/day; actual 95 ± 51 g/day; p = 0.584).
- Average EAT-26 score was 5.3 ± 4.1, indicating minimal risk of disordered eating attitudes/behaviors; only 1 participant met criteria for disordered eating attitude/behavior (prevalence 4.5%). Males had higher EAT-26 scores than females (6.8 ± 4.3 vs. 5.3 ± 4.1 as reported in text; p = 0.031; Table 3 reports female score 3.2 ± 2.8).
- No significant differences were found between boulderers and top rope climbers for energy/macronutrient intake, BMI, or EAT-26 score. Elite/advanced climbers consumed more protein than intermediate/low grade climbers (1.8 vs. 1.7 g/kg/day, p = 0.043), with no other intake differences. No associations were found between energy intake and EAT-26 score (R² = 0.245, p = 0.271) or climbing ability and EAT-26 score (R² = 0.274, p = 0.217).
Methods
- Pilot cross-sectional study of 22 adolescent rock climbers (13 males, 9 females; age 14.2 ± 1.9 years) from two climbing gyms. Participants completed health history, climbing ability, 3-day dietary recall, and EAT-26 surveys under supervision of a registered dietitian.
- Dietary intake was analyzed with Nutritics Professional Edition. Target energy needs were estimated using the Schofield equation for resting metabolic rate multiplied by an activity factor of 1.6 for males and 1.5 for females; target carbohydrate was 5 g/kg/day, protein 1.6 g/kg/day, and fat 20–35% of total energy.
- Statistical analysis used independent and paired-samples t-tests and Pearson correlations, with significance set at p < 0.05; data presented as means ± SD.
Limitations
- Stated: anthropometric data were self-reported; self-reported dietary recalls may introduce under- or over-reporting; self-reported climbing ability may vary from actual ability, though coaches assisted with classification.
- Stated: as a pilot study, the small sample and cross-sectional design limit generalizability, and larger-scale follow-up studies are warranted. The authors also note it was not possible to discern whether the high-protein, energy-restricted pattern was intentional or by chance.
- Evident from the text: the study lacked physiological measures of low energy availability/RED-S, body composition, growth, bone density, and menstrual status, which the authors identify as areas for future research.
Model-written summary. Check it against the paper before relying on it.
Integrity signals
Registry
Cites
Statistics
Figures
Verification
Claims the paper makes
0 Valid · 0 Not valid · 37 Not checked · 67 Own results and interpretations
A result the paper reports from its own data — it cites no other source for it, so there is none to check. The quote shows it is in the paper.
In the paper
“Only 1 participant met the criteria for an eating attitude associated with disordered eating by responding “yes” to a behavioral question. The prevalence of disordered eating attitudes was 4.5%.”
§ Assessment of Dietary Intake and Eating Attitudes in Recreational and Competitive Adolescent Rock Climbers: A Pilot Study > Results > Eating Attitudes and Behaviors
plainSingle case- Asserted: passes — The authors put it forward as true.
- Checkable: passes — It can be checked against evidence.
- Load-bearing: unclear — It is unclear whether the paper’s conclusions depend on it.
- Based: passes — The paper gives a reason why it holds.
A result the paper reports from its own data — it cites no other source for it, so there is none to check. The quote shows it is in the paper.
In the paper
“or climbing ability and EAT-26 scores (R2 = 0.274, p = 0.217) when assessed for all climbers combined.”
§ Assessment of Dietary Intake and Eating Attitudes in Recreational and Competitive Adolescent Rock Climbers: A Pilot Study > Results > Eating Attitudes and Behaviors
plain- Asserted: passes — The authors put it forward as true.
- Checkable: passes — It can be checked against evidence.
- Load-bearing: unclear — It is unclear whether the paper’s conclusions depend on it.
- Based: passes — The paper gives a reason why it holds.
A result the paper reports from its own data — it cites no other source for it, so there is none to check. The quote shows it is in the paper.
In the paper
“the majority of climbers failed to meet target dietary CHO (with 86% of climbers not meeting target intake)”
§ Assessment of Dietary Intake and Eating Attitudes in Recreational and Competitive Adolescent Rock Climbers: A Pilot Study > Discussion
plain- Asserted: passes — The authors put it forward as true.
- Checkable: passes — It can be checked against evidence.
- Load-bearing: passes — The paper’s conclusions depend on it.
- Based: passes — The paper gives a reason why it holds.
A result the paper reports from its own data — it cites no other source for it, so there is none to check. The quote shows it is in the paper.
In the paper
“No differences in EAT-26 score were observed between elite/advanced (5.6 ± 4.7) and intermediate/low grade (4.7 ± 2.3, p = 0.566) climbers”
§ Assessment of Dietary Intake and Eating Attitudes in Recreational and Competitive Adolescent Rock Climbers: A Pilot Study > Results > Eating Attitudes and Behaviors
plain- Asserted: passes — The authors put it forward as true.
- Checkable: passes — It can be checked against evidence.
- Load-bearing: unclear — It is unclear whether the paper’s conclusions depend on it.
- Based: passes — The paper gives a reason why it holds.
A result the paper reports from its own data — it cites no other source for it, so there is none to check. The quote shows it is in the paper.
In the paper
“| EAT-26 score | >20 | 6.8 ± 4.4 | — | >20 | 3.2 ± 2.8 | — | p = 0.031 |”
§ Assessment of Dietary Intake and Eating Attitudes in Recreational and Competitive Adolescent Rock Climbers: A Pilot Study > Results > Dietary Intake
plainstates an associationn = 13 ·- Asserted: passes — The authors put it forward as true.
- Checkable: passes — It can be checked against evidence.
- Load-bearing: unclear — It is unclear whether the paper’s conclusions depend on it.
- Based: passes — The paper gives a reason why it holds.
40 more claims
Create a free account to see all 104 claims and to verify the 43 references still open.
- It may state two separate claims as one. 38
- Probably not a substantial claim. 30
- The quote only partly states this claim. 1
Self-check
Percentages, sums and reported differences re-computed from the paper’s own numbers.
Each contradiction between two passages listed here was confirmed by an independent check.
Rated major: it would touch a result — a value a result rests on, reported and recomputed p-values on opposite sides of the significance level, two passages that conflict with no sign which is right, or a cited work retracted before this paper was published.
In the paper
§ Assessment of Dietary Intake and Eating Attitudes in Recreational and Competitive Adolescent Rock Climbers: A Pilot Study > Results > Dietary Intake
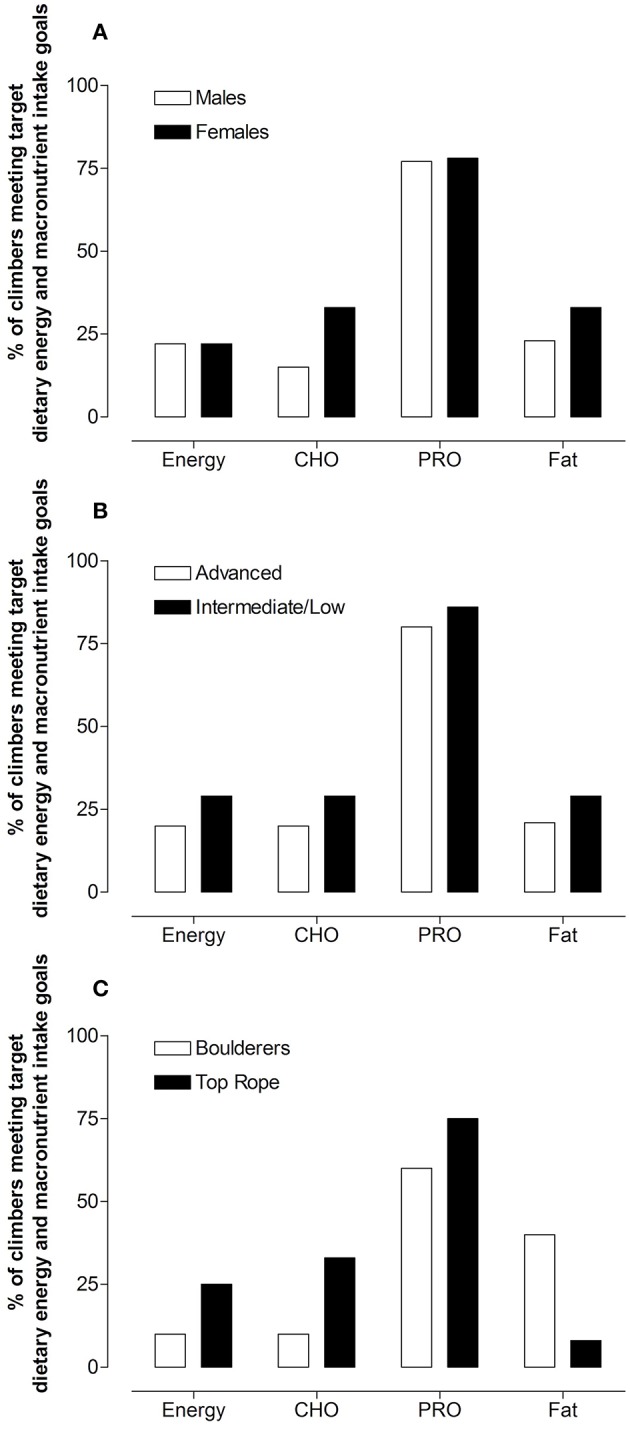
“Figure 1C expresses the percentage of boulderers compared to top rope climbers, respectively, which met target energy (10 vs. 25%), CHO (10 vs. 33%), protein (60 vs. 75%), and fat (40 vs. 8%).”
§ Assessment of Dietary Intake and Eating Attitudes in Recreational and Competitive Adolescent Rock Climbers: A Pilot Study > Abstract
“86% of climbers consumed below their target carbohydrate intake”
Rated major: it would touch a result — a value a result rests on, reported and recomputed p-values on opposite sides of the significance level, two passages that conflict with no sign which is right, or a cited work retracted before this paper was published.
In the paper
§ Assessment of Dietary Intake and Eating Attitudes in Recreational and Competitive Adolescent Rock Climbers: A Pilot Study > Conclusion
“There were no significant differences in dietary intake between males and females and between climbing abilities.”
§ Assessment of Dietary Intake and Eating Attitudes in Recreational and Competitive Adolescent Rock Climbers: A Pilot Study > Results > Dietary Intake
“| Protein intake (g·kg−1BM·day−1) | 1.8 ± 0.8 | 1.7 ± 1.0 | p = 0.043 |”
Rated major: it would touch a result — a value a result rests on, reported and recomputed p-values on opposite sides of the significance level, two passages that conflict with no sign which is right, or a cited work retracted before this paper was published.
In the paper
§ Assessment of Dietary Intake and Eating Attitudes in Recreational and Competitive Adolescent Rock Climbers: A Pilot Study > Results > Participant Demographics
“n = 4 intermediate grade climbers, n = 15 advanced climbers, n = 2 elite climbers, and n = 0 higher elite climbers”
§ Assessment of Dietary Intake and Eating Attitudes in Recreational and Competitive Adolescent Rock Climbers: A Pilot Study > Results > Dietary Intake
“Intermediate/low climbers: males n = 5; females n = 2.”
Rated minor: it would not touch a result — a value no result rests on, a p-value that stays on the same side of the significance level, or a conflict that is clerical, resolved elsewhere in the paper, or outside its own findings.
In the paper
§ Assessment of Dietary Intake and Eating Attitudes in Recreational and Competitive Adolescent Rock Climbers: A Pilot Study > Results > Participant Demographics
“| Height (cm) | 165.0 ± 12.4 | 171 ± 10.2 | 156 ± 10.2 |”
§ Assessment of Dietary Intake and Eating Attitudes in Recreational and Competitive Adolescent Rock Climbers: A Pilot Study > Results > Dietary Intake
“| Height (cm) | — | 171 ± 10.2 | — | — | 156 ± 8.5 | — | p = 0.004 |”
Rated minor: it would not touch a result — a value no result rests on, a p-value that stays on the same side of the significance level, or a conflict that is clerical, resolved elsewhere in the paper, or outside its own findings.
In the paper
§ Assessment of Dietary Intake and Eating Attitudes in Recreational and Competitive Adolescent Rock Climbers: A Pilot Study > Results > Dietary Intake
“The percentage of males vs. females that met their target energy (22 vs. 22%)”
§ Assessment of Dietary Intake and Eating Attitudes in Recreational and Competitive Adolescent Rock Climbers: A Pilot Study > Results > Dietary Intake
“Eighty-two percent of climbers consumed below their target energy dietary intake of 2,471 ± 493 kcal”
5 more findings
Create a free account to see every finding of this check.
Citations
Cites
The Eating Attitudes Test: psychometric features and clinical correlates
Garner, D. M., Olmsted, M. P., Bohr, Y., & Garfinkel, P. E. (1982) · Psychological Medicine · doi:10.1017/s0033291700049163 · Cited by 4,962
An effect size primer: A guide for clinicians and researchers.
Ferguson, C. J. (2009) · Professional Psychology: Research and Practice · doi:10.1037/a0015808 · Cited by 3,467
Predicting basal metabolic rate, new standards and review of previous work.
Wn, S. (1985) · PubMed · Cited by 2,955
Mountjoy, M., Sundgot-Borgen, J., Burke, L., Carter, S., Constantini, N., Lebrun, C., Meyer, N., Sherman, R., Steffen, K., Budgett, R., et al. (2014) · British Journal of Sports Medicine · doi:10.1136/bjsports-2014-093502 · Cited by 1,469
Prevalence of Eating Disorders in Elite Athletes Is Higher Than in the General Population
Sundgot-Borgen, J., & Torstveit, M. K. (2004) · Clinical Journal of Sport Medicine · doi:10.1097/00042752-200401000-00005 · Cited by 1,077
Validation of a Youth/Adolescent Food Frequency Questionnaire
Rockett, H. R. H., Breitenbach, M., Frazier, A. L., Witschi, J., Wolf, A. M., Field, A. E., & Colditz, G. A. (1997) · Preventive Medicine · doi:10.1006/pmed.1997.0200 · Cited by 696
Poslusna, K., Ruprich, J., de Vries, J. H. M., Jakubikova, M., & van't Veer, P. (2009) · British Journal of Nutrition · doi:10.1017/s0007114509990602 · Cited by 695
Burrows, T. L., Martin, R. J., & Collins, C. E. (2010) · Journal of the American Dietetic Association · doi:10.1016/j.jada.2010.07.008 · Cited by 669
Dietary protein for athletes: From requirements to optimum adaptation
Phillips, S. M., & Van Loon, L. J. C. (2011) · Journal of Sports Sciences · doi:10.1080/02640414.2011.619204 · Cited by 530
Bratland‐Sanda, S., & Sundgot‐Borgen, J. (2013) · European Journal of Sport Science · doi:10.1080/17461391.2012.740504 · Cited by 508
Cited by
Prevalence of Disordered Eating Among International Sport Lead Rock Climbers
Joubert, L. M., Gonzalez, G. B., & Larson, A. J. (2020) · Frontiers in Sports and Active Living · doi:10.3389/fspor.2020.00086 · Cited by 61
Self-citationDietary Intake, Body Composition and Iron Status in Experienced and Elite Climbers
Gibson-Smith, E., Storey, R., & Ranchordas, M. K. (2020) · Frontiers in Nutrition · doi:10.3389/fnut.2020.00122 · Cited by 47
Physiological demands and nutritional considerations for Olympic-style competitive rock climbing
Michael, M. K., Witard, O. C., & Joubert, L. M. (2019) · Cogent Medicine · doi:10.1080/2331205x.2019.1667199 · Cited by 41
Self-citationMonedero, J., Duff, C., & Egan, B. (2022) · The Journal of Strength and Conditioning Research · doi:10.1519/jsc.0000000000004317 · Cited by 31
Prevalence of amenorrhea in elite female competitive climbers
Joubert, L. M., Warme, A., Larson, A. M., Grønhaug, G., Michael, M. K., Schöffl, V., Burtscher, E., & Meyer, N. L. (2022) · Frontiers in Sports and Active Living · doi:10.3389/fspor.2022.895588 · Cited by 23
Self-citationAttitudes towards disordered eating in the rock climbing community: a digital ethnography
Strand, M. (2022) · Journal of Eating Disorders · doi:10.1186/s40337-022-00619-5 · Cited by 20
Chmielewska, A., & Regulska−Ilow, B. (2023) · International Journal of Environmental Research and Public Health · doi:10.3390/ijerph20065176 · Cited by 19
Mora-Fernández, A., Argüello-Arbe, A., Tojeiro-Iglesias, A., Latorre, J. A., Conde-Pipó, J., & Mariscal‐Arcas, M. (2024) · Nutrients · doi:10.3390/nu16172974 · Cited by 13
Eating disorder risks and awareness among female elite cyclists: an anonymous survey
Koppenburg, C., Saxer, F., Vach, W., Lüchtenberg, D., & Goesele, A. (2022) · BMC Sports Science Medicine and Rehabilitation · doi:10.1186/s13102-022-00563-6 · Cited by 13
Nutrition knowledge, weight loss practices, and supplement use in senior competition climbers
Gibson-Smith, E., Storey, R., Michael, M. K., & Ranchordas, M. K. (2024) · Frontiers in Nutrition · doi:10.3389/fnut.2023.1277623 · Cited by 10
Self-citationAnalysis of energy requirements and nutritional needs of rock climbing athletes
Mashuri, H., Mappaompo, M. A., & Purwanto, D. (2022) · JOURNAL SPORT AREA · doi:10.25299/sportarea.2022.vol7(3).10886 · Cited by 10
Dewinta, M. C. N., Penggalih, M. H. S. T., & Purwaningrum, D. N. (2022) · Nutrition and Health · doi:10.1177/02601060221102681 · Cited by 9
Low energy availability and carbohydrate intake in competitive adolescent climbers
Simič, V., Jevšnik, Š., & Mohorko, N. (2022) · Kinesiology · doi:10.26582/k.54.2.8 · Cited by 9
Nigicser, I., Identeg, F., Sansone, M., Hedelin, H., Forsberg, N., Tranæus, U., & Edlund, B. (2024) · BMJ Open · doi:10.1136/bmjopen-2024-085265 · Cited by 7
Physiological Characteristics, Dietary Intake, and Supplement Use in Sport Climbing
Okoren, L., & Magkos, F. (2023) · Current Nutrition Reports · doi:10.1007/s13668-023-00511-x · Cited by 7
Relative Energy Deficiency in Sport in Rock Climbers: A Narrative Review
Tan, K., & Schöffl, V. (2025) · The Journal of Strength and Conditioning Research · doi:10.1519/jsc.0000000000005157 · Cited by 6
Energy and nutritional inadequacies in a group of recreational adult Spanish climbers
Úbeda, N., Lorenzo-Carvacho, C., & García‐González, Á. (2021) · Archivos de medicina del deporte: revista de la Federación Española de Medicina del Deporte y de la Confederación Iberoamericana de Medicina del Deporte · doi:10.18176/archmeddeporte.00047 · Cited by 5
Limstrand, M., Tjønndal, A., & Wågan, F. A. (2024) · Sports Coaching Review · doi:10.1080/21640629.2024.2318906 · Cited by 5
Slagel, N., Kage, K., & Wichern, S. (2024) · Frontiers in Sports and Active Living · doi:10.3389/fspor.2024.1408209 · Cited by 3
Mora-Fernández, A., Argüello-Arbe, A., Conde-Pipó, J., & Mariscal‐Arcas, M. (2025) · Mediterranean Journal of Nutrition and Metabolism · doi:10.1177/1973798x251340048 · Cited by 1
Climbing the gap: a review on sex differences in high-level rock climbing
Langer, K., Roffler, A., Hief, P., & Fleddermann, M. (2026) · Frontiers in Sports and Active Living · doi:10.3389/fspor.2025.1736831 · Cited by 1
Prevalence of Orthorexia Nervosa in a Sample of Rock and Sport Climbers
Sas-Nowosielski, K., & Gutek, M. (2024) · Central European Journal of Sport Sciences and Medicine · doi:10.18276/cej.2024.2-07 · Cited by 1
Sports-psychiatry and psychotherapy for alpine sports
Christian, M., Corinna, S., Monika, B.-M., & Jörg, T. (2020) · Swiss Sports & Exercise Medicine · doi:10.34045/sems/2020/24
Limstrand, M., Tjønndal, A., & Wågan, F. A. (2022) · Universitetsforlaget eBooks · doi:10.18261/9788215061153-2022-04
Wild, J., & Ruparell, S. (2023) · Elsevier eBooks · doi:10.1016/b978-0-323-99992-2.00093-1
Recovery practices of slovenian sport climbers
Podlogar, T. (2023) · Kinesiologia Slovenica scientific journal on sport · doi:10.52165/kinsi.29.3.132-152
Avşar, F., Kıtış, Y., & Erdal, A. (2024) · Journal of Gazi University Health Sciences Institute · doi:10.59124/guhes.1407464
Koppenburg, C., Saxer, F., Vach, W., Lüchtenberg, D., & Goesele, A. (2022) · Figshare · doi:10.6084/m9.figshare.21200687
Koppenburg, C., Saxer, F., Vach, W., Lüchtenberg, D., & Goesele, A. (2022) · Figshare · doi:10.6084/m9.figshare.21200693
Revisión bibliográfica sobre nutrición y escalada
Gómez Clemente, S., & Escolar, E. L. (2023) · Zaguan (Universidad de Zaragoza)
Ayudas ergogénicas en deportes emergentes. Una revisión narrativa.
Gallego Lantada, J. (2024) · UVaDOC UVaDOC University of Valladolid Documentary Repository (University of Valladolid)
Reducing free sugar intakes: Evidence for effective dietary recommendations
Boxall, L. R. (2024) · Bournemouth University Research Online (Bournemouth University)
Nutrition prescription for climbing athletes on rock or artificial surfaces: are we guessing?
Joubert, L. M., Michael, M. K., Nugent, C., & Chmielewska, A. (2026) · Frontiers in Sports and Active Living · doi:10.3389/fspor.2026.1799533
Self-citation
Metadata
- Authors
- Michael, M. K., Joubert, L., & Witard, O. C.
- Affiliations
- University of Stirling (GB)
- Northern Michigan University (US)
- Corresponding author
- Joubert, Lanae
- Venue
- Frontiers in Nutrition
- Publisher
- Frontiers Media SA
- Published
- 2019-05-10
- Volume
- 6
- Pages
- 64-64
- ISSN
- 2296-861X (ISSN-L)
- PMC
- PMC6523393
- OpenAlex
- W2939106940
- Cited by
- 33
- References
- 36
- Citations by year
- 2026: 2 · 2025: 2 · 2024: 9 · 2023: 5 · 2022: 10 · 2021: 1 · 2020: 3 · 2019: 1
- FWCI
- 2.81
- Type
- journal article
- Language
- en
- Open access
- gold
- doi.org
- Licence
- Locations
- Frontiers in Nutrition (publishedVersion, cc-by)
- PubMed (publishedVersion)
- PubMed Central (publishedVersion, cc-by)
- Research Portal (King's College London) (submittedVersion, cc-by)
- DOAJ (DOAJ: Directory of Open Access Journals) (submittedVersion, cc-by-sa)
- Stirling Online Research Repository (University of Stirling) (submittedVersion, cc-by)
- Topics
- Health Sciences › Nursing › Nutrition and Dietetics › Nutrition, Health and Food Behavior
- Social Sciences › Psychology › Clinical Psychology › Eating Disorders and Behaviors
- Health Sciences › Medicine › Public Health, Environmental and Occupational Health › Obesity, Physical Activity, Diet
- Keywords
- rock climbing, youth athletes, dietary intake, eating attitudes, energy intake, macronutrient intake, disordered eating, climbing ability, protein intake, carbohydrate intake, dietary fat intake
About these checks
Registry, retraction, Cites and statistics results are computed, not judged, with one exception: a printed reference that no index lists is read once by a model before it counts as a citation error. Claims are extracted by a model and kept only when their quote appears verbatim in the text; each cited source is then checked, with a model’s help, for whether it says what the claim relies on. Those verdicts can be wrong — read the claim’s quote and the cited source before relying on one.
A language model drew the claims from the paper on 2026-11-14, under version 3 of the claim definition (model deepseek-v4.1-flash, prompt extract-v3).
A second model labelled each claim on 2026-11-14 (model jev-1.13-20260917, definition revision gold-guideline-v0.2).
Statistics and arithmetic are recomputed, not judged.
Confidence bands are shown only for fields calibrated on our annotated test set. None is calibrated yet, so no band is shown.
What counts as a claim ›How we measure confidence ›How we check this ›
Are you an author, or do you see a problem with this page? Request a review
Data sources
Bibliographic data: Semantic Scholar, OpenAlex, Crossref.
Contains information from the Semantic Scholar Academic Graph Datasets, made available under the ODC Attribution License (ODC-BY 1.0).
Semantic Scholar’s data is described in: Kinney, R., et al. (2023). The Semantic Scholar Open Data Platform. arXiv:2301.10140.
