

The DOI matches its Crossref record; 2 of the 2 references it cites were found in a registry or an index.
A mechanistic quantitative systems pharmacology model platform for translational efficacy evaluation and checkpoint combination design of bispecific immuno-modulatory antibodies
Abstract
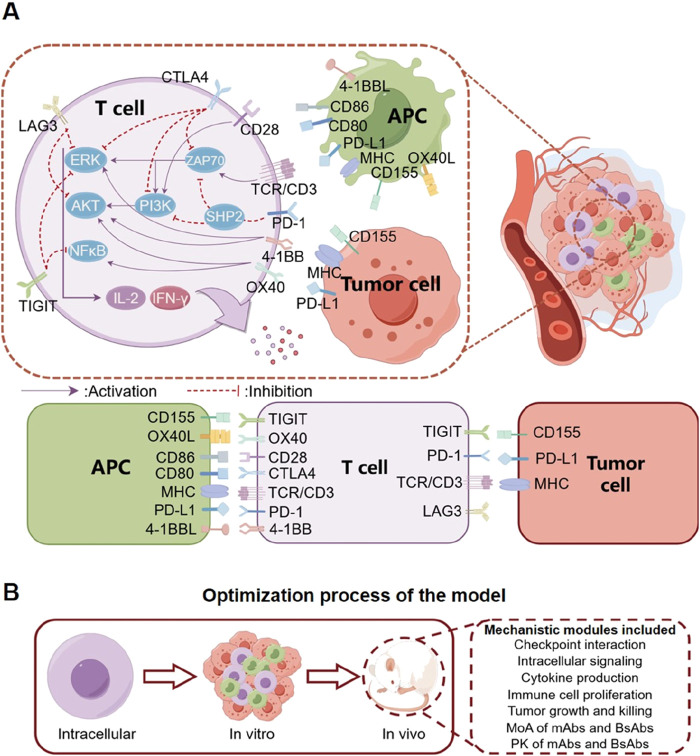
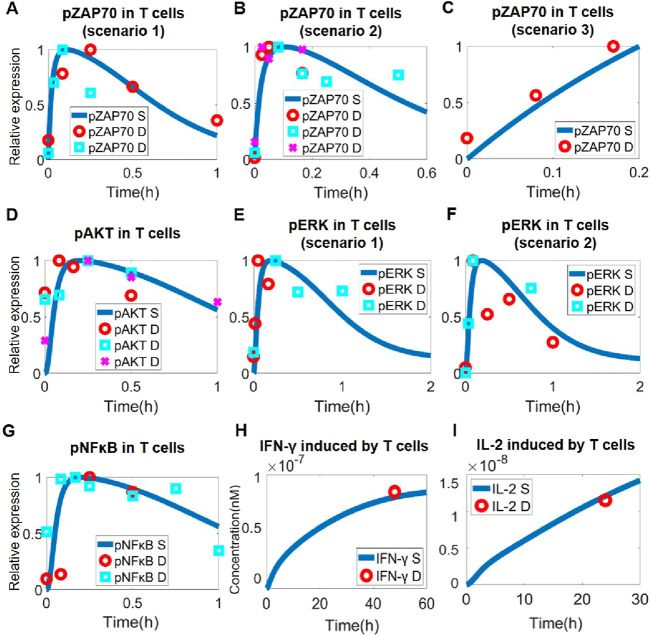
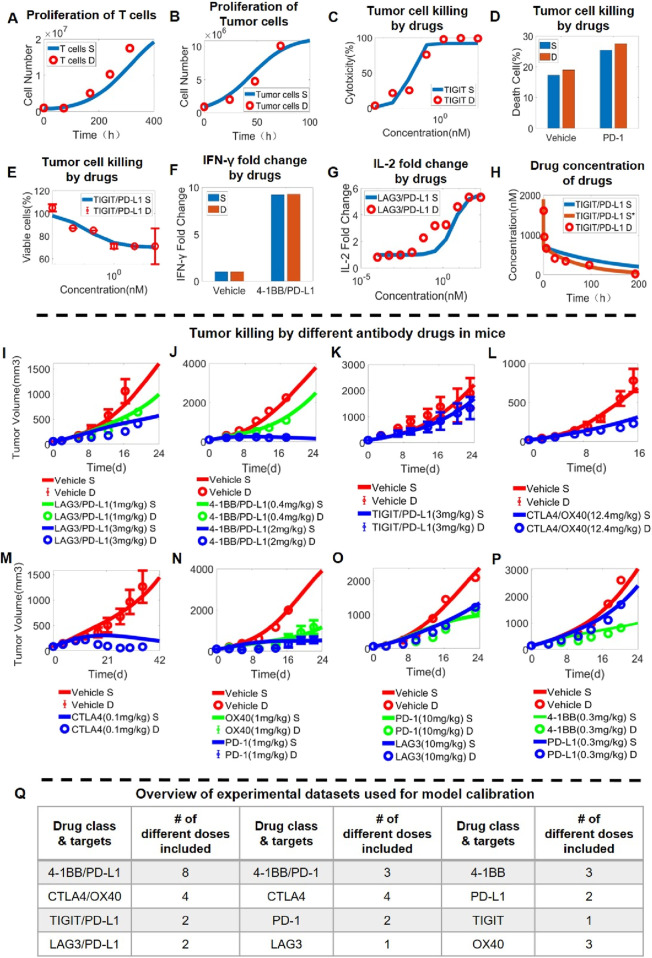
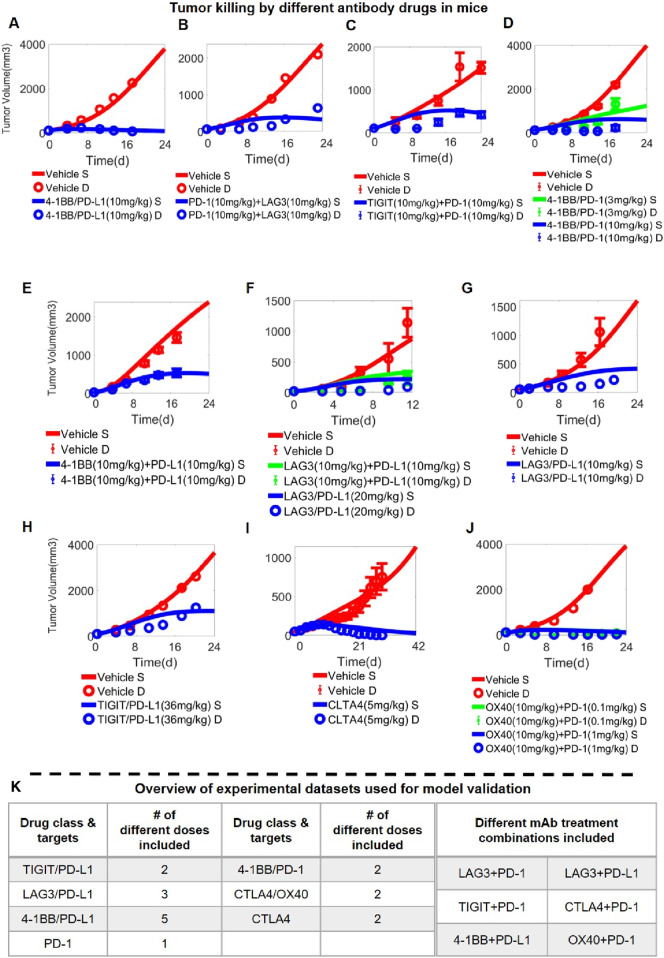
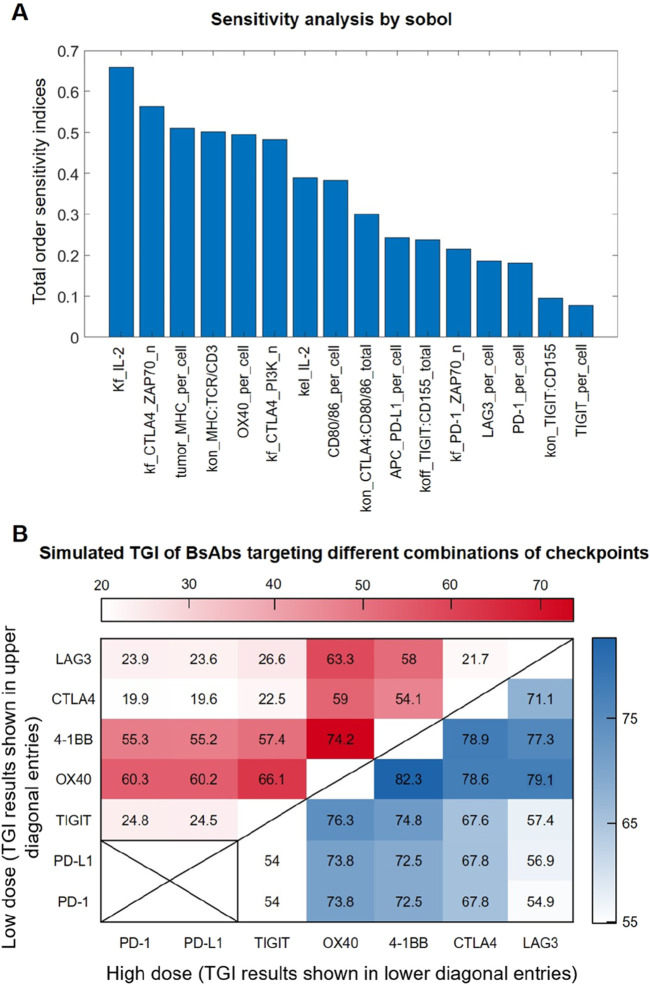
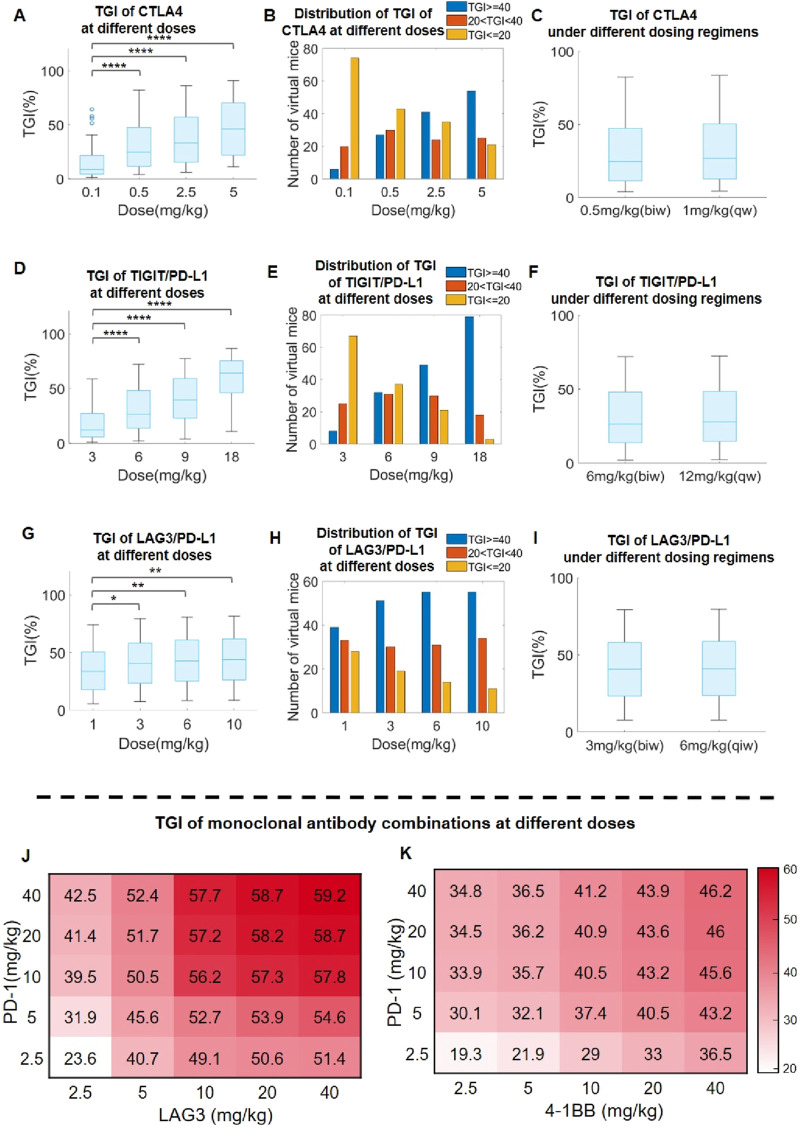
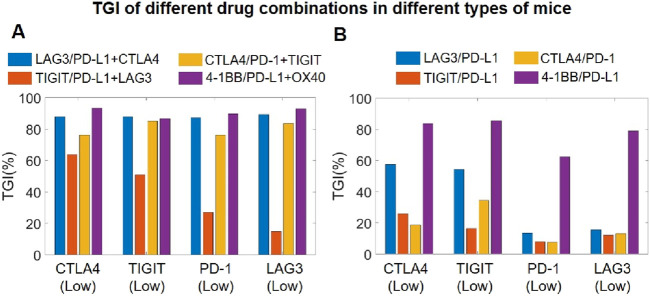
Over the past 2 decades, tumor immunotherapies have witnessed remarkable advancements, especially with the emergence of immune checkpoint-targeting bispecific antibodies. However, a quantitative understanding of the dynamic cross-talking mechanisms underlying different immune checkpoints as well as the optimal dosing and target design of checkpoint-targeting bispecific antibodies still remain challenging to researchers. To address this challenge, we have here developed a multi-scale quantitative systems pharmacology (QSP) model platform that integrates a diverse array of immune checkpoints and their interactive functions. The model has been calibrated and validated against an extensive collection of multiscale experimental datasets covering 20+ different monoclonal and bispecific antibody treatments at over 60 administered dose levels. Based on high-throughput simulations, the QSP model platform comprehensively screened and characterized the potential efficacy of different bispecific antibody target combination designs, and model-based preclinical population-level simulations revealed target-specific dose-response relationships as well as alternative dosing strategies that can maintain anti-tumor treatment efficacy while reducing dosing frequencies. Model simulations also pointed out that combining checkpoint-targeting bispecific antibodies with monoclonal antibodies can lead to significantly enhanced anti-tumor efficacy. Our mechanistic QSP model can serve as an integrated precision medicine simulation platform to guide the translational research and clinical development of checkpoint-targeting immuno-modulatory bispecific antibodies.
Overview
The claims and statistics of this paper haven’t been checked yet.
Run the check — free, no account needed. It reads the open-access text and checks the sources it cites.
Integrity signals
Registry
Cites
Statistics
Figures
Verification
Claims the paper makes
The claims and statistics of this paper haven’t been checked yet.
Run the check — free, no account needed. It reads the open-access text and checks the sources it cites.
Claims other papers make about this one
Each is checked against this paper’s own text: does it say what the citing paper says it does?
The check wasn’t confident either way, so it gives no verdict — never disputed.
In the citing paper
“ligands with strong receptor affinity and/or high multivalency are preferentially captured by the first accessible receptors near vessels, leading to perivascular sequestration and reduced interstitial propagation.”
From Overcoming tumor microenvironment barriers: transformable and bioinspired nanomedicine strategies for deep tumor penetration (2026) · cites this paper as [92]
Experimental — accuracy not yet measuredIn the citing paper
“High-affinity targeting can paradoxically worsen deep penetration by amplifying the binding-site barrier: ligands with strong receptor affinity and/or high multivalency are preferentially captured by the first accessible receptors near vessels, leading to perivascular sequestration and reduced interstitial propagation.”
From Overcoming tumor microenvironment barriers: transformable and bioinspired nanomedicine strategies for deep tumor penetration (2026) · cites this paper as [92]
In the citing paper
“In this “affinity penetration paradox,” maximizing binding strength does not necessarily maximize tumor coverage; instead, it can suppress the very trans-tissue transport that CendR programs are intended to enable [92].”
From Overcoming tumor microenvironment barriers: transformable and bioinspired nanomedicine strategies for deep tumor penetration (2026) · cites this paper as [92]
Self-check
Percentages, sums and reported differences re-computed from the paper’s own numbers.
The self-check needs the paper’s full text.
Citations
Cites
The PD1:PD-L1/2 Pathway from Discovery to Clinical Implementation
Bardhan, K., Anagnostou, T., & Boussiotis, V. A. (2016) · Frontiers in Immunology · doi:10.3389/fimmu.2016.00550 · Cited by 606
An Enigmatic Tail of CD28 Signaling
Boomer, J. S., & Green, J. M. (2010) · Cold Spring Harbor Perspectives in Biology · doi:10.1101/cshperspect.a002436 · Cited by 283
Research works printed but not linked: 88
- Abiko, 2015, IFN-γ from lymphocytes induces PD-L1 expression and promotes progression of ovarian cancer, Br. J. Cancer, 112, 1501, 10.1038/bjc.2015.101 · DOI · Paper page
- Alegre, 2001, T-cell regulation by CD28 and CTLA-4, Nat. Rev. Immunol., 1, 220, 10.1038/35105024 · DOI
- Anderson, 2020, The tumor microenvironment, Curr. Biol., 30, R921, 10.1016/j.cub.2020.06.081 · DOI · Paper page
- Betts, 2019, A translational quantitative systems pharmacology model for CD3 bispecific molecules: application to quantify T cell-mediated tumor cell killing by P-cadherin LP DART®, AAPS J., 21, 66, 10.1208/s12248-019-0332-z · DOI
- Bommhardt, 2019, Beyond TCR signaling: emerging functions of lck in cancer and immunotherapy, Int. J. Mol. Sci., 20, 3500, 10.3390/ijms20143500 · DOI
- Bordeau, 2022, Dynamic contrast-enhanced magnetic resonance imaging for the prediction of monoclonal antibody tumor disposition, Int. J. Mol. Sci., 23, 679, 10.3390/ijms23020679 · DOI
- Cattley, 2020, Transforming growth factor β (TGF-β) receptor signaling regulates kinase networks and phosphatidylinositol metabolism during T-cell activation, J. Biol. Chem., 295, 8236, 10.1074/jbc.RA120.012572 · DOI
- Cheng, 2022, A humanized 4-1BB-targeting agonistic antibody exerts potent antitumor activity in colorectal cancer without systemic toxicity, J. Transl. Med., 20, 415, 10.1186/s12967-022-03619-w · DOI
- Clavijo, 2012, Anergic CD8+ T lymphocytes have impaired NF-κB activation with defects in p65 phosphorylation and acetylation, J. Immunol., 188, 1213, 10.4049/jimmunol.1100793 · DOI
- Colard-Thomas, 2023, Comparison of clinical safety between standard versus extended interval dosing of immune checkpoint inhibitors: a real-world retrospective cohort study, ESMO Open, 8, 102070, 10.1016/j.esmoop.2023.102070 · DOI
- Coto-Llerena, 2021, Interferon lambda 4 can directly activate human CD19+ B cells and CD8+ T cells, Life Sci. Alliance, 4, e201900612, 10.26508/lsa.201900612 · DOI
- Coudronniere, 2000, NF-kappa B activation induced by T cell receptor/CD28 costimulation is mediated by protein kinase C-theta, Proc. Natl. Acad. Sci., 97, 3394, 10.1073/pnas.97.7.3394 · DOI
- Del Monte, 2009, Does the cell number 10(9) still really fit one gram of tumor tissue?, Cell Cycle, 8, 505, 10.4161/cc.8.3.7608 · DOI
- Du, 2018, A reappraisal of CTLA-4 checkpoint blockade in cancer immunotherapy, Cell Res., 28, 416, 10.1038/s41422-018-0011-0 · DOI
- Fan, 2015, Bispecific antibodies and their applications, J. Hematol. and Oncol., 8, 130, 10.1186/s13045-015-0227-0 · DOI
- Fearnley, 1999, Monitoring human blood dendritic cell numbers in normal individuals and in stem cell transplantation, Blood, 93, 728, 10.1182/blood.v93.2.728.402k03_728_736 · DOI
- Fu, 2021, USP12 promotes CD4+ T cell responses through deubiquitinating and stabilizing BCL10, Cell Death Differ., 28, 2857, 10.1038/s41418-021-00787-y · DOI
- Gan, 2022, An anti-CTLA-4 heavy chain-only antibody with enhanced Treg depletion shows excellent preclinical efficacy and safety profile, Proc. Natl. Acad. Sci. U. S. A., 119, e2200879119, 10.1073/pnas.2200879119 · DOI
- He, 2020, Immune checkpoint signaling and cancer immunotherapy, Cell Res., 30, 660, 10.1038/s41422-020-0343-4 · DOI
- Hivroz, 2022, LAG3 disrupts the TCR signal by local acidification, Nat. Immunol., 23, 649, 10.1038/s41590-022-01196-0 · DOI
- Hosseini, 2020, Mitigating the risk of cytokine release syndrome in a Phase I trial of CD20/CD3 bispecific antibody mosunetuzumab in NHL: impact of translational system modeling, npj Syst. Biol. Appl., 6, 28, 10.1038/s41540-020-00145-7 · DOI
- Huang, 2022, Abstract 5524: AK127, a novel monoclonal antibody (mAb) targeting T cell immunoreceptor (TIGIT), Cancer Res., 82, 5524, 10.1158/1538-7445.am2022-5524 · DOI
- Hui, 2017, T cell costimulatory receptor CD28 is a primary target for PD-1–mediated inhibition, Science, 355, 1428, 10.1126/science.aaf1292 · DOI · Paper page
- Hwang, 2020, Recent insights of T cell receptor-mediated signaling pathways for T cell activation and development, Exp. Mol. Med., 52, 750, 10.1038/s12276-020-0435-8 · DOI
- Jeong, 2021, Novel anti-4-1BB×PD-L1 bispecific antibody augments anti-tumor immunity through tumor-directed T-cell activation and checkpoint blockade, J. Immunother. Cancer, 9, e002428, 10.1136/jitc-2021-002428 · DOI
- Jiang, 2021, PD-L1/LAG-3 bispecific antibody enhances tumor-specific immunity, Oncoimmunology, 10, 1943180, 10.1080/2162402X.2021.1943180 · DOI
- Jorgovanovic, 2020, Roles of IFN-γ in tumor progression and regression: a review, Biomark. Res., 8, 49, 10.1186/s40364-020-00228-x · DOI · Paper page
- Kassem, 2016, A natural variant of the T cell receptor-signaling molecule Vav1 reduces both effector T cell functions and susceptibility to neuroinflammation, PLOS Genet., 12, e1006185, 10.1371/journal.pgen.1006185 · DOI
- Kästle, 2020, Tyrosine 192 within the SH2 domain of the Src-protein tyrosine kinase p56Lck regulates T-cell activation independently of Lck/CD45 interactions, Cell Commun. Signal., 18, 183, 10.1186/s12964-020-00673-z · DOI
- Keam, 2022, Cadonilimab: first approval, Drugs, 82, 1333, 10.1007/s40265-022-01761-9 · DOI
- Khaowroongrueng, 2021, Pharmacokinetics and determination of tumor interstitial distribution of a therapeutic monoclonal antibody using large-pore microdialysis, JPharmSci, 110, 3061, 10.1016/j.xphs.2021.03.022 · DOI
- Khazen, 2019, Sequential adjustment of cytotoxic T lymphocyte densities improves efficacy in controlling tumor growth, Sci. Rep., 9, 12308, 10.1038/s41598-019-48711-2 · DOI
- Kim, 4-1BB: a promising target for cancer immunotherapy, Front. Oncol., 12, 968360, 10.3389/fonc.2022.968360 · DOI
- Kim, 4-1BB: a promising target for cancer immunotherapy, Front. Oncol., 12, 968360, 10.3389/fonc.2022.968360 · DOI
- Klein, 2024, The present and future of bispecific antibodies for cancer therapy, Nat. Rev. Drug Discov., 23, 301, 10.1038/s41573-024-00896-6 · DOI
- Konstorum, 2019, A mathematical model of combined CD8 T cell costimulation by 4-1BB (CD137) and OX40 (CD134) receptors, Sci. Rep., 9, 10862, 10.1038/s41598-019-47333-y · DOI
- Kosinsky, 2018, Radiation and PD-(L)1 treatment combinations: immune response and dose optimization via a predictive systems model, J. Immunother. Cancer, 6, 17, 10.1186/s40425-018-0327-9 · DOI
- Kraman, 2020, FS118, a bispecific antibody targeting LAG-3 and PD-L1, enhances T-cell activation resulting in potent antitumor activity, Clin. Cancer Res., 26, 3333, 10.1158/1078-0432.CCR-19-3548 · DOI
- Kuang, 2020, Development and characterization of a novel anti-OX40 antibody for potent immune activation, Cancer Immunol. Immunother., 69, 939, 10.1007/s00262-020-02501-2 · DOI
- Kvarnhammar, 2019, The CTLA-4 x OX40 bispecific antibody ATOR-1015 induces anti-tumor effects through tumor-directed immune activation, J. Immunother. Cancer, 7, 103, 10.1186/s40425-019-0570-8 · DOI
- Lee, 2013, 4-1BB signaling activates the T cell factor 1 effector/β-catenin pathway with delayed kinetics via ERK signaling and delayed PI3K/AKT activation to promote the proliferation of CD8+ T cells, PLoS ONE, 8, e69677, 10.1371/journal.pone.0069677 · DOI
- Li, 2019, Current clinical progress of PD-1/PD-L1 immunotherapy and potential combination treatment in non-small cell lung cancer, Integr. Cancer Ther., 18, 1534735419890020, 10.1177/1534735419890020 · DOI
- Li, 2022, Depletion of tumor associated macrophages enhances local and systemic platelet-mediated anti-PD-1 delivery for post-surgery tumor recurrence treatment, Nat. Commun., 13, 1845, 10.1038/s41467-022-29388-0 · DOI
- Lim, 2021, The promise of bispecific antibodies: clinical applications and challenges, Cancer Treat. Rev., 99, 102240, 10.1016/j.ctrv.2021.102240 · DOI
- Liu, 2022, Blocking TIGIT/CD155 signalling reverses CD8+ T cell exhaustion and enhances the antitumor activity in cervical cancer, J. Transl. Med., 20, 280, 10.1186/s12967-022-03480-x · DOI
- Liu, 2021, CD155/TIGIT, a novel immune checkpoint in human cancers (Review), Oncol. Rep., 45, 835, 10.3892/or.2021.7943 · DOI
- Liu, 2013, Recruitment of Grb2 and SHIP1 by the ITT-like motif of TIGIT suppresses granule polarization and cytotoxicity of NK cells, Cell Death Differ., 20, 456, 10.1038/cdd.2012.141 · DOI
- Ma, 2021, Quantitative systems pharmacology modeling of PBMC-humanized mouse to facilitate preclinical immuno-oncology drug development, ACS Pharmacol. Transl. Sci., 4, 213, 10.1021/acsptsci.0c00178 · DOI
- Mansh, 2011, Ipilimumab and cancer immunotherapy: a new hope for advanced stage melanoma, Yale J. Biol. Med., 84, 381
- Martinez-Perez, 2021, 4-1BBL as a mediator of cross-talk between innate, adaptive, and regulatory immunity against cancer, Int. J. Mol. Sci., 22, 6210, 10.3390/ijms22126210 · DOI
- Milberg, 2019, A QSP model for predicting clinical responses to monotherapy, combination and sequential therapy following CTLA-4, PD-1, and PD-L1 checkpoint blockade, Sci. Rep., 9, 11286, 10.1038/s41598-019-47802-4 · DOI
- Mu, 2022, PD-L1/TIGIT bispecific antibody showed survival advantage in animal model, Clin. Transl. Med., 12, e754, 10.1002/ctm2.754 · DOI
- Muik, 2022, Preclinical characterization and phase I trial results of a bispecific antibody targeting PD-L1 and 4-1BB (GEN1046) in patients with advanced refractory solid tumors, Cancer Discov., 12, 1248, 10.1158/2159-8290.CD-21-1345 · DOI
- Nagai, Co-Inhibitory receptor signaling in T-cell-mediated autoimmune glomerulonephritis, Front. Med. (Lausanne), 7, 584382, 10.3389/fmed.2020.584382 · DOI
- Nagai, Co-Inhibitory receptor signaling in T-cell-mediated autoimmune glomerulonephritis, Front. Med., 7, 584382, 10.3389/fmed.2020.584382 · DOI
- Narayan, 2006, CARMA1 is required for Akt-mediated NF-kappaB activation in T cells, Mol. Cell. Biol., 26, 2327, 10.1128/MCB.26.6.2327-2336.2006 · DOI
- Qiao, 2022, Quantitative systems pharmacology modeling provides insight into inter-mouse variability of Anti-CTLA4 response, CPT Pharmacometrics Syst. Pharmacol., 11, 880, 10.1002/psp4.12800 · DOI
- Qiao, 2021, Cancer immune therapy with PD-1-dependent CD137 co-stimulation provides localized tumour killing without systemic toxicity, Nat. Commun., 12, 6360, 10.1038/s41467-021-26645-6 · DOI
- Runcie, 2018, Bi-specific and tri-specific antibodies-the next big thing in solid tumor therapeutics, Mol. Med., 24, 50, 10.1186/s10020-018-0051-4 · DOI
- Sanchez-Paulete, 2016, Deciphering CD137 (4-1BB) signaling in T-cell costimulation for translation into successful cancer immunotherapy, Eur. J. Immunol., 46, 513, 10.1002/eji.201445388 · DOI
- Setrerrahmane, 2017, Tumor-related interleukins: old validated targets for new anti-cancer drug development, Mol. Cancer, 16, 153, 10.1186/s12943-017-0721-9 · DOI
- Shao, 2021, TIGIT induces (CD3+) T cell dysfunction in colorectal cancer by inhibiting glucose metabolism, Front. Immunol., 12, 688961, 10.3389/fimmu.2021.688961 · DOI
- Sheppard, 2004, PD-1 inhibits T-cell receptor induced phosphorylation of the ZAP70/CD3zeta signalosome and downstream signaling to PKCtheta, FEBS Lett., 574, 37, 10.1016/j.febslet.2004.07.083 · DOI · Paper page
- Song, 2021, Mechanistic prediction of first-in-human dose for bispecific CD3/EpCAM T-cell engager antibody M701, using an integrated PK/PD modeling method, Eur. J. Pharm. Sci., 158, 105584, 10.1016/j.ejps.2020.105584 · DOI
- Sové, 2020, QSP-IO: a quantitative systems pharmacology toolbox for mechanistic multiscale modeling for immuno-oncology applications, CPT Pharmacometrics Syst. Pharmacol., 9, 484, 10.1002/psp4.12546 · DOI
- Teschner, 2011, In vitro stimulation and expansion of human tumour-reactive CD8+ cytotoxic T lymphocytes by anti-CD3/CD28/cd137 magnetic beads, Scand. J. Immunol., 74, 155, 10.1111/j.1365-3083.2011.02564.x · DOI
- Tewari, 2021, T cell receptor–dependent S-acylation of ZAP-70 controls activation of T cells, J. Biol. Chem., 296, 100311, 10.1016/j.jbc.2021.100311 · DOI
- Thumkeo, 2020, mDia1/3-dependent actin polymerization spatiotemporally controls LAT phosphorylation by Zap70 at the immune synapse, Sci. Adv., 6, eaay2432, 10.1126/sciadv.aay2432 · DOI
- Waldman, 2020, A guide to cancer immunotherapy: from T cell basic science to clinical practice, Nat. Rev. Immunol., 20, 651, 10.1038/s41577-020-0306-5 · DOI · Paper page
- Wang, 2009, Immune regulation by 4-1BB and 4-1BBL: complexities and challenges, Immunol. Rev., 229, 192, 10.1111/j.1600-065X.2009.00765.x · DOI
- Wang, 2023, Generating immunogenomic data-guided virtual patients using a QSP model to predict response of advanced NSCLC to PD-L1 inhibition, NPJ Precis. Oncol., 7, 55, 10.1038/s41698-023-00405-9 · DOI
- Wang, 2007, Transcriptional and epigenetic regulation of interleukin-2 gene in activated T cells by morphine, J. Biol. Chem., 282, 7164, 10.1074/jbc.M604367200 · DOI
- Wang, 2021, A small molecule antagonist of PD-1/PD-L1 interactions acts as an immune checkpoint inhibitor for NSCLC and melanoma immunotherapy, Front. Immunol., 12, 10.3389/fimmu.2021.654463 · DOI
- Webb, 2016, OX40, OX40L and autoimmunity: a comprehensive review, Clin. Rev. Allerg. Immunol., 50, 312, 10.1007/s12016-015-8498-3 · DOI
- Willsmore, Combined anti-PD-1 and anti-CTLA-4 checkpoint blockade: treatment of melanoma and immune mechanisms of action, Eur. J. Immunol., 51, 544, 10.1002/eji.202048747 · DOI
- Willsmore, Combined anti-PD-1 and anti-CTLA-4 checkpoint blockade: treatment of melanoma and immune mechanisms of action, Eur. J. Immunol., 51, 544, 10.1002/eji.202048747 · DOI
- Wu, 2021, Therapeutic effects of pembrolizumab combined with paclitaxel and cisplatin chemotherapy on advanced non-squamous non-small cell lung cancer and influencing factors, ijps, 83, 10.36468/pharmaceutical-sciences.757 · DOI
- Wu, 2021, Small molecule inhibitors targeting the PD-1/PD-L1 signaling pathway, Acta Pharmacol. Sin., 42, 1, 10.1038/s41401-020-0366-x · DOI
- Wu, 2019, Application of PD-1 blockade in cancer immunotherapy, Comput. Struct. Biotechnol. J., 17, 661, 10.1016/j.csbj.2019.03.006 · DOI
- Xiao, 2021, Discovery of a novel anti PD-L1 X TIGIT bispecific antibody for the treatment of solid tumors, Cancer Treat. Res. Commun., 29, 100467, 10.1016/j.ctarc.2021.100467 · DOI
- Yang, 2023, Fc-competent multispecific PDL-1/TIGIT/LAG-3 antibodies potentiate superior anti-tumor T cell response, Sci. Rep., 13, 9865, 10.1038/s41598-023-36942-3 · DOI
- Yu, 2019, Characterization of a novel anti-human lymphocyte activation gene 3 (LAG-3) antibody for cancer immunotherapy, MAbs, 11, 1139, 10.1080/19420862.2019.1629239 · DOI
- Zhang, 2023, Bispecific antibodies targeting immunomodulatory checkpoints for cancer therapy, Cancer Biol. Med., 20, 181, 10.20892/j.issn.2095-3941.2023.0002 · DOI
- Zhang, 2020, The history and advances in cancer immunotherapy: understanding the characteristics of tumor-infiltrating immune cells and their therapeutic implications, Cell Mol. Immunol., 17, 807, 10.1038/s41423-020-0488-6 · DOI
- Zhao, 2022, Dynamic multiscale regulation of perfusion recovery in experimental peripheral arterial disease: a mechanistic computational model, JACC Basic Transl. Sci., 7, 28, 10.1016/j.jacbts.2021.10.014 · DOI
- Zheng, 2019, PD-L1 expression levels on tumor cells affect their immunosuppressive activity, Oncol. Lett., 18, 5399, 10.3892/ol.2019.10903 · DOI
- Zhong, 2022, Development of a bispecific antibody targeting PD-L1 and TIGIT with optimal cytotoxicity, Sci. Rep., 12, 18011, 10.1038/s41598-022-22975-7 · DOI
- Zhou, 2024, Quantitative systems pharmacology modeling of HER2-positive metastatic breast cancer for translational efficacy evaluation and combination assessment across therapeutic modalities, Acta Pharmacol. Sin., 45, 1287, 10.1038/s41401-024-01232-9 · DOI
Cited by
Sorted by citations
Sheng, J., Yuan, W., Zhang, M., Chen, Z., Qi, Y., Zhao, Y., & Zhang, S. (2026) · Journal of Nanobiotechnology · doi:10.1186/s12951-026-04028-7 · Cited by 35
Metadata
- Authors
- Xu, Y., Yang, S., Rao, Q., Gao, Y., Zhou, G., Zhao, D., Shi, X., Chai, Y., & Zhao, C.
- Venue
- Frontiers in Pharmacology
- Publisher
- Frontiers Media SA
- Published
- 2025-04-10
- Volume
- 16
- ISSN
- 1663-9812
- PMC
- PMC12018249
- Cited by
- 3
- References
- 2
About these checks
Registry, retraction, Cites and statistics results are computed, not judged, with one exception: a printed reference that no index lists is read once by a model before it counts as a citation error. Claims are extracted by a model and kept only when their quote appears verbatim in the text; each cited source is then checked, with a model’s help, for whether it says what the claim relies on. Those verdicts can be wrong — read the claim’s quote and the cited source before relying on one.
Statistics and arithmetic are recomputed, not judged.
Confidence bands are shown only for fields calibrated on our annotated test set. None is calibrated yet, so no band is shown.
What counts as a claim ›How we measure confidence ›How we check this ›
Are you an author, or do you see a problem with this page? Request a review
