

The DOI matches its Crossref record; 254 of the 257 references it cites were found in a registry or an index.
Impacts of salinity stress on crop plants: improving salt tolerance through genetic and molecular dissection
Open accessAbstract
Improper use of water resources in irrigation that contain a significant amount of salts, faulty agronomic practices such as improper fertilization, climate change etc. are gradually increasing soil salinity of arable lands across the globe. It is one of the major abiotic factors that inhibits overall plant growth through ionic imbalance, osmotic stress, oxidative stress, and reduced nutrient uptake. Plants have evolved with several adaptation strategies at morphological and molecular levels to withstand salinity stress. Among various approaches, harnessing the crop genetic variability across different genepools and developing salinity tolerant crop plants offer the most sustainable way of salt stress mitigation. Some important major genetic determinants controlling salinity tolerance have been uncovered using classical genetic approaches. However, its complex inheritance pattern makes breeding for salinity tolerance challenging. Subsequently, advances in sequence based breeding approaches and functional genomics have greatly assisted in underpinning novel genetic variants controlling salinity tolerance in plants at the whole genome level. This current review aims to shed light on physiological, biochemical, and molecular responses under salt stress, defense mechanisms of plants, underlying genetics of salt tolerance through bi-parental QTL mapping and Genome Wide Association Studies, and implication of Genomic Selection to breed salt tolerant lines.
Overview
The claims and statistics of this paper haven’t been checked yet.
Run the check — free, no account needed. It reads the open-access text and checks the sources it cites.
Integrity signals
Registry
Cites
Statistics
Figures
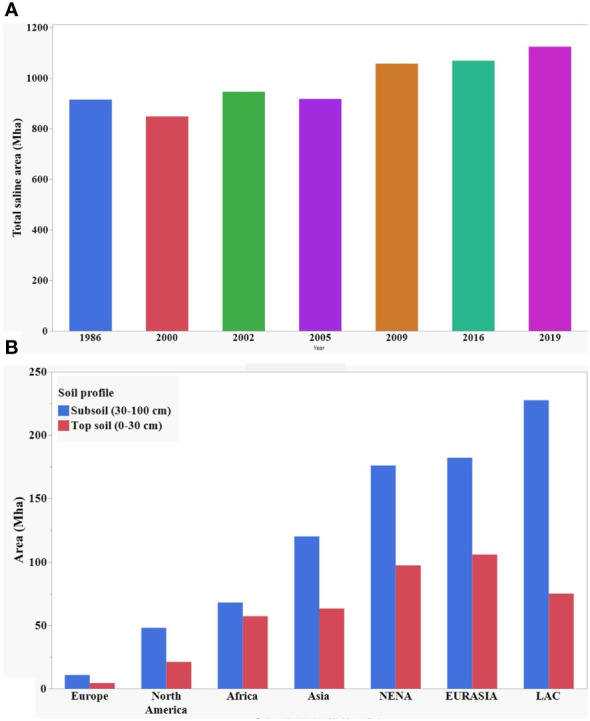
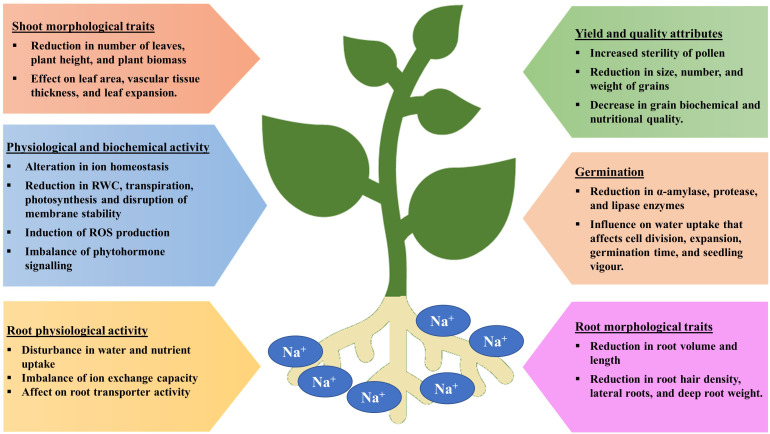
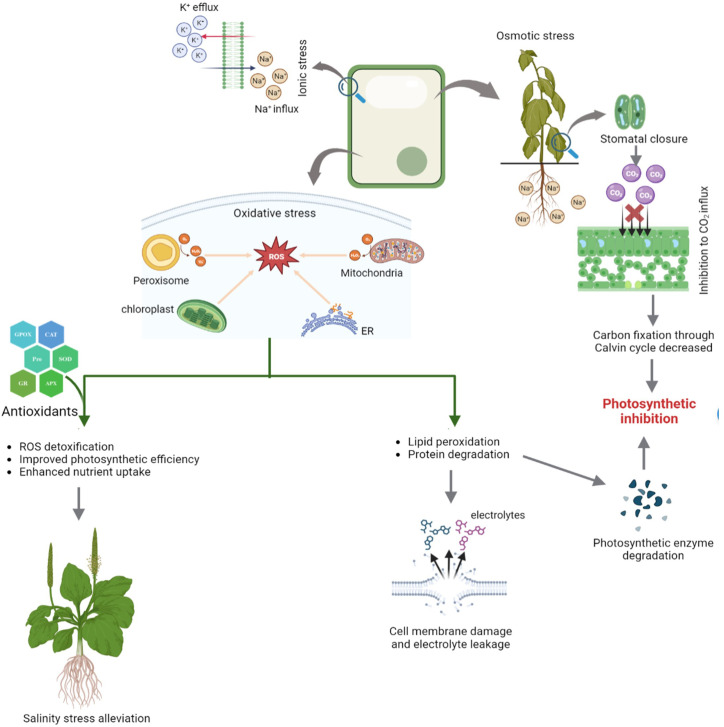
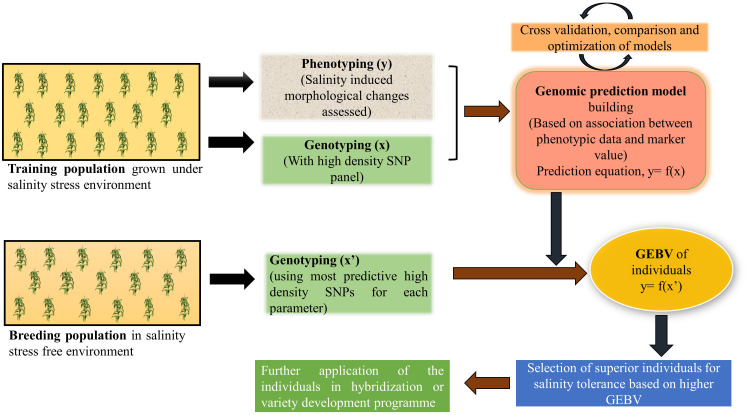
Verification
Claims the paper makes
The claims and statistics of this paper haven’t been checked yet.
Run the check — free, no account needed. It reads the open-access text and checks the sources it cites.
Claims other papers make about this one
Each is checked against this paper’s own text: does it say what the citing paper says it does?
The cited source says what the claim attributes to it.
In the citing paper
“High salt levels disrupt the ionic balance within plant tissues, particularly by competing with essential ions such as potassium (K⁺), which are necessary for the optimal functioning of many enzymes53,60.”
From Cold plasma technology as a pre-treatment for seed priming enhances germination and reduces salinity stress in Prosopis Koelziana (2025) · cites this paper as [60]
Self-check
Percentages, sums and reported differences re-computed from the paper’s own numbers.
The self-check needs the paper’s full text.
Citations
Cites
Mechanisms of Salinity Tolerance
Munns, R., & Tester, M. (2008) · Annual Review of Plant Biology · doi:10.1146/annurev.arplant.59.032607.092911 · Cited by 13,792
Prediction of Total Genetic Value Using Genome-Wide Dense Marker Maps
Meuwissen, T. H. E., Hayes, B. J., & Goddard, M. E. (2001) · Genetics · doi:10.1093/genetics/157.4.1819 · Cited by 7,917
Comparative physiology of salt and water stress
Munns, R. (2002) · Plant Cell & Environment · doi:10.1046/j.0016-8025.2001.00808.x · Cited by 6,451
Grime, J. P. (1977) · The American Naturalist · doi:10.1086/283244 · Cited by 5,754 · cited 1×
“An abiotic or biotic constraint that reduces a plant ’ s ability to convert energy to biomass can be called plant stress (Grime, 1977).”
BackgroundRoles of glycine betaine and proline in improving plant abiotic stress resistance
Ashraf, M., & Foolad, M. R. (2006) · Environmental and Experimental Botany · doi:10.1016/j.envexpbot.2005.12.006 · Cited by 4,827
Salt tolerance and salinity effects on plants: a review
Parida, A. K., & Das, A. B. (2005) · Ecotoxicology and Environmental Safety · doi:10.1016/j.ecoenv.2004.06.010 · Cited by 4,160
Asada, K. (1999) · Annual Review of Plant Physiology and Plant Molecular Biology · doi:10.1146/annurev.arplant.50.1.601 · Cited by 4,038
Mechanisms of Salt Tolerance in Nonhalophytes
Greenway, H., & Munns, R. (1980) · Annual Review of Plant Physiology · doi:10.1146/annurev.pp.31.060180.001053 · Cited by 4,000
10 Years of GWAS Discovery: Biology, Function, and Translation
Visscher, P. M., Wray, N. R., Zhang, Q., Sklar, P., McCarthy, M. I., Brown, M. A., & Yang, J. (2017) · The American Journal of Human Genetics · doi:10.1016/j.ajhg.2017.06.005 · Cited by 3,719
Na+ Tolerance and Na+ Transport in Higher Plants
Tester, M. A. (2003) · Annals of Botany · doi:10.1093/aob/mcg058 · Cited by 3,312
Research works printed but not linked: 14
- Abd El-Monem, 2013, Mitigation salinity stress effects on barley (Hordeum vulgare L.) growth, yield and some physiological aspects by hemin, J. Appl. Sci. Res., 9, 2411
- Ahmad, 2012, Salt induced changes in photosynthetic activity and oxidative defence system of three cultivars of mustard (Brassica juncea L.), Afr. J. Biotechnol., 11, 2694
- Chakraborty, 2013, Mechanism of salinity stress tolerance in crop plants and recent developments, 466
- Ehtaiwesh, 2020, Growth and yield responses of libyan hard wheat (Triticum durum Desf) genotypes to salinity stress, Zawia Univ. Bull., 22, 33
- 2015, Status of the wor’ld's soil resources (SWSR) – main report
- Nahar, 2009, Germination, growth, nodulation and yield performance of three mungbean varieties under different levels of salinity stress, Green Farming., 2, 825
- Neto, 2011, Chlorophyll fluorescence as a possible tool for salt-stress tolerance screening in the sunflower, Rev. Ciec. Agronômica., 42, 893
- Reddy, 1992, Photosynthetic studies and compartmentation of ions in different tissues of Salicornia brachiata Roxb. under saline conditions, Photosynthetica, 26, 173
- Squires, 2004, Salination, desertification, and soil erosion
- Szabolcs, 1989, Salt-affected soils
- Taiz, 2015, Plant physiology and development (No. Ed. 6)
- Vorasoot, 2003, Effect of water stress on yield and agronomic characters of peanut, Songklanakarin J. Sci. Technology., 25, 283
- Wahid, 2014, Assessing the effects of hydrogen fluoride on mango (Mangifera indica L.) in the vicinity of a brick kiln field in southern Pakistan, Fluoride., 47, 307
- Zheng, 2009, Exogenous nitric oxide improves seed germination in wheat against mitochondrial oxidative damage induced by high salinity, Environ. Exp. Bot., 67, 222227, 10.1016/j.envexpbot.2009.05.002 · DOI
Cited by
Sorted by citations
Items 301–400 of 579
Fan, G., Huang, J., Wang, H.-J., Huo, Y., Liu, P., Ullah, U., Hu, G., Ahmad, M., Shalmani, A., Fang, H., et al. (2026) · Current Issues in Molecular Biology · doi:10.3390/cimb48030317 · Cited by 1
Environmental factors influencing transformation efficiency and biomass production
Yadav, V., Nair, C., Das, U., Ahlawat, Y. K., & Biswal, A. K. (2026) · Elsevier eBooks · doi:10.1016/b978-0-443-40488-7.00004-6 · Cited by 1
Rhaman, M. S., Zulfiqar, F., Kulak, M., Yang, X., Brestič, M., & Murata, Y. (2026) · Journal of Plant Growth Regulation · doi:10.1007/s00344-026-12171-6 · Cited by 1
Ali, U., Shah, S. N., Khaskheli, M. A., Laghari, A. H., Arain, Z. A., Shehzad, M., & Laghari, A. J. (2025) · Journal of Applied Research in Plant Sciences · doi:10.38211/joarps.2025.06.328 · Cited by 1
Hernández-Andrade, E. E., Montoya-García, C. O., Gómez-Merino, F. C., & Trejo-Téllez, L. I. (2026) · Crops · doi:10.3390/crops6020043 · Cited by 1
Mariyam, S., Kumar, S., & Seth, C. S. (2026) · Journal of Plant Biochemistry and Biotechnology · doi:10.1007/s13562-026-01031-9 · Cited by 1
Li, X., Tong, C., Zheng, J., Ke, X., Zhan, Y., Min, L. I. N., Cheng, L., Wang, H., Lu, W., & Yan, Y. (2026) · Applied Microbiology and Biotechnology · doi:10.1007/s00253-026-13813-1 · Cited by 1
Huang, J., Wang, H.-J., Ding, Y., Fan, G., Gao, Y., Wubulikasimu, B., Wang, Z., Ullah, U., Khan, L., Fang, H., et al. (2026) · Frontiers in Plant Science · doi:10.3389/fpls.2026.1813443 · Cited by 1
Chowdhury, M. R., Ražná, K., Valentová, J., Švajdlenka, E., Ivanišová, E., Debnath, A. J., Mukherjee, J., Štefúnová, V., Mehmet, M., Patrícia, P., et al. (2026) · Cells · doi:10.3390/cells15090796 · Cited by 1
Advances and Challenges in Breeding Salinity-Tolerant Crops: A Path Toward Sustainable Agriculture
GUHA, P. S., Hazra, S., & Saha, N. (2026) · Springer eBooks · doi:10.1007/978-3-032-24001-9_9 · Cited by 1
Singh, A. K., Kumar, A., Udgata, A. R., Tyagi, P., Trivedi, M., & Srivastava, A. K. (2026) · Journal of Applied Biology & Biotechnology · doi:10.7324/jabb.2026.278266 · Cited by 1
Self-citationKhan, W. A., Huang, D., & Wang, G. (2026) · Communications in Soil Science and Plant Analysis · doi:10.1080/00103624.2026.2666803 · Cited by 1
Role of nanoparticles in improving plant sustainability under abiotic stress: a review
Nandi, R., Mazumder, D., Das, M., Sarkar, P., & Dasgupta, N. (2026) · Nanotechnology for Environmental Engineering · doi:10.1007/s41204-026-00519-y · Cited by 1
Kannan, P., Balasubramaniyan, G., Karuppannan, S., Swaminathan, B., Bagyaraj, M., & Karunanidhi, D. (2026) · Scientific Reports · doi:10.1038/s41598-026-52274-4 · Cited by 1
Agronomic Practices to Enhance Plant Resilience Against Salt Stress
Bairwa, R. K., Kundu, A., Meena, J. K., Goyanka, J., Kumar, A., & Kapale, V. P. (2026) · Environmental science and engineering · doi:10.1007/978-3-032-01059-9_3 · Cited by 1
Zhang, X., Chen, Y., Ren, J., Liu, X., Li, C. K., Li, G., Rong, A., Tong, Q., Xu, Q., & Zhang, J. (2026) · Industrial Crops and Products · doi:10.1016/j.indcrop.2026.123623 · Cited by 1
Regasa, B., Fituma, K., Chimdi, A., & Yimer, S. (2026) · Waste Management Bulletin · doi:10.1016/j.wmb.2026.100329 · Cited by 1
Singh, N., Talwar, D., Singh, K. G., Babanjeet, Jindal, S. K., Singh, J., Mahala, P., & Verma, J. (2026) · Frontiers in Plant Science · doi:10.3389/fpls.2026.1786599 · Cited by 1
Evolution of Strigolactone as an Oxidative Stress Mitigator in Plants
Ilyas, M., Malik, Z., Zaib-un-Nisa, & Ali, N. (2026) · CABI eBooks · doi:10.1079/9781836990598.0009 · Cited by 1
Sampedro‐Guerrero, J., Avendaño, V. A., Khalili, M., Gómez‐Cadenas, ., & Clausell-Terol, C. (2026) · Plant Physiology and Biochemistry · doi:10.1016/j.plaphy.2026.111654 · Cited by 1
Alkan, Ç., & Devlet, A. (2026) · Sustainability · doi:10.3390/su18126272 · Cited by 1
Manhou, K., Moussadek, R., Zouahri, A., Belmahi, Z., Lhaj, M. O., Sanad, H., Yachou, H., Hmouni, D., & Dakak, H. (2026) · Plants · doi:10.3390/plants15121899 · Cited by 1
Yadav, A. K., Devate, N. B., Barpete, S., Singh, V., Basarahalli, S., Das, A., Gebregziabher, B. S., Patidar, J., Namdeo, R., & Kumar, S. (2026) · Frontiers in Genetics · doi:10.3389/fgene.2026.1863296 · Cited by 1
Wagaw, K., Lupo, Y., Sikron-Persi, N., Acuña, T., Lazarovitch, N., & Fait, A. (2026) · Plant Stress · doi:10.1016/j.stress.2026.101456 · Cited by 1
Soothar, M. K., Qi, Y., Du, G., Jakhro, M. I., Leghari, S. J., & Sootahar, M. K. (2026) · Journal of soil science and plant nutrition · doi:10.1007/s42729-026-03401-7 · Cited by 1
Khalefa, M. A. I., Younes, N. A., & Yousef, A. F. (2026) · Scientific Reports · doi:10.1038/s41598-026-60493-y · Cited by 1
Jha, Y., Mohamed, H. I., Elkatry, H. O., & Ahmed, A. R. (2026) · Journal of Plant Growth Regulation · doi:10.1007/s00344-026-12293-x · Cited by 1
Patil, M., Patil, S. S., Mahadule, P. A., Pawar, A. R., Gade, K. A., & Thangasamy, A. (2026) · Frontiers in Plant Science · doi:10.3389/fpls.2026.1860923 · Cited by 1
Nigam, B., Rathore, D., & Chaudhary, I. J. (2026) · Journal of Crop Science and Biotechnology · doi:10.1007/s12892-026-00372-0 · Cited by 1
da Silva, T. L. C., Braga, Í. D. O., Barbosa, L. F., Leão, A. P., dos Santos, W. R., Togawa, R. C., Martins, N. F., de Sousa, C. A. F., & Souza, M. T. (2026) · Plant Science · doi:10.1016/j.plantsci.2026.113347 · Cited by 1
Ramulu, C., Pandit, V. B., Kamalakar, J. A., Uma, R. R., & Sai, D. (2026) · Plant Science Today · doi:10.14719/pst.15514 · Cited by 1
Sadhanandan, S., Suresh, P., Priya, S. N., Suseem, S. R., & Muneer, S. (2026) · Plant Nano Biology · doi:10.1016/j.plana.2026.100334 · Cited by 1
Venuaravind, C., Thirukumaran, K., Karthikeyan, R., Suganthy, M., & Vellaikumar, S. (2026) · Plant Physiology Reports · doi:10.1007/s40502-026-00987-z · Cited by 1
Farooq, M., Khan, A., Hassan, A., & Shah, M. M. (2026) · Plant Breeding · doi:10.1111/pbr.70126 · Cited by 1
Nadaf, R. A., Rai, S., Kant, C., Sathishkumar, R., Bansal, S., Budhlakoti, N., & Kumar, S. (2026) · Plant Physiology Reports · doi:10.1007/s40502-026-01013-y · Cited by 1
Sharma, A., Kumar, A., Kaushik, S., Chahal, S., Verma, K., Kumar, R., & Mann, A. (2024) · Journal of Plant Nutrition · doi:10.1080/01904167.2024.2391045 · Cited by 1
Enhancing food security amid climate change through rewilding and de novo domestication
Hawkesford, M. J. (2024) · Frontiers in Science · doi:10.3389/fsci.2024.1531043 · Cited by 1
El-Katony, T. M., & El-Moghrbi, N. G. (2024) · Egyptian Journal of Botany · doi:10.21608/ejbo.2024.301906.2910 · Cited by 1
Salinity Stress Response in Some Romanian Tree Species: A Case Study
Morar, I. M. T., & Truta, A. M. (2025) · Sustainable development and biodiversity · doi:10.1007/978-981-97-9819-3_9 · Cited by 1
Yadav, M., Kumar, V., Ahmad, F., Saxena, M. S., & Saxena, S. C. (2025) · CABI Reviews · doi:10.1079/cabireviews.2025.0053 · Cited by 1
229Chapter 6 Impact of salinity stress on medicinal and aromatic plant biotechnology
Ahmadi, F. (2025) · De Gruyter eBooks · doi:10.1515/9783111469713-006 · Cited by 1
Shekhawat, P. K., Jakhar, M. L., Punia, S., Singh, Z., Kiran, R., & Singh, V. (2026) · Journal of soil salinity and water quality. · doi:10.56093/jsswq.v18i1.178798 · Cited by 1
Jadhav, P. R., Jagtap, A. Y., Shinde, N. A., Kasar, P., Sarode, D. K., Pagariya, M. C., Prasad, K. V., & Kawar, P. G. (2026) · Cureus Journal of Agriculture and Food Science · doi:10.7759/s44497-025-00081-6 · Cited by 1
Zaghdoud, C., Solano, C. J., Franco, J. A., Bañón, S., Fernández, J. A., & Martínez‐Ballesta, M. D. C. (2025) · Plant Science · doi:10.1016/j.plantsci.2025.112789 · Cited by 1
Water Biomass Environment for Recovery of Saline Soils for Sugarcane Production
Javed, S., & Nazir, T. (2026) · Wiley eBooks · doi:10.1002/9781394248087.ch10 · Cited by 1
Sousa, I. T., Ferraz, D. D. S., de Carvalho, R. L., da Silva, A. M., Júnior, L. G. M. D. F., d’Albuquerque, B. S., & Santos, S. C. (2024) · Revista Brasileira de Geografia Física · doi:10.26848/rbgf.v17.1.p626-637
Saber, A. A., Abdelraouf, R. E., Khaled, K. A., Moustafa, E., & Samaha, G. M. (2024) · Research Square · doi:10.21203/rs.3.rs-4587950/v1
Sukitprapanon, T. (2024) · Research Square · doi:10.21203/rs.3.rs-4516415/v1
Bronnikova, L. I. (2024) · Науковий вісник Ужгородського університету Серія Біологія · doi:10.32782/1998-6475.2023.55.17-21
Karaca, C., Aslan, G. E., Kurunç, A., Baştuğ, R., Navarro, A., & Buyuktas, D. (2024) · EARTH SCIENCES AND HUMAN CONSTRUCTIONS · doi:10.37394/232024.2024.4.22
Abu-Ellail, F. F. B., Abdelkawy, R. N. F., & Sadek, K. A. (2025) · Research Square · doi:10.21203/rs.3.rs-5747758/v1
Ion specificity of salt glands in zoysiagrass under different exposures to sodium and potassium
Jespersen, D., Saab, J. A., & Draughn, M. (2025) · International Turfgrass Society research journal · doi:10.1002/its2.193
Self-citationKhodadadi, Z., Moudi, M., Mousavi-Kuohi, S. M., & Hosseinzadeh, M. S. (2024) · Journal of Soil and Plant Interactions · doi:10.47176/jspi.15.3.21451
Exogenous priming and abiotic stress challenges
Dikilitaş, M., Shikari, A. B., Baran, B., & Mishra, A. (2025) · Elsevier eBooks · doi:10.1016/b978-0-443-13490-6.00001-1
THE ROLE OF PHYTOHORMONES IN PHYTOREMEDIATION USING REED
KOČÍŘOVÁ, J., Nováková, J., Plačková, L., Melčáková, I., Hekera, P., Stalmachová, B., Andráš, P., & Doležal, K. (2025) · Carpathian Journal of Earth and Environmental Sciences · doi:10.26471/cjees/2025/020/324
Kuo, W.-N., Chen, P.-J., Guo, Z., Ho, M.-C., Ting, C.-L., & Yang, S.-Y. (2025) · Journal of Visualized Experiments · doi:10.3791/67580
Investigation of Salinity Tolerance Related Gene Expression in Rice (Oryza sativa L.)
Salman, A., Meriç, S., Gümüş, T., Atak, Ç., & Ayan, A. (2025) · Celal Bayar Üniversitesi Fen Bilimleri Dergisi · doi:10.18466/cbayarfbe.1529138
Awasthi, A., Tripathi, A., Baran, C., Tiwari, A., Sharma, S., Shukla, S., Pandey, S., & Uttam, K. N. (2025) · Analytical Letters · doi:10.1080/00032719.2025.2490660
Study of ESP-SAR in ex-gold mining soil ameliorated with geo-biomaterial
Prasetyo, T. B., Maulana, A., Harianti, M., Monikasari, M., Dwipa, I., Darfis, I., Rezki, D., & Herviyanti, H. (2025) · IOP Conference Series Earth and Environmental Science · doi:10.1088/1755-1315/1469/1/012034
Nanotechnology is an Emerging Tool for Stress Management in Crop Plants
Anas, M., Umar, M., & Razzak, A. (2025) · Wiley eBooks · doi:10.1002/9783527849949.ch04
Sharma, S., Singh, D., Nisha, N., Anuja, Sukhchain, Lakhlan, M., Rani, S., Malik, V., Bhavana, M., Lata, P., et al. (2025) · Elsevier eBooks · doi:10.1016/b978-0-443-26549-5.00017-5
Induction of Tolerance to Abiotic Stress by Applying Nanostimulants to Crops
Tortella, G., Rodríguez, R., Durán, P., Fernández-Baldo, M., Schoebitz, M., Tighe, R., Pieretti, J. C., & Fincheira, P. (2025) · Smart nanomaterials technology · doi:10.1007/978-981-96-4648-7_8
Nazish, M., Kamal, A., Zafar, M., Khan, M. A., Rahman, K. U., Ahmad, M., Arif, S., Farraj, D. A. A., Elshikh, M. S., & Lackner, M. K. (2025) · Scientific Reports · doi:10.1038/s41598-025-00961-z
RetractedKisiriko, M., Bitchagno, G. T. M., Harflett, C., Dias, C. N., Naboulsi, I., Anastasiadi, M., Terry, L. A., Sobeh, M., Beale, M. H., & Ward, J. L. (2025) · Industrial Crops and Products · doi:10.1016/j.indcrop.2025.121355
Influence of the Rootstock/Scion Combination on Behavior of Pear Under Salt Stress
Mirabdulbaghi, M., & Zarghami, R. (2025) · Applied Fruit Science · doi:10.1007/s10341-025-01430-7
Gupta, S. (2025) · International Journal for Research in Applied Science and Engineering Technology · doi:10.22214/ijraset.2025.72895
Allem, A., Tarnai, R., Tóth, S., Abido, W. A. E., & Dulái, S. (2025) · Photosynthetica · doi:10.32615/ps.2025.019
Dhumal, R. C., & Sadgir, P. (2025) · International Journal of Environmental & Analytical Chemistry · doi:10.1080/03067319.2025.2534027
Contribution of antioxidants (enzymatic and nonenzymatic) in salinity stress tolerance in plants
Zhao, S., & Riaz, M. (2025) · Elsevier eBooks · doi:10.1016/b978-0-443-14139-3.00004-x
Impact of plant growth promoting microorganisms on draught and salinity stress management
Kaushal, K., Sruthy, K. S., Singh, A. K., Kumar, A., & Raj, A. (2025) · Elsevier eBooks · doi:10.1016/b978-0-443-26520-4.00009-3
Self-citationSilva, D. J. M. D., Dharaka, B. D. P., Jayasuriya, K. M. G. G., & Vandelook, F. E. A. (2025) · Plant Ecology and Evolution · doi:10.5091/plecevo.161947
GABA as a Protectant Against Salinity Stress
Jalil, S. U., Ansari, S. A., & Ansari, M. I. (2025) · Springer eBooks · doi:10.1007/978-981-95-0437-4_7
New Plant Breeding Technologies for Climate-Smart Agriculture: Enhancing Abiotic Stress Tolerance
Gatica-Arias, A., & Hernández-Soto, A. (2025) · Springer eBooks · doi:10.1007/978-981-95-0583-8_18
Gheisary, E., Kazemeini, S. A., Samadi, M., & Alinia, M. (2025) · Scientific Reports · doi:10.1038/s41598-025-18660-0
Haj-Amor, Z., Bouri, A., Brahim, F. B., Dhaouadi, L., Hadji, R., & Bouri, S. (2025) · Water Conservation Science and Engineering · doi:10.1007/s41101-025-00446-0
Adhikari, S., Datar, R., Mehrotra, S., Mehrotra, R., & Bacher, G. G. (2025) · IEEE Sensors Letters · doi:10.1109/lsens.2025.3623927
Alsar, Z., Duskinova, B., Гаджимурадова, А. М., И., И. К., Zhagipar, F. S., & Insepov, Z. A. (2025) · HERALD OF SCIENCE OF S SEIFULLIN KAZAKH AGRO TECHNICAL UNIVERSITY · doi:10.51452/kazatu.2025.3(127).1997
Melatonin: Harmonizing photosynthesis in horticultural plants amidst environmental stresses
Cisse, E.-H. M., & Gajanayake, K. B. (2025) · Elsevier eBooks · doi:10.1016/b978-0-443-33851-9.00006-3
Nishad, J., Chowrasia, S., Mishra, S., Panda, A. K., Chongtham, N., & Mondal, T. K. (2025) · Journal of Plant Growth Regulation · doi:10.1007/s00344-025-11919-w
Review on Reclamation of Saline Soil by Leaching
Abdulaali, H. H., Sung, C. T. B., Obaidi, A. M. S. A., & M.Yassin, M. (2025) · doi:10.38124/ijisrt/25sep1363
Ntoulas, N., Spyropoulos, C., Paraskevopoulou, A. T., Podaropoulou, L., & Bertsouklis, Κ. F. (2025) · Land · doi:10.3390/land14112214
Synergistic Effects of Cronobacter sp. BR4 and Date Palm Biochar on Salt-Stressed Tomato Physiology
Muhanna, K. I. B., Tarroum, M., Al‐Qurainy, F., Al-Hashimi, A., Khan, S., Salih, A. M., Nadeem, M., & Karuppiah, P. (2025) · Journal of soil science and plant nutrition · doi:10.1007/s42729-025-02825-x
Singh, R., Gull, M., Gandhi, S. G., & Bhanwaria, R. (2025) · Research Square · doi:10.21203/rs.3.rs-7984834/v1
Chatterjee, A., Ghosh, P., Das, S., Sharaff, M. M., Mandal, S., Bhattacharya, P. M., Chaudhuri, T., & Pal, H. (2025) · Plant Cell Reports · doi:10.1007/s00299-025-03673-w
Flavonoids for salt stress regulation
Crivei, I. C., Marc, R. A., Rațu, R. N., Stoica, F., Veleşcu, I. D., Lipșa, F. D., Marțiș, G. S., MUREȘAN, C. C., Constrantinescu, C. G., & Postolache, A. N. (2025) · Elsevier eBooks · doi:10.1016/b978-0-443-26795-6.00009-x
Liu, C., Luo, R., Niu, R., Hou, S., Zhang, Z., Li, Y., & Zhou, Y. (2026) · Journal of soil science and plant nutrition · doi:10.1007/s42729-026-03494-0
Emu, N. J., Mim, N. J., & Ali, M. Y. (2025) · Polnohospodarstvo · doi:10.2478/agri-2025-0009
Physiological and morphological responses of three rice varieties under NaCl stress
Himami, R., Sholihah, N. F., Jundana, M. Q., Ramadhana, R. D., Habila, S., & Saputro, T. B. (2025) · BIO Web of Conferences · doi:10.1051/bioconf/202520203011
Histological and Immunohistological Alterations in Carrot Roots and Leaves Under Salt Stress
Kurczynska, E. U., Sala, K., Godel-Jędrychowska, K., Szymonik, K., Klimek‐Chodacka, M., & Barański, R. (2025) · International Journal of Molecular Sciences · doi:10.3390/ijms262412027
Soil amendments mitigate the adverse impacts of salt stress on quinoa under greenhouse conditions
Bourhim, M. R., Hirich, A., Qaddoury, A., Farissi, M., & Ghoulam, C. (2025) · Journal of the Science of Food and Agriculture · doi:10.1002/jsfa.70364
Choudhary, N., Mochi, V., Patel, M., Thakkar, A., Vyas, S., Yadav, V. K., & Patel, A. (2025) · BioNanoScience · doi:10.1007/s12668-025-02251-4
Aslam, A., Aslam, S., Amjad, A., Amjad, E., & Ditta, A. (2025) · Smart nanomaterials technology · doi:10.1007/978-981-96-9298-9_10
Kar, B. R., Biswal, J., Pradhan, A., Oram, D., Sahoo, S., Kumari, A., & Tripathy, S. (2025) · SSRN Electronic Journal · doi:10.2139/ssrn.5772633
Self-citationNanoformulations and Plant Saline Stress Resistance
Ajanaku, C. O., Fabiyi, O. A., Owolabi, A. O., Ajanaku, K. O., & Akinsiku, A. A. (2025) · Nanotechnology in the life sciences · doi:10.1007/978-3-031-90617-6_4
Genetic engineering of phytochrome B and PIFs: Unlocking crop productivity and stress resilience
Bianchetti, R., Khan, T. A., Tran, L. P., & Gururani, M. A. (2025) · Plant Stress · doi:10.1016/j.stress.2025.101195
Levent, A. İ., & Temizel, K. E. (2025) · Toprak Bilimi ve Bitki Besleme Dergisi · doi:10.33409/tbbbd.1800321
Biofortification in vegetable crops
Singh, S., Singh, S., & Bahadur, V. (2025) · International Journal of Advanced Biochemistry Research · doi:10.33545/26174693.2025.v9.i12ss.6778
Growth, Photosynthetic Performance, and Water Relations of Weeds under Salt Stress
Bandeira, J. N., de Oliveira, L. M., Bezerra, L. R. F. C., Pinto, A. C., Pereira, R. K. V., de Moraes, V. M. P., Hernández, M. C. R., Silva, D. V., & Ribeiro, J. E. D. S. (2026) · ACS Agricultural Science & Technology · doi:10.1021/acsagscitech.5c00586
Overexpression of SlPSAN promotes salinity stress tolerance in tomato seedlings
Anwar, A., Chen, C., Hu, C., Chen, M., Ghorbanpour, M., Su, W., Chen, R., & Song, S. (2026) · Plant Stress · doi:10.1016/j.stress.2026.101226
Kasar, S. K., Roylawar, P., Furtado, B. U., Khandagale, K. S., Nanda, S., Bhandari, S., Khyade, M. S., Gedam, P. A., Bhandari, H. R., Mahajan, V., et al. (2026) · Frontiers in Plant Science · doi:10.3389/fpls.2025.1686434
Metadata
- Authors
- Atta, K., Mondal, S., Gorai, S., Singh, A. P., Kumari, A., Ghosh, T., Roy, A., Hembram, S., Gaikwad, D. J., Mondal, S., Bhattacharya, S., Jha, U. C., & Jespersen, D.
- Affiliations
- Bidhan Chandra Krishi Viswavidyalaya (IN)
- Indian Council of Agricultural Research (IN)
- Government of West Bengal (IN)
- Centurion University of Technology and Management (IN)
- Indian Institute of Pulses Research (IN)
- University of Georgia (US)
- Corresponding author
- Gorai, Shouvik
- Jespersen, David
- ORCID
- Venue
- Frontiers in Plant Science
- Publisher
- Frontiers Media SA
- Published
- 2023-09-15
- Volume
- 14
- Pages
- 1241736-1241736
- ISSN
- 1664-462X (ISSN-L)
- PMC
- PMC10540871
- OpenAlex
- W4386836861
- Cited by
- 523
- References
- 257
- Citations by year
- 2026: 232 · 2025: 212 · 2024: 79
- FWCI
- 12.53
- Type
- journal article
- Language
- en
- Open access
- gold
- doi.org
- Licence
- Locations
- Frontiers in Plant Science (publishedVersion, cc-by)
- PubMed Central (publishedVersion, cc-by)
- PubMed (publishedVersion)
- DOAJ (DOAJ: Directory of Open Access Journals) (submittedVersion, cc-by-sa)
- Topics
- Life Sciences › Agricultural and Biological Sciences › Plant Science › Plant Stress Responses and Tolerance
- Life Sciences › Biochemistry, Genetics and Molecular Biology › Genetics › Genetic Mapping and Diversity in Plants and Animals
- Life Sciences › Agricultural and Biological Sciences › Plant Science › Genetics and Plant Breeding
- Keywords
- salt stress, salt tolerance, cultivated plants, soil salinity, osmotic stress, oxidative stress, ionic imbalance, nutrient uptake, plant adaptation strategies, QTL mapping, genome-wide association study, genomic selection, salt tolerance breeding, functional genomics
About these checks
Registry, retraction, Cites and statistics results are computed, not judged, with one exception: a printed reference that no index lists is read once by a model before it counts as a citation error. Claims are extracted by a model and kept only when their quote appears verbatim in the text; each cited source is then checked, with a model’s help, for whether it says what the claim relies on. Those verdicts can be wrong — read the claim’s quote and the cited source before relying on one.
Statistics and arithmetic are recomputed, not judged.
Confidence bands are shown only for fields calibrated on our annotated test set. None is calibrated yet, so no band is shown.
What counts as a claim ›How we measure confidence ›How we check this ›
Are you an author, or do you see a problem with this page? Request a review
