

The DOI matches its Crossref record; 52 of the 53 references it cites were found in a registry or an index.
GANterfactual—Counterfactual Explanations for Medical Non-experts Using Generative Adversarial Learning
Open accessAbstract
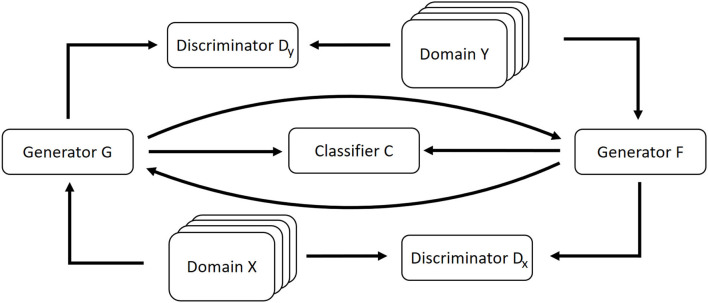
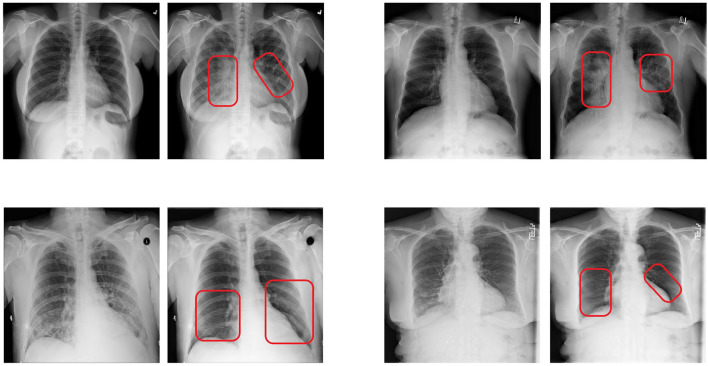
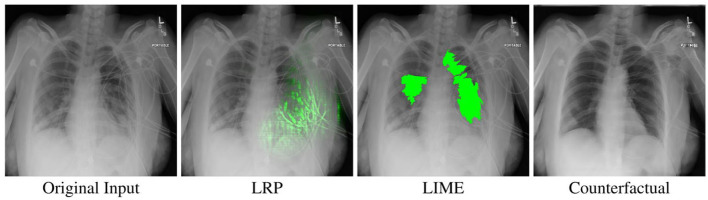
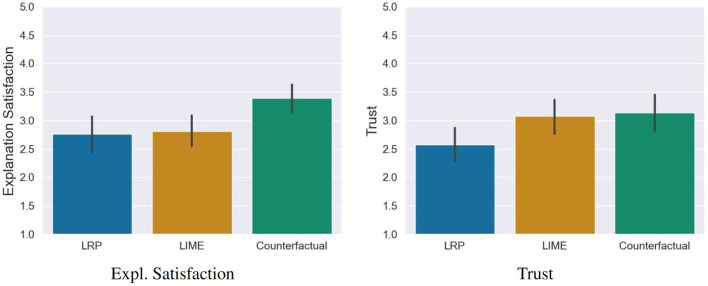
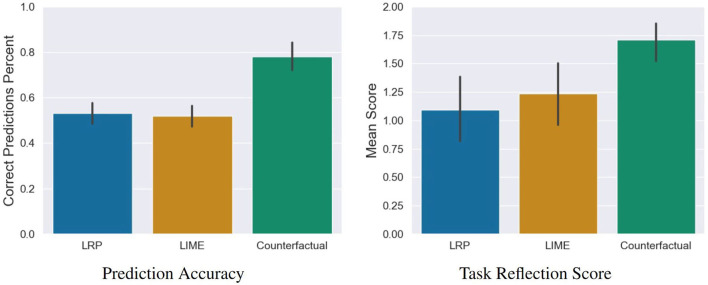
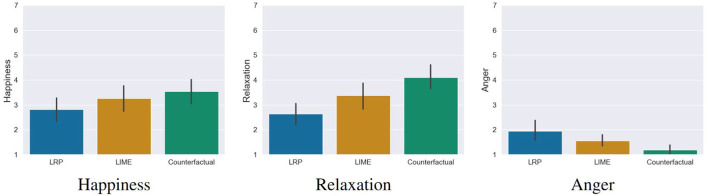
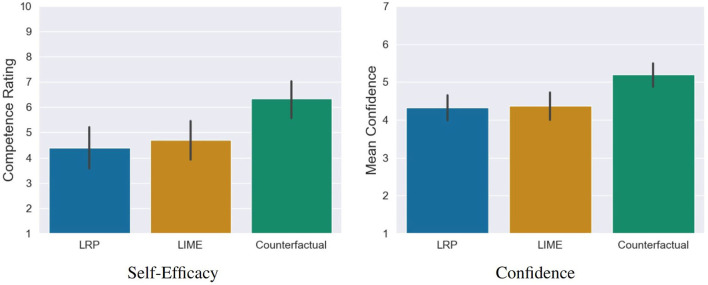
With the ongoing rise of machine learning, the need for methods for explaining decisions made by artificial intelligence systems is becoming a more and more important topic. Especially for image classification tasks, many state-of-the-art tools to explain such classifiers rely on visual highlighting of important areas of the input data. Contrary, counterfactual explanation systems try to enable a counterfactual reasoning by modifying the input image in a way such that the classifier would have made a different prediction. By doing so, the users of counterfactual explanation systems are equipped with a completely different kind of explanatory information. However, methods for generating realistic counterfactual explanations for image classifiers are still rare. Especially in medical contexts, where relevant information often consists of textural and structural information, high-quality counterfactual images have the potential to give meaningful insights into decision processes. In this work, we present GANterfactual , an approach to generate such counterfactual image explanations based on adversarial image-to-image translation techniques. Additionally, we conduct a user study to evaluate our approach in an exemplary medical use case. Our results show that, in the chosen medical use-case, counterfactual explanations lead to significantly better results regarding mental models, explanation satisfaction, trust, emotions, and self-efficacy than two state-of-the art systems that work with saliency maps, namely LIME and LRP.
Overview
The claims and statistics of this paper haven’t been checked yet.
Run the check — free, no account needed. It reads the open-access text and checks the sources it cites.
Integrity signals
Registry
Cites
Statistics
Figures
Verification
Claims the paper makes
The claims and statistics of this paper haven’t been checked yet.
Run the check — free, no account needed. It reads the open-access text and checks the sources it cites.
Claims other papers make about this one
Each is checked against this paper’s own text: does it say what the citing paper says it does?
In the citing paper
“However, a limitation of this method is its lack of flexibility and strong model-specificity since a slight change in the task would require the acquisition of a new dataset alongside another training of the CycleGAN and the binary classifier.”
From Explainable AI in medical imaging: An overview for clinical practitioners – Beyond saliency-based XAI approaches (2023) · cites this paper as [32]
In the citing paper
“The authors stated that counterfactual explanations led to significantly better results regarding mental models, explanation satisfaction, and trust.”
From Explainable AI in medical imaging: An overview for clinical practitioners – Beyond saliency-based XAI approaches (2023) · cites this paper as [32]
In the citing paper
“Dependence on binary classifier”
From Explainable AI in medical imaging: An overview for clinical practitioners – Beyond saliency-based XAI approaches (2023) · cites this paper as [32]
In the citing paper
“Intuitive explainability by contrastive setting, even for non-experts”
From Explainable AI in medical imaging: An overview for clinical practitioners – Beyond saliency-based XAI approaches (2023) · cites this paper as [32]
In the citing paper
“Lack of flexibility”
From Explainable AI in medical imaging: An overview for clinical practitioners – Beyond saliency-based XAI approaches (2023) · cites this paper as [32]
Self-check
Percentages, sums and reported differences re-computed from the paper’s own numbers.
The self-check needs the paper’s full text.
Citations
Cites
ImageNet classification with deep convolutional neural networks
Krizhevsky, A., Sutskever, I., & Hinton, G. E. (2017) · Communications of the ACM · doi:10.1145/3065386 · Cited by 112,155
Three Approaches to Qualitative Content Analysis
Hsieh, H.-F., & Shannon, S. E. (2005) · Qualitative Health Research · doi:10.1177/1049732305276687 · Cited by 44,601
Statistical Power Analysis for the Behavioral Sciences
Cohen, J. (2013) · doi:10.4324/9780203771587 · Cited by 25,373
Unpaired image-to-image translation using cycle-consistent adversarial networks
Zhu, J.-Y., Park, T., Isola, P., & Efros, A. A. (2017) · 2017 IEEE International Conference on Computer Vision (ICCV) · doi:10.1109/iccv.2017.244 · Cited by 23,602
Image-to-Image Translation with Conditional Adversarial Networks
Isola, P., Zhu, J.-Y., Zhou, T., & Efros, A. A. (2017) · 2017 IEEE Conference on Computer Vision and Pattern Recognition (CVPR) · doi:10.1109/cvpr.2017.632 · Cited by 22,930
Labaca-Castro, R. (2023) · Springer eBooks · doi:10.1007/978-3-658-40442-0_9 · Cited by 21,119
GAN(Generative Adversarial Nets)
淳司, 柴. (2017) · Journal of Japan Society for Fuzzy Theory and Intelligent Informatics · doi:10.3156/jsoft.29.5_177_2 · Cited by 20,507
"Why Should I Trust You?": Explaining the Predictions of Any Classifier
Ribeiro, M. T., Singh, S., & Guestrin, C. (2016) · Proceedings of the 22nd ACM SIGKDD International Conference on Knowledge Discovery and Data Mining · doi:10.1145/2939672.2939778 · Cited by 17,555
Proceedings of IEEE International Conference on Computer Vision
(1995) · IEEE/CVF International Conference on Computer Vision (ICCV) · doi:10.1109/iccv.1995.466933 · Cited by 13,117
Barredo Arrieta, A., Díaz-Rodríguez, N., Del Ser, J., Bennetot, A., Tabik, S., Barbado, A., Garcia, S., Gil-Lopez, S., Molina, D., Benjamins, R., et al. (2020) · Information Fusion · doi:10.1016/j.inffus.2019.12.012 · Cited by 10,423
Explanation in artificial intelligence: Insights from the social sciences
Miller, T. (2019) · Artificial Intelligence · doi:10.1016/j.artint.2018.07.007 · Cited by 5,302
On Pixel-Wise Explanations for Non-Linear Classifier Decisions by Layer-Wise Relevance Propagation
Bach, S., Binder, A., Montavon, G., Klauschen, F., Müller, K.-R., & Samek, W. (2015) · PLOS ONE · doi:10.1371/journal.pone.0130140 · Cited by 4,524
StarGAN: Unified Generative Adversarial Networks for Multi-domain Image-to-Image Translation
Choi, Y., Choi, M., Kim, M., Ha, J.-W., Kim, S., & Choo, J. (2018) · 2018 IEEE/CVF Conference on Computer Vision and Pattern Recognition · doi:10.1109/cvpr.2018.00916 · Cited by 4,163
Proceedings of IEEE Conference on Computer Vision and Pattern Recognition
(1994) · IEEE Computer Society Conference on Computer Vision and Pattern Recognition/Proceedings - IEEE Computer Society Conference on Computer Vision and Pattern Recognition/Proceedings · doi:10.1109/cvpr.1994.323798 · Cited by 1,490
Explainable AI: From black box to glass box
Rai, A. (2020) · Journal of the Academy of Marketing Science · doi:10.1007/s11747-019-00710-5 · Cited by 1,317
Interpretable Machine Learning
Molnar, C. (2020) · Cited by 1,104
Counterfactual explanations without opening the black box: automated decisions and the GDPR
Wachter, S., Mittelstadt, B., & Russell, C. (2017) · SSRN Electronic Journal · doi:10.2139/ssrn.3063289 · Cited by 1,061
Layer-Wise Relevance Propagation: An Overview
Montavon, G., Binder, A., Lapuschkin, S., Samek, W., & Müller, K. (2019) · Lecture notes in computer science · doi:10.1007/978-3-030-28954-6_10 · Cited by 883
iml: An R package for Interpretable Machine Learning
Molnar, C. (2018) · The Journal of Open Source Software · doi:10.21105/joss.00786 · Cited by 720
What do we need to build explainable AI systems for the medical domain?
Holzinger, A., Biemann, C., Pattichis, C. S., & Kell, D. B. (2017) · arXiv · doi:10.48550/arxiv.1712.09923 · Cited by 636
Unmasking Clever Hans predictors and assessing what machines really learn
Lapuschkin, S., Wäldchen, S., Binder, A., Montavon, G., Samek, W., & Müller, K. (2019) · RePEc: Research Papers in Economics · Cited by 580
Metrics for explainable AI: challenges and prospects
Hoffman, R. R., Mueller, S. T., Klein, G., & Litman, J. (2018) · arXiv · doi:10.48550/arxiv.1812.04608 · Cited by 518
Open Set Learning with Counterfactual Images
Neal, L., Olson, M., Fern, X. Z., Wong, W., & Li, F. (2018) · Lecture notes in computer science · doi:10.1007/978-3-030-01231-1_38 · Cited by 510
The Discrete Emotions Questionnaire: a new tool for measuring state self-reported emotions
Harmon-Jones, C., Bastian, B., & Harmon-Jones, E. (2016) · PLOS ONE · doi:10.1371/journal.pone.0159915 · Cited by 473
Interpretable Counterfactual Explanations Guided by Prototypes
Looveren, A. V., & Klaise, J. (2021) · Lecture notes in computer science · doi:10.1007/978-3-030-86520-7_40 · Cited by 448
Interpretable deep neural networks for single-trial EEG classification
Sturm, I., Lapuschkin, S., Samek, W., & Müller, K. (2016) · Journal of Neuroscience Methods · doi:10.1016/j.jneumeth.2016.10.008 · Cited by 396
Counterfactual Visual ExplanationsPreprint
Goyal, Y., Wu, Z., Ernst, J., Batra, D., Parikh, D., & Lee, S. (2019) · arXiv (Cornell University) · doi:10.48550/arxiv.1904.07451 · Cited by 341
Theoretical Considerations and Development of a Questionnaire to Measure Trust in Automation
Körber, M. (2019) · Advances in Intelligent Systems and Computing · doi:10.1007/978-3-319-96074-6_2 · Cited by 317
Counterfactuals in Explainable Artificial Intelligence (XAI): Evidence from Human Reasoning
Byrne, R. M. J. (2019) · Proceedings of the Twenty-Eighth International Joint Conference on Artificial Intelligence · doi:10.24963/ijcai.2019/876 · Cited by 285
Bernacki, M. L., Nokes‐Malach, T. J., & Aleven, V. A. W. M. M. (2014) · Metacognition and Learning · doi:10.1007/s11409-014-9127-x · Cited by 201
Hägele, M., Seegerer, P., Lapuschkin, S., Bockmayr, M. L., Samek, W., Klauschen, F., Müller, K.-R., & Binder, A. (2020) · Scientific Reports · doi:10.1038/s41598-020-62724-2 · Cited by 186
Evaluating saliency map explanations for convolutional neural networks: a user study
Alqaraawi, A., Schuessler, M., Weiß, P., Costanza, E., & Berthouze, N. (2020) · Proceedings of the 25th International Conference on Intelligent User Interfaces · doi:10.1145/3377325.3377519 · Cited by 163
Imaging of Community-acquired Pneumonia
Franquet, T. (2018) · Journal of Thoracic Imaging · doi:10.1097/rti.0000000000000347 · Cited by 151
Ahsan, M. M., Gupta, K. D., Islam, M. M., Sen, S., Rahman, M. L., & Hossain, M. S. (2020) · Machine Learning and Knowledge Extraction · doi:10.3390/make2040027 · Cited by 146
Analyzing Neuroimaging Data Through Recurrent Deep Learning Models
Thomas, A. W., Heekeren, H. R., Müller, K., & Samek, W. (2019) · Frontiers in Neuroscience · doi:10.3389/fnins.2019.01321 · Cited by 102
Theoretical considerations and development of a questionnaire to measure trust in automation
Körber, M. (2018) · doi:10.31234/osf.io/nfc45 · Cited by 71
Unraveling ML Models of Emotion With NOVA: Multi-Level Explainable AI for Non-Experts
Heimerl, A., Weitz, K., Baur, T., & André, E. (2020) · IEEE Transactions on Affective Computing · doi:10.1109/taffc.2020.3043603 · Cited by 64
Self-citationWeitz, K., Hassan, T., Schmid, U., & Garbas, J.-U. (2019) · tm - Technisches Messen · doi:10.1515/teme-2019-0024 · Cited by 62
Self-citationExplainable Sentiment Analysis with Applications in Medicine
Zucco, C., Liang, H., Fatta, G. D., & Cannataro, M. (2018) · 2018 IEEE International Conference on Bioinformatics and Biomedicine (BIBM) · doi:10.1109/bibm.2018.8621359 · Cited by 59
Explaining Reinforcement Learning to Mere Mortals: An Empirical Study
Anderson, A. W., Dodge, J. E., Sadarangani, A., Juozapaitis, Z., Newman, E., Irvine, J., Chattopadhyay, S., Fern, A., & Burnett, M. (2019) · International Joint Conference on Artificial Intelligence · doi:10.24963/ijcai.2019/184 · Cited by 58
Local and global explanations of agent behavior: Integrating strategy summaries with saliency maps
Huber, T., Weitz, K., André, E., & Amir, O. (2021) · Artificial Intelligence · doi:10.1016/j.artint.2021.103571 · Cited by 53
Self-citationCounteRGAN: Generating Realistic Counterfactuals with Residual Generative Adversarial NetsPreprint
Nemirovsky, D., Thiébaut, N., Xu, Y., & Gupta, A. (2020) · arXiv (Cornell University) · doi:10.48550/arxiv.2009.05199 · Cited by 51
Interpretable machine learning
Molnar, C. (2020) · doi:10.58248/pn633 · Cited by 51
Deep Learning and Explainable AI in Healthcare Using EHR
Khedkar, S., Gandhi, P., Shinde, G., & Subramanian, V. (2019) · Studies in big data · doi:10.1007/978-3-030-33966-1_7 · Cited by 46
Ahsan, M. M., Gupta, K. D., Islam, M. M., et al. (2020) · arXiv (Cornell University) · doi:10.48550/arxiv.2007.12525 · Cited by 36
The role of emotion in self-explanations by cognitive agents
Kaptein, F., Broekens, J., Hindriks, K. V., & Neerincx, M. A. (2017) · International Conference on Affective Computing and Intelligent Interaction Workshops and Demos (ACIIW) · doi:10.1109/aciiw.2017.8272595 · Cited by 33
Effect of Superpixel Aggregation on Explanations in LIME – A Case Study with Biological Data
Schallner, L., Rabold, J., Scholz, O., & Schmid, U. (2020) · Communications in computer and information science · doi:10.1007/978-3-030-43823-4_13 · Cited by 31
Huber, T., Schiller, D., & André, E. (2019) · Lecture notes in computer science · doi:10.1007/978-3-030-30179-8_16 · Cited by 26
Self-citationBilateral Asymmetry Guided Counterfactual Generating Network for Mammogram Classification
Wang, C., Li, J., Zhang, F., Sun, X., Dong, H., Yu, Y., & Wang, Y. (2021) · IEEE Transactions on Image Processing · doi:10.1109/tip.2021.3112053 · Cited by 22
Fast Real-time Counterfactual ExplanationsPreprint
Zhao, Y. (2020) · arXiv (Cornell University) · doi:10.48550/arxiv.2007.05684 · Cited by 21
Counterfactual States for Atari Agents via Generative Deep LearningPreprint
Olson, M., Neal, L., Li, F., & Wong, W. (2019) · arXiv (Cornell University) · doi:10.48550/arxiv.1909.12969 · Cited by 19
Generating Natural Counterfactual Visual Explanations
Zhao, W., Oyama, S., & Kurihara, M. (2020) · International Joint Conference on Artificial Intelligence · doi:10.24963/ijcai.2020/742 · Cited by 10
Research works printed but not linked: 2
- Hall, 2018, Introduction to Machine Learning Interpretability
- Stone, 2016, Artificial Intelligence and Life in 2030. One Hundred Year Study on Artificial Intelligence: Report of the 2015-2016 Study Panel
Cited by
Sorted by citations
Lekadir, K., Frangi, A. F., Porras, A. R., Glocker, B., Cintas, C., Langlotz, C. P., Weicken, E., Asselbergs, F. W., Prior, F., Collins, G. S., et al. (2025) · BMJ · doi:10.1136/bmj-2024-081554 · Cited by 957
Muhammad, D., & Bendechache, M. (2024) · Computational and Structural Biotechnology Journal · doi:10.1016/j.csbj.2024.08.005 · Cited by 325
Counterfactual Explanations and Algorithmic Recourses for Machine Learning: A Review
Verma, S., Boonsanong, V., Hoang, M., Hines, K., Dickerson, J. P., & Shah, C. S. (2024) · ACM Computing Surveys · doi:10.1145/3677119 · Cited by 723
Counterfactual Explanations and Algorithmic Recourses for Machine Learning: A Review
Verma, S., Boonsanong, V., Hoang, M., Hines, K. E., Dickerson, J. P., & Shah, C. (2020) · arXiv · doi:10.48550/arxiv.2010.10596 · Cited by 267
What is Human-Centered about Human-Centered AI? A Map of the Research Landscape
Capel, T., & Brereton, M. (2023) · Proceedings of the 2023 CHI Conference on Human Factors in Computing Systems · doi:10.1145/3544548.3580959 · Cited by 228
Metadata
- Authors
- Mertes, S., Huber, T., Weitz, K., Heimerl, A., & André, E.
- Affiliations
- University of Augsburg (DE)
- Corresponding author
- Mertes, Silvan
- Venue
- Frontiers in Artificial Intelligence
- Publisher
- Frontiers Media SA
- Published
- 2022-04-08
- Volume
- 5
- Pages
- 825565-825565
- ISSN
- 2624-8212 (ISSN-L)
- PMC
- PMC9024220
- OpenAlex
- W3187709298
- Cited by
- 119
- References
- 53
- Citations by year
- 2026: 32 · 2025: 34 · 2024: 31 · 2023: 16 · 2022: 6
- FWCI
- 7.13
- Type
- journal article
- Language
- en
- Open access
- gold
- doi.org
- Licence
- Locations
- Frontiers in Artificial Intelligence (publishedVersion, cc-by)
- PubMed Central (publishedVersion, cc-by)
- PubMed (publishedVersion)
- arXiv (Cornell University) (submittedVersion)
- DOAJ (DOAJ: Directory of Open Access Journals) (submittedVersion)
- OPUS (Augsburg University) (submittedVersion, cc-by)
- arXiv (Cornell University)
- Funders
- Deutsche Forschungsgemeinschaft
- Bayerisches Staatsministerium für Wissenschaft, Forschung und Kunst
- Topics
- Physical Sciences › Computer Science › Artificial Intelligence › Explainable Artificial Intelligence (XAI)
- Health Sciences › Medicine › Health Informatics › Artificial Intelligence in Healthcare and Education
- Physical Sciences › Computer Science › Software › Software Testing and Debugging Techniques
- Keywords
- counterfactual explanations, generative adversarial networks, image-to-image translation, medical image classification, explainable AI, adversarial perturbation generation, non-expert users, user study, mental models, trust in AI, self-efficacy, saliency maps, lime, LRP
About these checks
Registry, retraction, Cites and statistics results are computed, not judged, with one exception: a printed reference that no index lists is read once by a model before it counts as a citation error. Claims are extracted by a model and kept only when their quote appears verbatim in the text; each cited source is then checked, with a model’s help, for whether it says what the claim relies on. Those verdicts can be wrong — read the claim’s quote and the cited source before relying on one.
Statistics and arithmetic are recomputed, not judged.
Confidence bands are shown only for fields calibrated on our annotated test set. None is calibrated yet, so no band is shown.
What counts as a claim ›How we measure confidence ›How we check this ›
Are you an author, or do you see a problem with this page? Request a review
