

Enhancing Deepfake Detection Through Quantum Transfer Learning and Class-Attention Vision Transformer Architecture
Open accessThe DOI matches its Crossref record; 39 of the 39 references it cites were found in a registry or an index; 13 of the 33 sources its claims cite were checked for support.
Abstract
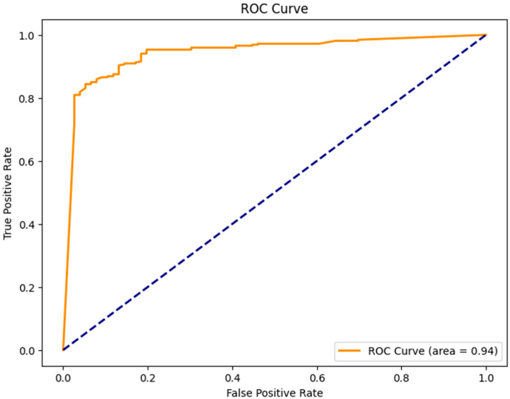
The widespread use of the internet, coupled with the increasing production of digital content, has caused significant challenges in information security and manipulation. Deepfake detection has become a critical research topic in both academic and practical domains, as it involves identifying forged elements in artificially generated videos using various deep learning and artificial intelligence techniques. In this dissertation, an innovative model was developed for detecting deepfake videos by combining the Quantum Transfer Learning (QTL) and Class-Attention Vision Transformer (CaiT) architectures. The Deepfake Detection Challenge (DFDC) dataset was used for training, and a system capable of detecting spatiotemporal inconsistencies was constructed by integrating QTL and CaiT technologies. In addition to existing preprocessing methods in the literature, a novel preprocessing function tailored to the requirements of deep learning models was developed for the dataset. The advantages of quantum computing offered by QTL were merged with the global feature extraction capabilities of the CaiT. The results demonstrated that the proposed method achieved a remarkable performance in detecting deepfake videos, with an accuracy of 90% and ROC AUC score of 0.94 achieved.
Overview
CoChat Summary
TL;DR
The paper proposes a deepfake detection model that combines Quantum Transfer Learning (QTL) with a Class-Attention Vision Transformer (CaiT) and evaluates it on DFDC-based data. It reports 90% accuracy and 0.94 ROC AUC, but notes weaker performance on real-class classification and limited validation on a simulated quantum device.
Key findings
- On the DFDC test set, the model achieved 90% accuracy and 0.94 ROC AUC.
- Class-level results in Table 2 show better performance on fake videos than real videos: fake precision/recall/F1 = 0.96/0.91/0.93 vs. real precision/recall/F1 = 0.69/0.83/0.75.
- Weighted-average metrics were precision 0.91, recall 0.90, and F1 0.90; macro-average F1 was 0.84.
- In a cross-dataset check on 10 real and 10 fake CelebDF-v2 videos, the model achieved 85% overall accuracy, macro-average F1 0.85, and AUC 0.97.
Methods
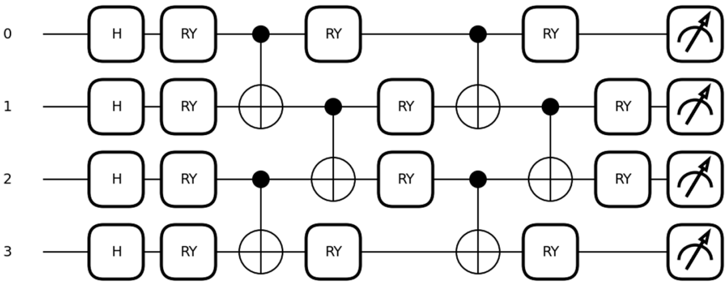
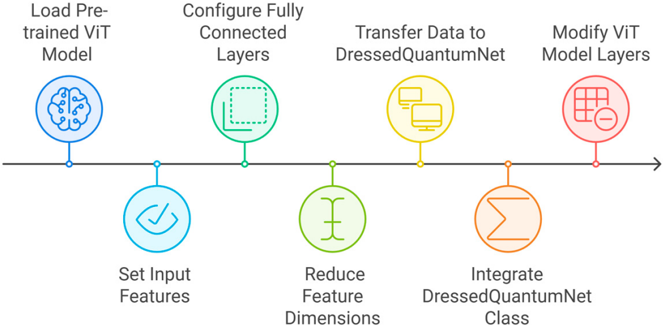
- The study built a hybrid deepfake detector using a pretrained CaiT (cait_s24_224) as the feature extractor and a Quantum Neural Network / DressedQuantumNet classifier layer with quantum gates (Hadamard, RY, CX).
- Data came from the DFDC dataset and the Deepfake and Real Images Dataset on Kaggle; the DFDC set was split into 50 parts and the paper says 25,000 videos were used for training because of session/time constraints.
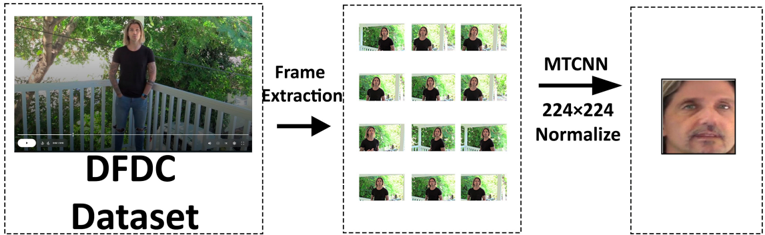
- Preprocessing included frame extraction, face detection with MTCNN, cropping, resizing to 224 × 224, and tensor conversion; training used Adam with cross-entropy loss and a learning rate of 3 × 10^-5.
Limitations
- The paper states the model was evaluated only in a simulated quantum environment, with no real quantum device testing.
- It says only 50% of the DFDC dataset was used because of hardware and time constraints; it also notes that Colab session limits made full-epoch training impractical.
- Evident from the reported results: performance is substantially weaker on the real class than on the fake class, suggesting class imbalance or class-specific optimization issues.
Model-written summary. Check it against the paper before relying on it.
Integrity signals
Registry
Cites
Statistics
Figures


Verification
Claims the paper makes
8 Valid · 5 Not valid · 18 Not checked · 68 Own results and interpretations
The cited sources that could be checked couldn’t confirm or dispute this claim.
In the paper
“Additionally, advanced detection techniques that address the dynamic and temporal structures of deepfake videos are still limited in number [16].”
§ Enhancing Deepfake Detection Through Quantum Transfer Learning and Class-Attention Vision Transformer Architecture > 1. Introduction
What the sources say
- Could not verifycites [16] Bhattacharyya, C., Wang, H., Zhang, F., Kim, S., and Zhu, X. (2024). Diffusion deepfake. arXiv. sourceExperimental — accuracy not yet measured
Our full-text copy (not truncated) surveys detection approaches in Sec. 2 Related Work, naming a handful of video/temporal-signal methods (eye blinking Li et al. [25], head poses [57], speaking-action patterns [4], combined physiological signals [9]), but nowhere states that such dynamic/temporal techniques are limited in number. The gaps the paper actually asserts (Abstract and Sec. 1 Introduction) are the absence of dedicated diffusion-based deepfake datasets/benchmarks and detectors' poor cross-domain/cross-manipulation generalization, not scarcity of temporal modelling. Searched for: 'temporal', 'dynamic structures', 'video-level temporal consistency', 'few/limited detection methods' — no passage addresses the claim's point, and none contradicts it. (LLM, conf=0.65)
plain- Asserted: passes — The authors put it forward as true.
- Checkable: passes — It can be checked against evidence.
- Load-bearing: passes — The paper’s conclusions depend on it.
- Based: passes — The paper gives a reason why it holds.
- Could not verify
The cited sources support only part of this claim — read each source’s verdict below.
In the paper
“Despite the effectiveness of deep learning-based models in forgery detection, their generalization capabilities have been observed to falter when faced with more complex and advanced deepfake technologies [14].”
§ Enhancing Deepfake Detection Through Quantum Transfer Learning and Class-Attention Vision Transformer Architecture > 1. Introduction
What the sources say
- Partly supportedcites [14] Li, B., Sun, J., and Poskitt, C.M. (2023). How generalizable are deepfake detectors? An empirical study. arXiv. sourceExperimental — accuracy not yet measured
The Abstract reports that deepfake image detectors struggle to generalize to datasets they were not trained on, and the Introduction says methods needing unseen samples remain behind novel generation approaches. The paper does not establish that greater complexity or sophistication specifically causes the loss of generalization; its finding concerns unseen datasets and synthesis methods. (LLM, conf=0.84)
plainstates a possible cause- Asserted: passes — The authors put it forward as true.
- Checkable: passes — It can be checked against evidence.
- Load-bearing: passes — The paper’s conclusions depend on it.
- Based: passes — The paper gives a reason why it holds.
- Partly supported
A result the paper reports from its own data — it cites no other source for it, so there is none to check. The quote shows it is in the paper.
In the paper
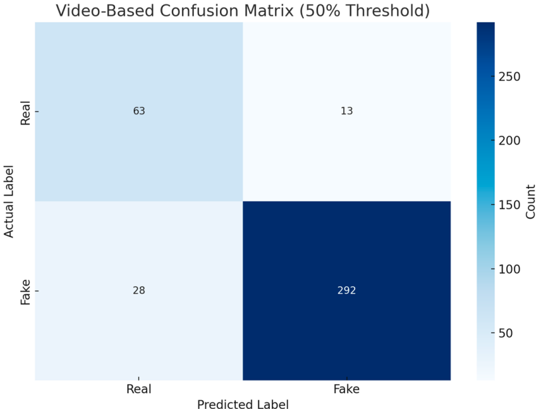
“For real videos, the number of correct classifications was 63, while the number of incorrect classifications was 13.”
§ Enhancing Deepfake Detection Through Quantum Transfer Learning and Class-Attention Vision Transformer Architecture > ROC AUC
plain- Asserted: passes — The authors put it forward as true.
- Checkable: passes — It can be checked against evidence.
- Load-bearing: passes — The paper’s conclusions depend on it.
- Based: passes — The paper gives a reason why it holds.
- Rests on an assumption not shown here.
A result the paper reports from its own data — it cites no other source for it, so there is none to check. The quote shows it is in the paper.
In the paper
“Similarly, for fake videos, the number of correct classifications was 292, and the number of incorrect classifications was 28.”
§ Enhancing Deepfake Detection Through Quantum Transfer Learning and Class-Attention Vision Transformer Architecture > ROC AUC
plain- Asserted: passes — The authors put it forward as true.
- Checkable: passes — It can be checked against evidence.
- Load-bearing: passes — The paper’s conclusions depend on it.
- Based: passes — The paper gives a reason why it holds.
- Rests on an assumption not shown here.
A result the paper reports from its own data — it cites no other source for it, so there is none to check. The quote shows it is in the paper.
In the paper
“The overall accuracy of the model was calculated as 90%.”
- Also stated in: § ROC AUC · plain
“The overall accuracy of the model was calculated as 90%.”
- Also stated in: § 4. Discussion · boosted
“With a 90% accuracy rate, the model demonstrated substantial performance improvements compared to other studies based on previous research.”
- Also stated in: § 5. Conclusions · plain
“Notably, the QTL-CaiT model achieves a high accuracy of 90% on the DFDC dataset, showcasing its competitive edge in performance.”
§ Enhancing Deepfake Detection Through Quantum Transfer Learning and Class-Attention Vision Transformer Architecture > ROC AUC
boosted- Asserted: passes — The authors put it forward as true.
- Checkable: passes — It can be checked against evidence.
- Load-bearing: passes — The paper’s conclusions depend on it.
- Based: passes — The paper gives a reason why it holds.
- Rests on an assumption not shown here.
- Also stated in: § ROC AUC · plain
23 more claims
Create a free account to see all 99 claims and to verify the 10 references still open.
- Probably not a substantial claim. 53
- It may state two separate claims as one. 28
- The quote only partly states this claim. 4
Self-check
Percentages, sums and reported differences re-computed from the paper’s own numbers.
Each contradiction between two passages listed here was confirmed by an independent check.
Rated major: it would touch a result — a value a result rests on, reported and recomputed p-values on opposite sides of the significance level, two passages that conflict with no sign which is right, or a cited work retracted before this paper was published.
In the paper
§ Enhancing Deepfake Detection Through Quantum Transfer Learning and Class-Attention Vision Transformer Architecture > 2.2. Dataset and Model Parameters
“Although the dataset contains approximately 100,000 videos, only 45,000 videos could be processed due to these time limitations.”
§ Enhancing Deepfake Detection Through Quantum Transfer Learning and Class-Attention Vision Transformer Architecture > 2.10. Training Process Tracking and Model Continuity
“The dataset used consists of the DFDC (Deepfake Detection Challenge) dataset divided into 50 different parts, containing a total of 124,000 videos.”
Rated major: it would touch a result — a value a result rests on, reported and recomputed p-values on opposite sides of the significance level, two passages that conflict with no sign which is right, or a cited work retracted before this paper was published.
In the paper
§ Enhancing Deepfake Detection Through Quantum Transfer Learning and Class-Attention Vision Transformer Architecture > 2.2. Dataset and Model Parameters
“The training process was conducted on the Google Colab platform, which, even in its premium version, restricts session durations to a maximum of 24 h.Although the dataset contains approximately 100,000 videos, only 45,000 videos could be processed due to these time limitations.”
§ Enhancing Deepfake Detection Through Quantum Transfer Learning and Class-Attention Vision Transformer Architecture > 2.10. Training Process Tracking and Model Continuity
“As a result of this limitation, the model was trained using a total of 25,000 videos.”
Citations
Cites
Vaswani, A., Shazeer, N., Parmar, N., Uszkoreit, J., Jones, L., Gomez, A. N., Kaiser, L., & Polosukhin, I. (2017) · arXiv · doi:10.48550/arxiv.1706.03762 · Cited by 120,404
Exploiting Generative AI to Scale up Intelligent Tutoring Systems
Jakubův, J., Chvalovský, K., Goertzel, Z., Kaliszyk, C., Olšák, M., Piotrowski, B., Schulz, S., Suda, M., & Urban, J. (2023) · DROPS (Schloss Dagstuhl – Leibniz Center for Informatics) · doi:10.4230/lipics.itp.2023.19 · Cited by 76,658
Quantum Computation and Quantum Information
Nielsen, M. A., Chuang, I., & Grover, L. K. (2002) · American Journal of Physics · doi:10.1119/1.1463744 · Cited by 21,895
Measuring the Accuracy of Diagnostic Systems
Swets, J. A. (1988) · Science · doi:10.1126/science.3287615 · Cited by 10,058
Joint Face Detection and Alignment Using Multitask Cascaded Convolutional Networks
Zhang, K., Zhang, Z., Li, Z., & Qiao, Y. (2016) · IEEE Signal Processing Letters · doi:10.1109/lsp.2016.2603342 · Cited by 6,214
Evaluation: from precision, recall and F-measure to ROC, informedness, markedness and correlation
Powers, D. M. W. (2020) · arXiv · doi:10.48550/arxiv.2010.16061 · Cited by 5,440
Error Detecting and Error Correcting Codes
Hamming, R. W. (1950) · Bell System Technical Journal · doi:10.1002/j.1538-7305.1950.tb00463.x · Cited by 5,377
An introduction to quantum machine learning
Schuld, M., Sinayskiy, I., & Petruccione, F. (2015) · Contemporary Physics · doi:10.1080/00107514.2014.964942 · Cited by 1,381 · cited 1×
“Tools such as Parametric Quantum Circuits (PQCs) address classical computational limitations, offering novel solutions for emerging AI challenges [5].”
Going deeper with Image Transformers
Touvron, H., Cord, M., Sablayrolles, A., Synnaeve, G., & Jegou, H. (2021) · 2021 IEEE/CVF International Conference on Computer Vision (ICCV) · doi:10.1109/iccv48922.2021.00010 · Cited by 1,259
Multi-attentional Deepfake Detection
Zhao, H., Wei, T., Zhou, W., Zhang, W., Chen, D., & Yu, N. (2021) · 2021 IEEE/CVF Conference on Computer Vision and Pattern Recognition (CVPR) · doi:10.1109/cvpr46437.2021.00222 · Cited by 1,019
Research works printed but not linked: 1
- Rijsbergen, 1979, Information retrieval; Butterworth, 1978, J. Libr., 11, 237
Cited by
Rajesh, T., & Maruthupermal, S. (2025) · Expert Systems with Applications · doi:10.1016/j.eswa.2025.129357 · Cited by 14
Hybrid Quantum–Classical Deep Neural Networks Based Smart Contract Vulnerability Detection
Durgut, S., Küçüksille, E. U., & Tokmak, M. (2025) · Applied Sciences · doi:10.3390/app15074037 · Cited by 8
Self-citationReliable Audio Deepfake Detection in Variable Conditions via Quantum-Kernel SVMs
Amin, L. A., & Janeja, V. P. (2025) · IEEE ... International Conference on Data Mining workshops · doi:10.1109/icdmw69685.2025.00166 · Cited by 4
“Evaluation uses stratified K-fold splits shared by both models, and reports deployment-relevant error metrics; margin-based quantities are used as diagnostics of within-kernel separability and stability across folds.”
Hybrid attention mechanism for deepfake faces detection
Kumar, D., Singh, P. K., & Ranjan, P. (2026) · Signal Image and Video Processing · doi:10.1007/s11760-026-05345-y
“Comparative analyses indicate a severe trade-off: trans-formers significantly underperform optimized CNNs at low giga-floating-point-operations per second (GFLOPS), limiting their viability for real-time mobile applications [25, 26].”
Abdulazeez, F. A., Hasan, M. K., & Abdullah, S. N. H. S. (2025) · doi:10.1109/iceei68459.2025.11330286
Metadata
- Authors
- Katı, B. E., Küçüksille, E. U., & Sarıman, G.
- Affiliations
- Süleyman Demirel Üniversitesi (TR)
- Muğla University (TR)
- Corresponding author
- Katı, Bekir Eray
- Venue
- Applied Sciences
- Publisher
- MDPI AG
- Published
- 2025-01-08
- Volume
- 15
- Issue
- 2
- Pages
- 525
- ISSN
- 2076-3417 (ISSN-L)
- OpenAlex
- W4406174629
- Cited by
- 12
- References
- 32
- Citations by year
- 2026: 6 · 2025: 6
- FWCI
- 4.19
- Type
- journal article
- Language
- en
- Open access
- gold
- doi.org
- Licence
- Locations
- Applied Sciences (publishedVersion, cc-by)
- DOAJ (DOAJ: Directory of Open Access Journals) (submittedVersion, cc-by-sa)
- Topics
- Physical Sciences › Computer Science › Computer Vision and Pattern Recognition › Digital Media Forensic Detection
- Physical Sciences › Computer Science › Computer Vision and Pattern Recognition › Generative Adversarial Networks and Image Synthesis
- Social Sciences › Sociology and Political Science › Misinformation and Its Impacts
- Keywords
- deepfake detection, quantum transfer learning, video forgery detection, data preprocessing, quantum computing
About these checks
Registry, retraction, Cites and statistics results are computed, not judged, with one exception: a printed reference that no index lists is read once by a model before it counts as a citation error. Claims are extracted by a model and kept only when their quote appears verbatim in the text; each cited source is then checked, with a model’s help, for whether it says what the claim relies on. Those verdicts can be wrong — read the claim’s quote and the cited source before relying on one.
The claim verdicts this report counts are experimental: their accuracy is not yet measured.
A language model drew the claims from the paper on 2026-10-10, under version 3 of the claim definition (model deepseek-v4.1-flash, prompt extract-v3).
A second model labelled each claim on 2026-10-10 (model jev-1.13-20260917, definition revision gold-guideline-v0.2).
Cited sources are checked with a language model’s help (qwen3.8-omni-flash and gpt-6-sol).
Statistics and arithmetic are recomputed, not judged.
Confidence bands are shown only for fields calibrated on our annotated test set. None is calibrated yet, so no band is shown.
What counts as a claim ›How we measure confidence ›How we check this ›
Are you an author, or do you see a problem with this page? Request a review
How to cite
Cite CoChat for the checks on this page, and the paper for its own findings.
- This page
- CoChat. (2026). Citation check: Enhancing Deepfake Detection Through Quantum Transfer Learning and Class-Attention Vision Transformer Architecture. https://app.cochat.ai/papers/10.3390/app15020525
- The paper
- Katı, B. E., Küçüksille, E. U., & Sarıman, G. (2025). Enhancing Deepfake Detection Through Quantum Transfer Learning and Class-Attention Vision Transformer Architecture. Applied Sciences. https://doi.org/10.3390/app15020525
Data sources
Bibliographic data: Semantic Scholar, OpenAlex, Crossref.
Contains information from the Semantic Scholar Academic Graph Datasets, made available under the ODC Attribution License (ODC-BY 1.0).
Semantic Scholar’s data is described in: Kinney, R., et al. (2023). The Semantic Scholar Open Data Platform. arXiv:2301.10140.
