

The DOI matches its Crossref record; 73 of the 73 references it cites were found in a registry or an index.
Comparative Transcriptome Analysis Reveals That Exendin-4 Improves Steatosis in HepG2 Cells by Modulating Signaling Pathways Related to Lipid Metabolism
Open accessAbstract
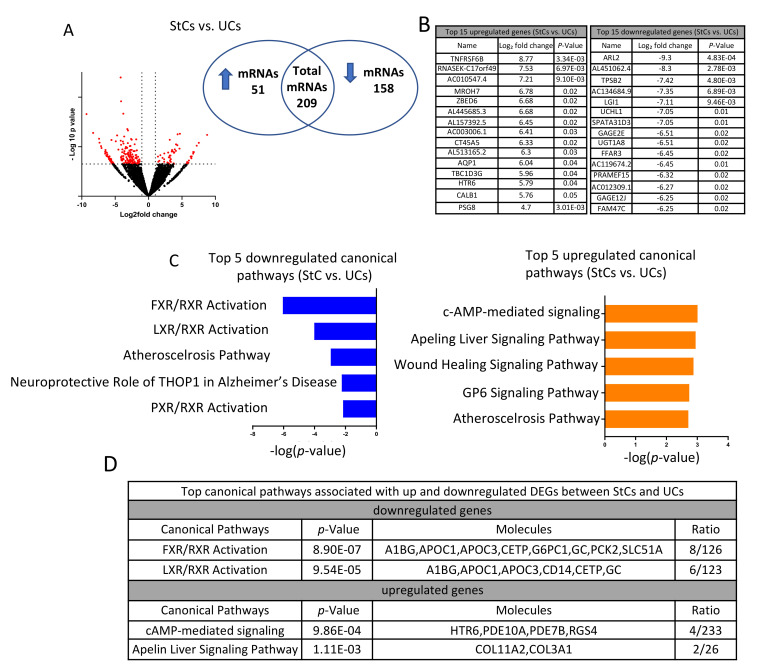
No therapy exists for non-alcoholic fatty liver disease (NAFLD). However, glucagon-like peptide receptor agonists (GLP-1RAs) showed a beneficial effect on NAFLD, although the underpinning mechanisms remain unclear due to their pleiotropic effects. We examined the implicated signaling pathways using comparative transcriptomics in a cell model of steatosis to overcome pleiotropy. We treated steatotic HepG2 cells with the GLP-1RA Exendin-4 (Ex-4). We compared the transcriptome profiles of untreated steatotic, and Ex-4-treated steatotic cells, and used Ingenuity Pathway Analysis (IPA) to identify the signaling pathways and associated genes involved in the protective effect of Ex-4. Ex-4 treatment significantly reduces steatosis. RNA-seq analysis revealed 209 differentially expressed genes (DEGs) between steatotic and untreated cells, with farnesoid X receptor/retinoid X receptor (FXR/RXR) (p = 8.9 × 10⁻⁷) activation being the top regulated canonical pathway identified by IPA. Furthermore, 1644 DEGs were identified between steatotic cells and Ex-4-treated cells, with liver X receptor/retinoid X receptor (LXR/RXR) (p = 2.02 × 10⁻⁷) and FXR/RXR (p = 3.28 × 10⁻⁷) activation being the two top canonical pathways. The top molecular and cellular functions between untreated and steatotic cells were lipid metabolism, molecular transport, and small molecular biochemistry, while organismal injury and abnormalities, endocrine system disorders, and gastrointestinal disease were the top three molecular and cellular functions between Ex-4-treated and steatotic cells. Genes overlapping steatotic cells and Ex-4-treated cells were associated with several lipid metabolism processes. Unique transcriptomic differences exist between steatotic cells and Ex-4-treated steatotic cells, providing an important resource for understanding the mechanisms that underpin the protective effect of GLP-1RAs on NAFLD and for the identification of novel therapeutic targets for NAFLD.
Overview
The claims and statistics of this paper haven’t been checked yet.
Free: it reads the open-access text and checks the first 5 claims that cite a source we can check. Create a free account to check every claim.
Integrity signals
Registry
Cites
Statistics
Figures



Verification
Claims the paper makes
The claims and statistics of this paper haven’t been checked yet.
Free: it reads the open-access text and checks the first 5 claims that cite a source we can check. Create a free account to check every claim.
Claims other papers make about this one
Each is checked against this paper’s own text: does it say what the citing paper says it does?
The source backs part of the claim, not all of it — or backs it for a different population, condition or comparison.
In the citing paper
“in steatosis via FXR, the activation of the liver X receptor/retinoid X receptor (LXR/RXR) pathway using GLP-1 RAs would account for the lower degree of liver inflammation [117].”
From GLP-1 Receptor Agonists in Non-Alcoholic Fatty Liver Disease: Current Evidence and Future Perspectives (2023) · cites this paper as [117]
Experimental — accuracy not yet measured
Self-check
Percentages, sums and reported differences re-computed from the paper’s own numbers.
The self-check needs the paper’s full text.
Citations
Cites
SREBPs: activators of the complete program of cholesterol and fatty acid synthesis in the liver
Horton, J. D., Goldstein, J. L., & Brown, M. S. (2002) · Journal of Clinical Investigation · doi:10.1172/jci15593 · Cited by 4,794
SREBPs: activators of the complete program of cholesterol and fatty acid synthesis in the liver
Horton, J. D., Goldstein, J. L., & Brown, M. S. (2002) · Journal of Clinical Investigation · doi:10.1172/jci0215593 · Cited by 4,092
Drucker, D. J., & Nauck, M. A. (2006) · The Lancet · doi:10.1016/s0140-6736(06)69705-5 · Cited by 3,896
Younossi, Z. M., Golabi, P., de Avila, L., Paik, J. M., Srishord, M., Fukui, N., Qiu, Y., Burns, L., Afendy, A., & Nader, F. (2019) · Journal of Hepatology · doi:10.1016/j.jhep.2019.06.021 · Cited by 2,235 · cited 1×
“NAFLD affects an estimated 24% of the world’s population [3]; NASH is one of the leading causes of hepatocellular carcinoma and liver transplantation [4].”
BackgroundA Placebo-controlled trial of subcutaneous semaglutide in nonalcoholic steatohepatitis
Newsome, P. N., Buchholtz, K., Cusi, K., Linder, M., Okanoue, T., Ratziu, V., Sanyal, A. J., Sejling, A.-S., & Harrison, S. A. (2021) · New England Journal of Medicine · doi:10.1056/nejmoa2028395 · Cited by 2,039
Molecular mechanisms of hepatic lipid accumulation in non-alcoholic fatty liver disease
Ipsen, D. H., Lykkesfeldt, J., & Tveden-Nyborg, P. (2018) · Cellular and Molecular Life Sciences · doi:10.1007/s00018-018-2860-6 · Cited by 1,471
Treatment of NAFLD with diet, physical activity and exercise
Romero-Gómez, M., Zelber-Sagi, S., & Trenell, M. (2017) · Journal of Hepatology · doi:10.1016/j.jhep.2017.05.016 · Cited by 1,347
Adams, L. A., Anstee, Q. M., Tilg, H., & Targher, G. (2017) · Gut · doi:10.1136/gutjnl-2017-313884 · Cited by 1,174
Liver X receptors as integrators of metabolic and inflammatory signaling
Zelcer, N. (2006) · Journal of Clinical Investigation · doi:10.1172/jci27883 · Cited by 978 · cited 1×
“that play an essential role in inflammatory control as well as in the regulation of fatty acid, cholesterol, and glucose metabolism [65].”
BackgroundNon alcoholic fatty liver disease and metabolic syndrome.
Paschos, P., & Paletas, K. (2009) · PubMed · Cited by 718
Cited by
Nevola, R., Epifani, R., Imbriani, S., Tortorella, G., Aprea, C., Galiero, R., Rinaldi, L., Marfella, R., & Sasso, F. C. (2023) · International Journal of Molecular Sciences · doi:10.3390/ijms24021703 · Cited by 286
Havranek, B., Loh, R., Torre, B., Redfield, R. L., & Halegoua-DeMarzio, D. L. (2025) · Scientific Reports · doi:10.1038/s41598-025-89408-z · Cited by 51
Effect of Isoquercitrin on Free Fatty Acid-Induced Lipid Accumulation in HepG2 Cells
Kim, S. H., Yun, C., Kwon, D., Lee, Y., Kwak, J., & Jung, Y. (2023) · Molecules · doi:10.3390/molecules28031476 · Cited by 26
GLP-1 receptor agonism: a transformative approach for managing type-2 diabetes and obesity
Alharbi, A. (2025) · Saudi Pharmaceutical Journal · doi:10.1007/s44446-025-00038-y · Cited by 33
Research Progress on the GIP/GLP-1 Receptor Coagonist Tirzepatide, a Rising Star in Type 2 Diabetes
Ma, Z., Jin, K., Yue, M., Chen, X., & Chen, J. (2023) · Journal of Diabetes Research · doi:10.1155/2023/5891532 · Cited by 29
Metadata
- Authors
- Errafii, K., Khalifa, O., Al-Akl, N. S., & Arredouani, A.
- Affiliations
- College of Health and Life Sciences, Hamad Bin Khalifa University, Qatar Foundation, Doha P.O. Box 34110, Qatar
- Hamad bin Khalifa University (QA)
- Corresponding author
- Arredouani, Abdelilah
- Venue
- Biomedicines
- Publisher
- MDPI AG
- Published
- 2022-04-28
- Volume
- 10
- Issue
- 5
- Pages
- 1020
- ISSN
- 2227-9059 (ISSN-L)
- PMC
- PMC9138370
- OpenAlex
- W4225115625
- Cited by
- 17
- References
- 73
- Citations by year
- 2026: 4 · 2025: 4 · 2024: 4 · 2023: 5
- FWCI
- 2.35
- Type
- journal article
- Language
- en
- Open access
- gold
- doi.org
- Licence
- Locations
- Biomedicines (publishedVersion, cc-by)
- PubMed Central (publishedVersion, cc-by)
- PubMed (publishedVersion)
- DOAJ (DOAJ: Directory of Open Access Journals) (submittedVersion, cc-by-sa)
- Figshare (submittedVersion, cc-by)
- Funders
- Qatar Biomedical Research Institute (VR93)
- Topics
- Health Sciences › Medicine › Hepatology › Liver Disease Diagnosis and Treatment
- Health Sciences › Medicine › Hepatology › Liver physiology and pathology
- Life Sciences › Pharmacology, Toxicology and Pharmaceutics › Pharmacology › Drug-Induced Hepatotoxicity and Protection
- Keywords
- exendin-4, non-alcoholic fatty liver disease, hepatic steatosis, GLP-1 receptor agonists, HepG2 cells, lipid metabolism, differentially expressed genes, transcriptome, therapeutic target
About these checks
Registry, retraction, Cites and statistics results are computed, not judged, with one exception: a printed reference that no index lists is read once by a model before it counts as a citation error. Claims are extracted by a model and kept only when their quote appears verbatim in the text; each cited source is then checked, with a model’s help, for whether it says what the claim relies on. Those verdicts can be wrong — read the claim’s quote and the cited source before relying on one.
Statistics and arithmetic are recomputed, not judged.
Confidence bands are shown only for fields calibrated on our annotated test set. None is calibrated yet, so no band is shown.
What counts as a claim ›How we measure confidence ›How we check this ›
Are you an author, or do you see a problem with this page? Request a review
How to cite
Cite CoChat for the checks on this page, and the paper for its own findings.
- This page
- CoChat. (2026). Citation check: Comparative Transcriptome Analysis Reveals That Exendin-4 Improves Steatosis in HepG2 Cells by Modulating Signaling Pathways Related to Lipid Metabolism. https://app.cochat.ai/papers/10.3390/biomedicines10051020
- The paper
- Errafii, K., Khalifa, O., Al-Akl, N. S., & Arredouani, A. (2022). Comparative Transcriptome Analysis Reveals That Exendin-4 Improves Steatosis in HepG2 Cells by Modulating Signaling Pathways Related to Lipid Metabolism. Biomedicines. https://doi.org/10.3390/biomedicines10051020
Data sources
Bibliographic data: Semantic Scholar, OpenAlex, Crossref.
Contains information from the Semantic Scholar Academic Graph Datasets, made available under the ODC Attribution License (ODC-BY 1.0).
Semantic Scholar’s data is described in: Kinney, R., et al. (2023). The Semantic Scholar Open Data Platform. arXiv:2301.10140.
