

The DOI matches its Crossref record; 77 of the 77 references it cites were found in a registry or an index.
Coordinated Interpersonal Behaviour in Collective Dance Improvisation: The Aesthetics of Kinaesthetic Togetherness
Open accessAbstract
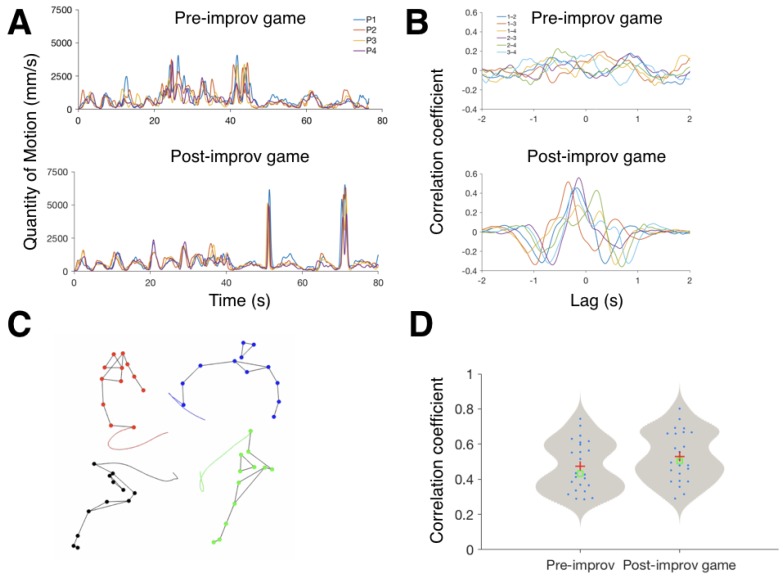
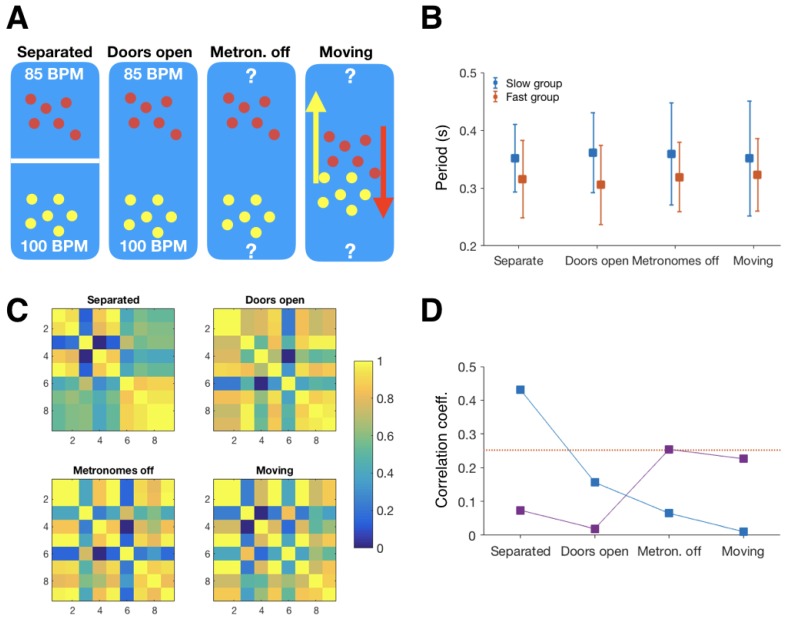
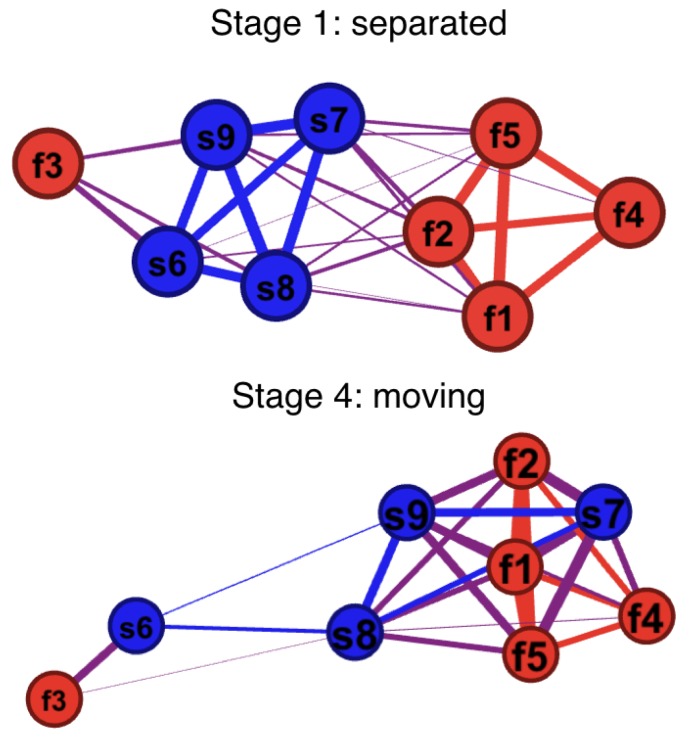
Collective dance improvisation (e.g., traditional and social dancing, contact improvisation) is a participatory, relational and embodied art form which eschews standard concepts in aesthetics. We present our ongoing research into the mechanisms underlying the lived experience of “togetherness” associated with such practices. Togetherness in collective dance improvisation is kinaesthetic (based on movement and its perception), and so can be simultaneously addressed from the perspective of the performers and the spectators, and be measured. We utilise these multiple levels of description: the first-person, phenomenological level of personal experiences, the third-person description of brain and body activity, and the level of interpersonal dynamics. Here, we describe two of our protocols: a four-person mirror game and a ‘rhythm battle’ dance improvisation score. Using an interpersonal closeness measure after the practice, we correlate subjective sense of individual/group connectedness and observed levels of in-group temporal synchronization. We propose that kinaesthetic togetherness, or interpersonal resonance, is integral to the aesthetic pleasure of the participants and spectators, and that embodied feeling of togetherness might play a role more generally in aesthetic experience in the performing arts.
Overview
The claims and statistics of this paper haven’t been checked yet.
Run the check — free, no account needed. It reads the open-access text and checks the sources it cites.
Integrity signals
Registry
Cites
Statistics
Figures
Verification
Claims the paper makes
The claims and statistics of this paper haven’t been checked yet.
Run the check — free, no account needed. It reads the open-access text and checks the sources it cites.
Claims other papers make about this one
Each is checked against this paper’s own text: does it say what the citing paper says it does?
The cited source says what the claim attributes to it.
In the citing paper
“These studies point out that interpersonal movement synchrony plays an important role in subjective experiences and aesthetic appreciation.”
From Heart Rate Variability Synchronizes When Non-experts Vocalize Together (2020) · cites this paper as Himberg et al., 2018
Self-check
Percentages, sums and reported differences re-computed from the paper’s own numbers.
The self-check needs the paper’s full text.
Citations
Cites
The Ecological Approach to Visual Perception: Classic Edition
Gibson, J. J. (2014) · doi:10.4324/9781315740218 · Cited by 12,132
The detection of disease clustering and a generalized regression approach.
Mantel, N. (1967) · PubMed · doi:10.1111/jbi.14281 · Cited by 11,504
(1999) · Cited by 7,995
Social psychology of intergroup relations
Tajfel, H. (1982) · Annual Review of Psychology · doi:10.1146/annurev.ps.33.020182.000245 · Cited by 7,949
The faculty of language: what is it, who has it, and how did it evolve?
Hauser, M. D., Chomsky, N., & Fitch, W. T. (2002) · Science · doi:10.1126/science.298.5598.1569 · Cited by 5,189
Inclusion of Other in the Self Scale and the structure of interpersonal closeness.
Aron, A., Aron, E. N., & Smollan, D. (1992) · Journal of Personality and Social Psychology · doi:10.1037/0022-3514.63.4.596 · Cited by 5,157
(1980) · Medical Entomology and Zoology · Cited by 4,712
Wiltermuth, S. S., & Heath, C. (2009) · Psychological Science · doi:10.1111/j.1467-9280.2008.02253.x · Cited by 1,717
Suits, B. (1978) · University of Toronto Press eBooks · doi:10.3138/9781487574338 · Cited by 1,560
(1996) · Journal of Consciousness Studies · Cited by 1,338
Research works printed but not linked: 5
- Novack, C.J. (1990). Sharing the Dance: Contact Improvisation and American Culture, University of Wisconsin Press.
- Kant, I., and Meredith, J.C. (2007). Critique of Judgement, Oxford University Press.
- Amighi, J.K. (1999). The Meaning of Movement: Developmental and Clinical Perspectives of the Kestenberg Movement Profile, Brunner-Routledge.
- 1994, The Mindreading System: New directions for research, Cah. Psychol. Cogn. Curr. Psychol. Cogn., 13, 724
- Maturana, H.R., and Varela, F.J. (1991). Autopoiesis and Cognition: The Realization of the Living, Springer Science & Business Media.
Cited by
Loving and knowing: reflections for an engaged epistemology
Jaegher, H. D. (2019) · Phenomenology and the Cognitive Sciences · doi:10.1007/s11097-019-09634-5 · Cited by 155
Agres, K., Schaefer, R., Volk, A., van Hooren, S., Holzapfel, A., Bella, S. D., Müller, M., de Witte, M., Herremans, D., Ramírez, R., et al. (2021) · Music & Science · doi:10.1177/2059204321997709 · Cited by 113
The sense of agency in joint action: An integrative review
Loehr, J. D. (2022) · Psychonomic Bulletin & Review · doi:10.3758/s13423-021-02051-3 · Cited by 87
Interactive expertise in solo and joint musical performance
Høffding, S., & Satne, G. (2019) · Synthese · doi:10.1007/s11229-019-02339-x · Cited by 71
How and why people synchronize: An integrated perspective
daSilva, E. B., & Wood, A. (2025) · Personality and Social Psychology Review · doi:10.1177/10888683241252036 · Cited by 56
Metadata
- Authors
- Himberg, T., Laroche, J., Bigé, R., Buchkowski, M., & Bachrach, A.
- Affiliations
- Université Paris 8 (FR)
- Université Paris Sciences et Lettres (FR)
- Centre National de la Recherche Scientifique (FR)
- Corresponding author
- Bachrach, Asaf
- Venue
- Behavioral Sciences
- Publisher
- MDPI AG
- Published
- 2018-02-09
- Volume
- 8
- Issue
- 2
- Pages
- 23
- ISSN
- 2076-328X (ISSN-L)
- PMC
- PMC5836006
- OpenAlex
- W2794439841
- Cited by
- 85
- References
- 77
- Citations by year
- 2026: 12 · 2025: 8 · 2024: 9 · 2023: 12 · 2022: 13 · 2021: 15 · 2020: 9 · 2019: 6 · 2018: 1
- FWCI
- 10.49
- Type
- journal article
- Language
- en
- Open access
- gold
- doi.org
- Licence
- Locations
- Behavioral Sciences (publishedVersion, cc-by)
- Europe PMC (PubMed Central) (publishedVersion, cc-by)
- PubMed Central (publishedVersion, cc-by)
- PubMed (publishedVersion)
- HAL (submittedVersion, other-oa)
- Aaltodoc (Aalto University) (submittedVersion, cc-by)
- DOAJ (DOAJ: Directory of Open Access Journals) (submittedVersion, cc-by-sa)
- Funders
- Agence Nationale de la Recherche (ANR-10-LABX-0080, ANR-10)
- Topics
- Social Sciences › Psychology › Social Psychology › Action Observation and Synchronization
- Social Sciences › Arts and Humanities › Visual Arts and Performing Arts › Diversity and Impact of Dance
- Life Sciences › Neuroscience › Cognitive Neuroscience › Aesthetic Perception and Analysis
- Keywords
- aesthetic experience, embodied experience, interpersonal synchrony, temporal synchronization, relationship closeness, mirror game, contact improvisation, social dance, phenomenology
About these checks
Registry, retraction, Cites and statistics results are computed, not judged, with one exception: a printed reference that no index lists is read once by a model before it counts as a citation error. Claims are extracted by a model and kept only when their quote appears verbatim in the text; each cited source is then checked, with a model’s help, for whether it says what the claim relies on. Those verdicts can be wrong — read the claim’s quote and the cited source before relying on one.
Statistics and arithmetic are recomputed, not judged.
Confidence bands are shown only for fields calibrated on our annotated test set. None is calibrated yet, so no band is shown.
What counts as a claim ›How we measure confidence ›How we check this ›
Are you an author, or do you see a problem with this page? Request a review
Data sources
Bibliographic data: Semantic Scholar, OpenAlex, Crossref.
Contains information from the Semantic Scholar Academic Graph Datasets, made available under the ODC Attribution License (ODC-BY 1.0).
Semantic Scholar’s data is described in: Kinney, R., et al. (2023). The Semantic Scholar Open Data Platform. arXiv:2301.10140.
