

The DOI matches its Crossref record; 6 of the 6 references it cites were found in a registry or an index.
Establishment and Characterization of hTERT Immortalized Hutchinson–Gilford Progeria Fibroblast Cell Lines
Abstract
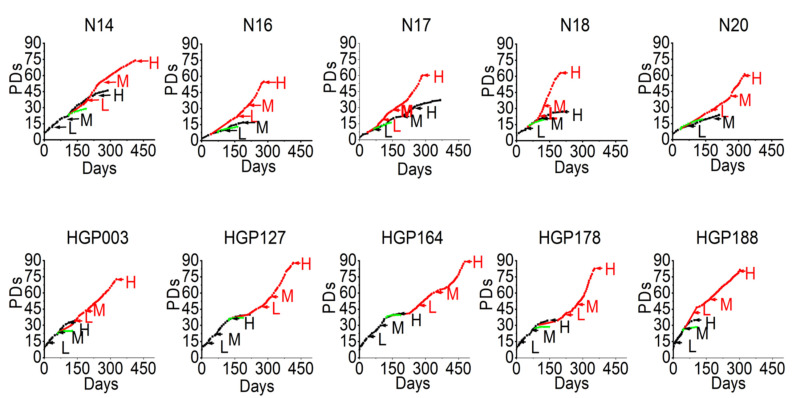
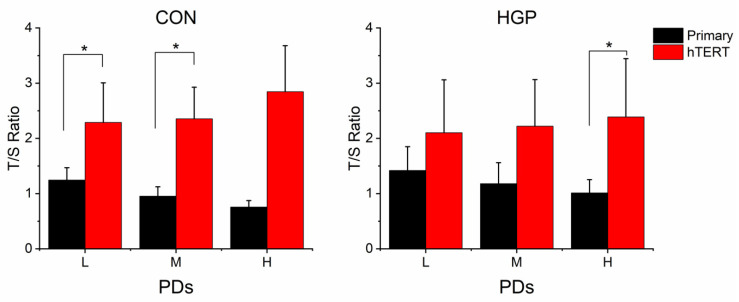
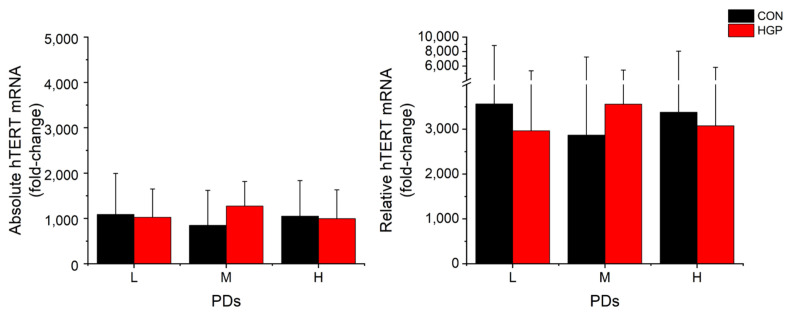
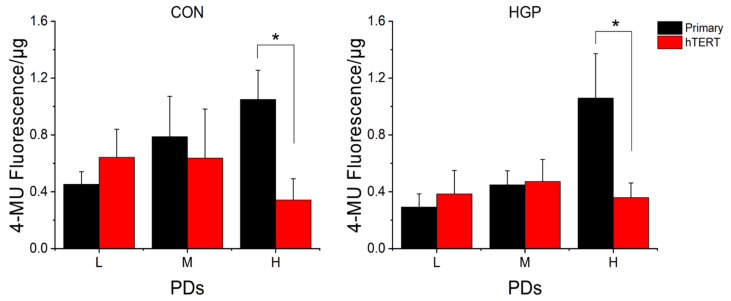
Hutchinson–Gilford progeria syndrome (HGPS) is a rare premature aging syndrome caused by a dominant mutation in the LMNA gene. Previous research has shown that the ectopic expression of the catalytic subunit of telomerase (hTERT) can elongate the telomeres of the patients’ fibroblasts. Here, we established five immortalized HGP fibroblast cell lines using retroviral infection with the catalytic subunit of hTERT. Immortalization enhanced the proliferative life span by at least 50 population doublings (PDs). The number of cells with typical senescence signs was reduced by 63 + 17%. Furthermore, the growth increase and phenotype improvement occurred with a lag phase of 50–100 days and was not dependent on the degree of telomere elongation. The initial telomeric stabilization after hTERT infection and relatively low amounts of hTERT mRNA were sufficient for the phenotype improvement but the retroviral infection procedure was associated with transient cell stress. Our data have implications for therapeutic strategies in HGP and other premature aging syndromes.
Overview
The claims and statistics of this paper haven’t been checked yet.
Run the check — free, no account needed. It reads the open-access text and checks the sources it cites.
Integrity signals
Registry
Cites
Statistics
Figures
Verification
Claims the paper makes
The claims and statistics of this paper haven’t been checked yet.
Run the check — free, no account needed. It reads the open-access text and checks the sources it cites.
Claims other papers make about this one
Each is checked against this paper’s own text: does it say what the citing paper says it does?
In the citing paper
“Human primary cells that have been immortalized by increasing hTERT expression in fibroblasts [122], choroidal melanocytes [31], endothelial cells [123], dermal keratinocytes, mammary epithelial cells, osteoblasts, and pancreatic cells [124].”
From Cell Immortality: In Vitro Effective Techniques to Achieve and Investigate Its Applications and Challenges (2024) · cites this paper as [122]
Self-check
Percentages, sums and reported differences re-computed from the paper’s own numbers.
The self-check needs the paper’s full text.
Citations
Cites
Blackburn, E. H., Epel, E. S., & Lin, J. (2015) · Science · doi:10.1126/science.aab3389 · Cited by 1,596 · cited 1×
“For example, hTERT binds to the end of telomeres and may thus stabilize the telomere structure and promote cell proliferation independently from telomere elongation [35].”
BackgroundHemann, M. T., Strong, M. A., Hao, L.-Y., & Greider, C. W. (2001) · Cell · doi:10.1016/s0092-8674(01)00504-9 · Cited by 1,219
Senescence Induced by Altered Telomere State, Not Telomere Loss
Karlseder, J., Smogorzewska, A., & de Lange, T. (2002) · Science · doi:10.1126/science.1069523 · Cited by 796
Genomic instability in laminopathy-based premature aging
Liu, B., Wang, J., Chan, K. M., Tjia, W. M., Deng, W., Guan, X., Huang, J.-D., Li, K. M., Chau, P. Y., Chen, D. J., et al. (2005) · Nature Medicine · doi:10.1038/nm1266 · Cited by 650
Extensive allelic variation and ultrashort telomeres in senescent human cells
Baird, D. M., Rowson, J., Wynford-Thomas, D., & Kipling, D. (2003) · Nature Genetics · doi:10.1038/ng1084 · Cited by 570
Quantitative assay of senescence-associated β-galactosidase activity in mammalian cell extracts
Gary, R. K., & Kindell, S. M. (2005) · Analytical Biochemistry · doi:10.1016/j.ab.2005.06.003 · Cited by 195
Research works printed but not linked: 39
- Merideth, 2008, Phenotype and Course of Hutchinson–Gilford Progeria Syndrome, N. Engl. J. Med., 358, 592, 10.1056/NEJMoa0706898 · DOI
- Gordon, 2014, Impact of Farnesylation Inhibitors on Survival in Hutchinson-Gilford Progeria Syndrome, Circulation, 130, 27, 10.1161/CIRCULATIONAHA.113.008285 · DOI
- Brown, 1992, Progeria: A human-disease model of accelerated aging, Am. J. Clin. Nutr., 55, 1222S, 10.1093/ajcn/55.6.1222S · DOI
- Ahmed, 2018, Hutchinson–Gilford Progeria Syndrome: A Premature Aging Disease, Mol. Neurobiol., 55, 4417
- Eriksson, 2003, Recurrent de novo point mutations in lamin A cause Hutchinson–Gilford progeria syndrome, Nature, 423, 293, 10.1038/nature01629 · DOI · Paper page
- Bernard, 2003, Lamin A Truncation in Hutchinson-Gilford Progeria, Science, 300, 2055, 10.1126/science.1084125 · DOI · Paper page
- Casey, 1996, Protein Prenyltransferases, J. Biol. Chem., 271, 5289, 10.1074/jbc.271.10.5289 · DOI
- Hennekes, 1994, The role of isoprenylation in membrane attachment of nuclear lamins. A single point mutation prevents proteolytic cleavage of the lamin A precursor and confers membrane binding properties, J. Cell Sci., 107, 1019, 10.1242/jcs.107.4.1019 · DOI
- Young, 2005, Prelamin A, Zmpste24, misshapen cell nuclei, and progeria--new evidence suggesting that protein farnesylation could be important for disease pathogenesis, J. Lipid Res., 46, 2531, 10.1194/jlr.R500011-JLR200 · DOI
- Cao, 2011, Progerin and telomere dysfunction collaborate to trigger cellular senescence in normal human fibroblasts, J. Clin. Investig., 121, 2833, 10.1172/JCI43578 · DOI · Paper page
- Dahl, 2006, Distinct structural and mechanical properties of the nuclear lamina in Hutchinson–Gilford progeria syndrome, Proc. Natl. Acad. Sci. USA, 103, 10271, 10.1073/pnas.0601058103 · DOI
- Moulson, 2007, Increased progerin expression associated with unusual LMNA mutations causes severe progeroid syndromes, Hum. Mutat., 28, 882, 10.1002/humu.20536 · DOI
- Reunert, 2012, Neonatal progeria: Increased ratio of progerin to lamin A leads to progeria of the newborn, Eur. J. Hum. Genet., 20, 933, 10.1038/ejhg.2012.36 · DOI
- Huang, 2008, Accelerated telomere shortening and replicative senescence in human fibroblasts overexpressing mutant and wild-type lamin A, Exp. Cell Res., 314, 82, 10.1016/j.yexcr.2007.08.004 · DOI
- Decker, 2009, Telomere length in Hutchinson-Gilford Progeria Syndrome, Mech. Ageing Dev., 130, 377, 10.1016/j.mad.2009.03.001 · DOI
- Ding, 2008, Model of human aging: Recent findings on Werner’s and Hutchinson-Gilford progeria syndromes, Clin. Interv. Aging, 3, 431, 10.2147/CIA.S1957 · DOI
- Blackburn, 2001, Switching and Signaling at the Telomere, Cell, 106, 661, 10.1016/S0092-8674(01)00492-5 · DOI
- Allsopp, 1992, Telomere length predicts replicative capacity of human fibroblasts, Proc. Natl. Acad. Sci. USA, 89, 10114, 10.1073/pnas.89.21.10114 · DOI · Paper page
- Bernadotte, 2016, Markers of cellular senescence. Telomere shortening as a marker of cellular senescence, Aging, 8, 3, 10.18632/aging.100871 · DOI · Paper page
- Blackburn, 1992, Telomerases, Annu. Rev. Biochem., 61, 13, 10.1146/annurev.bi.61.070192.000553 · DOI
- Li, 2017, Telomerase mRNA Reverses Senescence in Progeria Cells, J. Am. Coll. Cardiol., 70, 804, 10.1016/j.jacc.2017.06.017 · DOI
- Li, 2019, Transient introduction of human telomerase mRNA improves hallmarks of progeria cells, Aging Cell, 18, e12979, 10.1111/acel.12979 · DOI
- Benson, 2010, Role of progerin-induced telomere dysfunction in HGPS premature cellular senescence, J. Cell Sci., 123, 2605, 10.1242/jcs.067306 · DOI
- Kudlow, 2008, Suppression of Proliferative Defects Associated with Processing-defective Lamin A Mutants by hTERT or Inactivation of p53, Mol. Biol. Cell, 19, 5238, 10.1091/mbc.e08-05-0492 · DOI
- Cawthon, 2009, Telomere length measurement by a novel monochrome multiplex quantitative PCR method, Nucleic Acids Res., 37, e21, 10.1093/nar/gkn1027 · DOI
- Shay, 2005, Use of telomerase to create bioengineered tissues, Ann. N. Y. Acad. Sci., 1057, 479, 10.1196/annals.1356.037 · DOI
- Bodnar, 1998, Extension of Life-Span by Introduction of Telomerase into Normal Human Cells, Science, 279, 349, 10.1126/science.279.5349.349 · DOI · Paper page
- Kim, W., Ludlow, A.T., Min, J., Robin, J.D., Stadler, G., Mender, I., Lai, T.-P., Zhang, N., Wright, W.E., and Shay, J.W. (2016). Regulation of the Human Telomerase Gene TERT by Telomere Position Effect-Over Long Distances (TPE-OLD): Implications for Aging and Cancer. PLoS Biol., 14. · DOI
- Xie, 2016, Reversible Immortalization Enables Seamless Transdifferentiation of Primary Fibroblasts into Other Lineage Cells, Stem Cells Dev., 25, 1243, 10.1089/scd.2016.0035 · DOI
- Kannenberg, 2013, Characterization of Cholesterol Homeostasis in Telomerase-immortalized Tangier Disease Fibroblasts Reveals Marked Phenotype Variability, J. Biol. Chem., 288, 36936, 10.1074/jbc.M113.500256 · DOI
- Walter, 2004, The Establishment of Telomerase-immortalized Tangier Disease Cell Lines Indicates the Existence of an Apolipoprotein A-I-inducible but ABCA1-independent Cholesterol Efflux Pathway, J. Biol. Chem., 279, 20866, 10.1074/jbc.M401714200 · DOI
- Jäger, K., and Walter, M. (2016). Therapeutic Targeting of Telomerase. Genes, 7. · DOI
- Liu, 2006, DNA damage responses in progeroid syndromes arise from defective maturation of prelamin A, J. Cell Sci., 119, 4644, 10.1242/jcs.03263 · DOI · Paper page
- Osorio, 2013, Identification of mitochondrial dysfunction in Hutchinson–Gilford progeria syndrome through use of stable isotope labeling with amino acids in cell culture, J. Proteom., 91, 466, 10.1016/j.jprot.2013.08.008 · DOI
- Viteri, 2010, Effect of progerin on the accumulation of oxidized proteins in fibroblasts from Hutchinson Gilford progeria patients, Mech. Ageing Dev., 131, 2, 10.1016/j.mad.2009.11.006 · DOI
- Xiong, 2015, Methylene blue alleviates nuclear and mitochondrial abnormalities in progeria, Aging Cell, 15, 279, 10.1111/acel.12434 · DOI
- Santos, 2004, Mitochondrial hTERT exacerbates free-radical-mediated mtDNA damage, Aging Cell, 3, 399, 10.1111/j.1474-9728.2004.00124.x · DOI
- Ahmed, 2008, Telomerase does not counteract telomere shortening but protects mitochondrial function under oxidative stress, J. Cell Sci., 121, 1046, 10.1242/jcs.019372 · DOI
- Mensch, 2022, A conserved long-distance telomeric silencing mechanism suppresses mTOR signaling in aging human fibroblasts, Sci. Adv., 8, eabk2814, 10.1126/sciadv.abk2814 · DOI
Cited by
Chalak, M., Hesaraki, M., Mirbahari, S. N., Yeganeh, M., Abdi, S., Rajabi, S., & Hemmatzadeh, F. (2024) · Life · doi:10.3390/life14030417 · Cited by 66
Review of hTERT-Immortalized Cells: How to Assess Immortality and Confirm Identity
Shitova, M., Alpeeva, E., & Vorotelyak, E. (2024) · International Journal of Molecular Sciences · doi:10.3390/ijms252313054 · Cited by 22
Metadata
- Authors
- Lin, H., Mensch, J., Haschke, M., Jäger, K., Köttgen, B., Dernedde, J., Orsó, E., & Walter, M.
- Venue
- Cells
- Publisher
- MDPI AG
- Published
- 2022-09-06
- Volume
- 11
- Issue
- 18
- Pages
- 2784
- ISSN
- 2073-4409
- PMC
- PMC9497314
- Cited by
- 11
- References
- 6
- Language
- en
About these checks
Registry, retraction, Cites and statistics results are computed, not judged, with one exception: a printed reference that no index lists is read once by a model before it counts as a citation error. Claims are extracted by a model and kept only when their quote appears verbatim in the text; each cited source is then checked, with a model’s help, for whether it says what the claim relies on. Those verdicts can be wrong — read the claim’s quote and the cited source before relying on one.
Statistics and arithmetic are recomputed, not judged.
Confidence bands are shown only for fields calibrated on our annotated test set. None is calibrated yet, so no band is shown.
What counts as a claim ›How we measure confidence ›How we check this ›
Are you an author, or do you see a problem with this page? Request a review
How to cite
Cite CoChat for the checks on this page, and the paper for its own findings.
- This page
- CoChat. (2026). Citation check: Establishment and Characterization of hTERT Immortalized Hutchinson–Gilford Progeria Fibroblast Cell Lines. https://app.cochat.ai/papers/10.3390/cells11182784
- The paper
- Lin, H., Mensch, J., Haschke, M., Jäger, K., Köttgen, B., Dernedde, J., Orsó, E., & Walter, M. (2022). Establishment and Characterization of hTERT Immortalized Hutchinson–Gilford Progeria Fibroblast Cell Lines. Cells. https://doi.org/10.3390/cells11182784
