

The DOI matches its Crossref record; 81 of the 82 references it cites were found in a registry or an index.
Hosting Capacity of the Power Grid for Renewable Electricity Production and New Large Consumption Equipment
Open accessAbstract
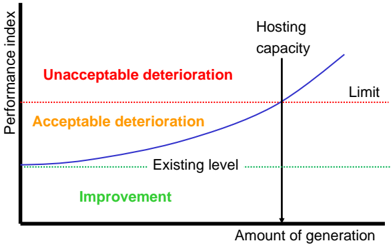
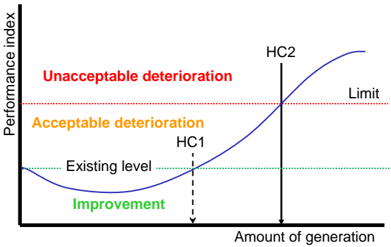
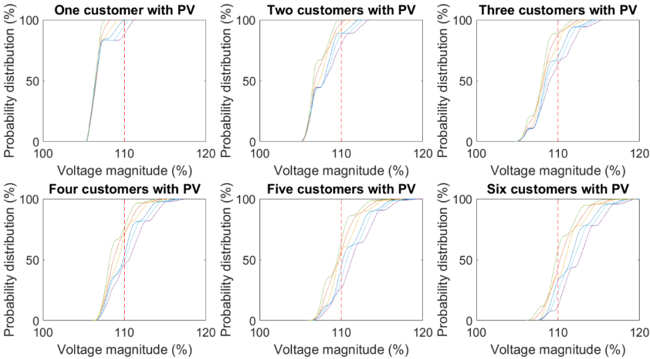
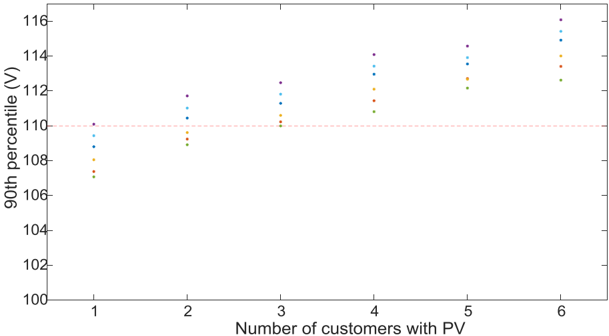
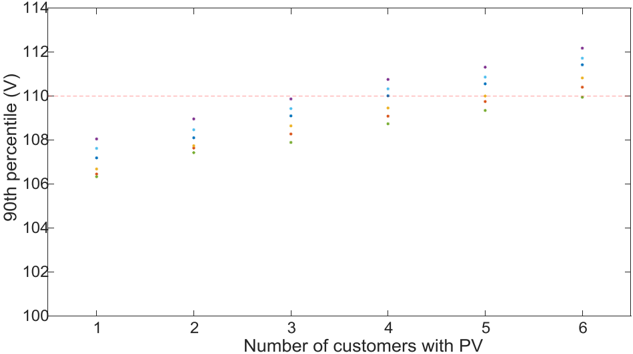
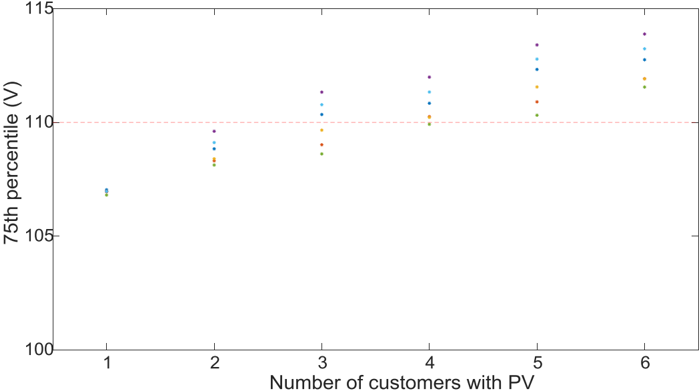
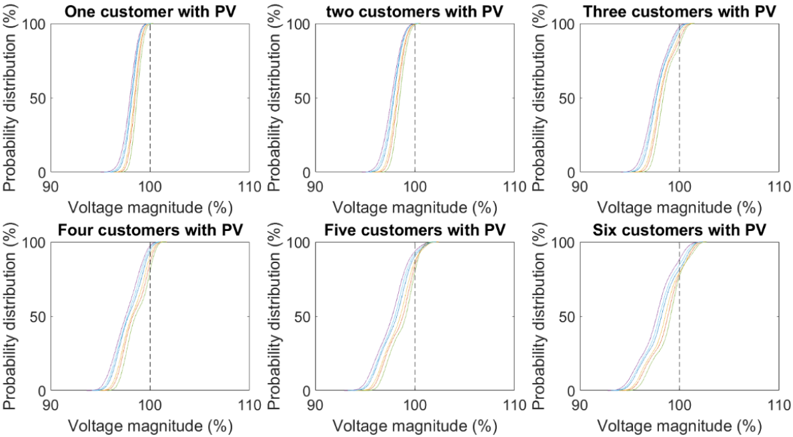
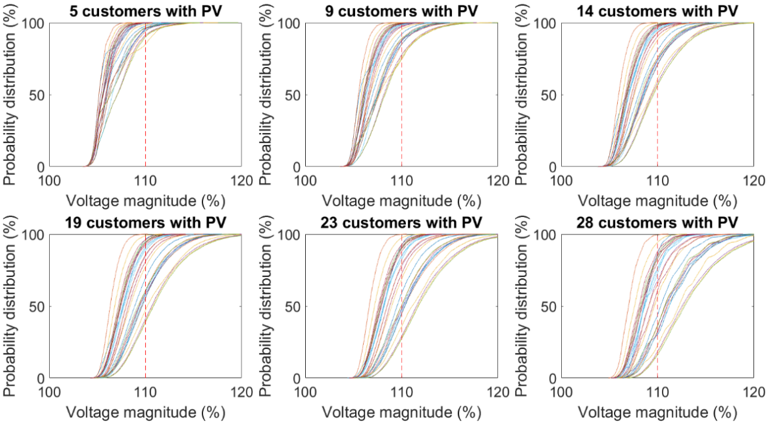
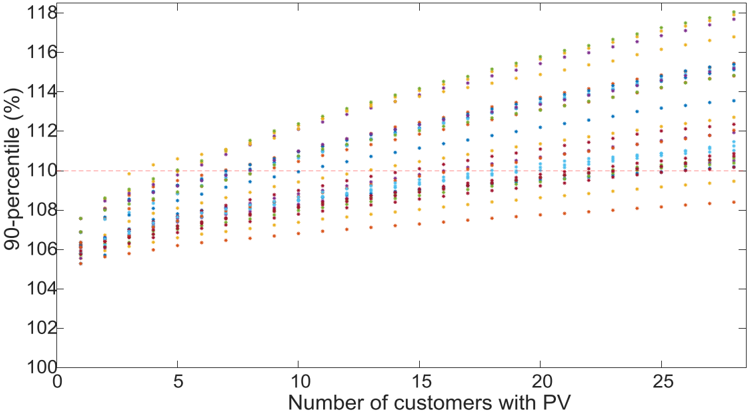
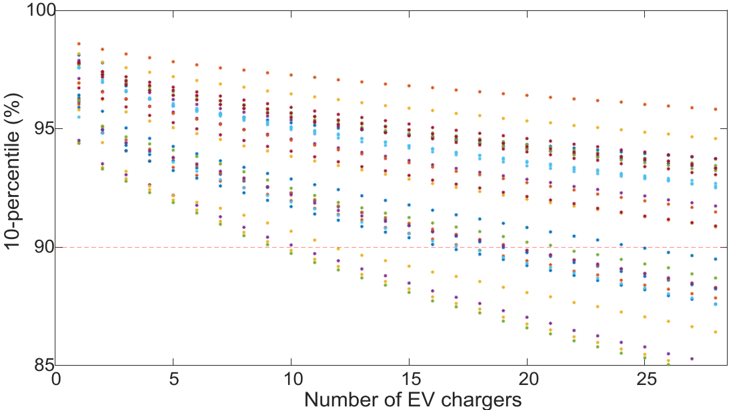
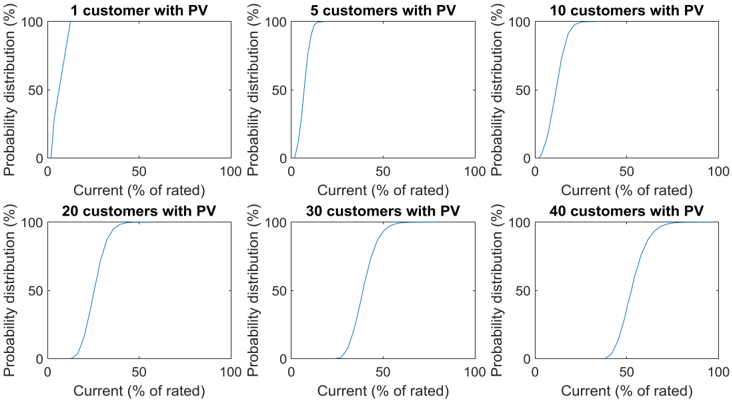
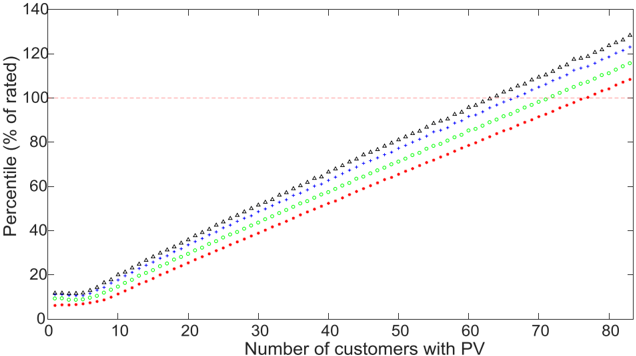
After a brief historical introduction to the hosting-capacity approach, the hosting capacity is presented in this paper as a tool for distribution-system planning under uncertainty. This tool is illustrated by evaluating the readiness of two low-voltage networks for increasing amounts of customers with PV panels or with EV chargers. Both undervoltage and overvoltage are considered in the studies presented here. Probability distribution functions are calculated for the worst-case overvoltage and undervoltage as a function of the number of customers with PV or EV chargers. These distributions are used to obtain 90th percentile values that act as a performance index. This index is compared with an overvoltage or undervoltage limit to get the hosting capacity. General aspects of the hosting-capacity calculations (performance indices, limits, and calculation methods) are discussed for a number of other phenomena: overcurrent; fast voltage magnitude variations; voltage unbalance; harmonics and supraharmonics. The need for gathering data and further development of models for existing demand is emphasised in the discussion and conclusions.
Overview
The claims and statistics of this paper haven’t been checked yet.
Run the check — free, no account needed. It reads the open-access text and checks the sources it cites.
Integrity signals
Registry
Cites
Statistics
Figures
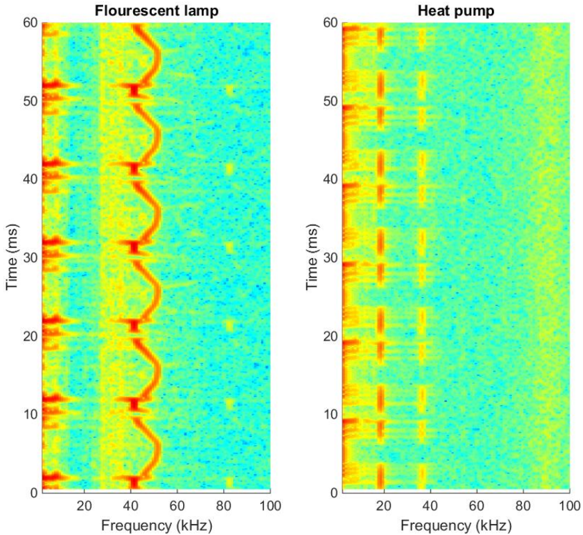
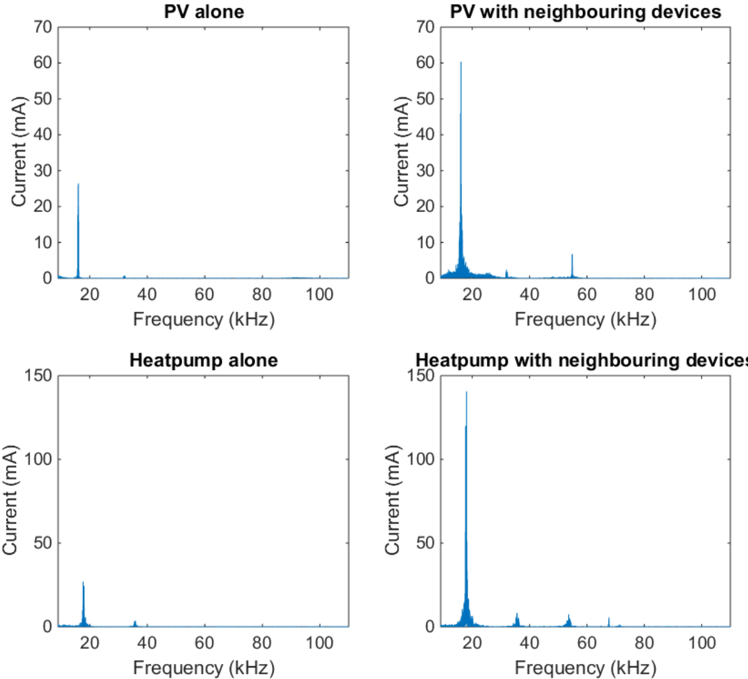
Verification
Claims the paper makes
The claims and statistics of this paper haven’t been checked yet.
Run the check — free, no account needed. It reads the open-access text and checks the sources it cites.
Claims other papers make about this one
Each is checked against this paper’s own text: does it say what the citing paper says it does?
The source backs part of the claim, not all of it — or backs it for a different population, condition or comparison.
In the citing paper
“A stochastic approach to determine the single-phase and three-phase EV charging HC considering both aleatory and epistemic uncertainties is developed in [2], while [15] applied a simplified MCS using limited input data to determine the EV charging HC.”
From Methods and Tools for PV and EV Hosting Capacity Determination in Low Voltage Distribution Networks—A Review (2023) · cites this paper as [15]
Experimental — accuracy not yet measured
Self-check
Percentages, sums and reported differences re-computed from the paper’s own numbers.
The self-check needs the paper’s full text.
Citations
Cites
Lopes, J. P., Hatziargyriou, N. D., Mutale, J., Djapić, P., & Jenkins, N. (2006) · Electric Power Systems Research · doi:10.1016/j.epsr.2006.08.016 · Cited by 1,413
Domestic electricity use: A high-resolution energy demand model
Richardson, I., Thomson, M., Infield, D. G., & Clifford, C. (2010) · Energy and Buildings · doi:10.1016/j.enbuild.2010.05.023 · Cited by 977
Advances in heat pump systems: a review
Chua, K. J., Chou, S. K., & Yang, W. M. (2010) · Applied Energy · doi:10.1016/j.apenergy.2010.06.014 · Cited by 966
Integration of Distributed Generation in the Power System
Bollen, M., & Hassan, F. (2011) · Wiley eBooks · doi:10.1002/9781118029039 · Cited by 767
Self-citationMicrogrids : architectures and control
Hatziargyriou, N. D. (2014) · CERN Document Server (European Organization for Nuclear Research) · Cited by 682
Voltage rise: the big issue when connecting embedded generation to long 11 kV overhead lines
Masters, C. L. (2002) · Power Engineering Journal · doi:10.1049/pe:20020101 · Cited by 653
Assessment of voltage unbalance
von Jouanne, A., & Banerjee, B. (2001) · IEEE Transactions on Power Delivery · doi:10.1109/61.956770 · Cited by 601
Assessment of Voltage Unbalance
von Jouanne, A., & Banerjee, B. (2001) · IEEE Power Engineering Review · doi:10.1109/mper.2001.4311581 · Cited by 495
Renewable energy in power systems
(2009) · Choice Reviews Online · doi:10.5860/choice.46-4469 · Cited by 457
Power System Harmonic Analysis
Arrillaga, J., Smith, B. C., Watson, N. R., & Wood, A. R. (1997) · Wiley eBooks · doi:10.1002/9781118878316 · Cited by 414
Research works printed but not linked: 7
- Dugan, R.C., McGranaghan, M.F., Santoso, S., and Beaty, H.W. (2012). Electric Power Systems Quality, McGraw-Hill.
- McGranaghan, M.F. (2017, January 18–22). Grid modernization challenges for the integrated grid. Proceedings of the IEEE PowerTech Manchester, Manchester, UK.
- Bahramirad, S. (2017, January 18–22). Design and planning of the grid of the future. Proceedings of the IEEE PowerTech Manchester, Manchester, UK.
- (2017, July 24). Distribution Test Feeders, IEEE PES Distribution System Analysis Subcommittee’s Distribution Test Feeder Working Group. Available online: https://ewh.ieee.org/soc/pes/dsacom/testfeeders/.
- Wiczynski, G. (October, January 28). Description of voltage fluctuations in LV power network with the use of PST indicator and voltage fluctuation indices. Proceedings of the 13th International Conference on Harmonics and Quality of Power (ICHQP), Wollongong, Australia.
- Ackermann, F., Moghadam, H., Meyer, J., Mueller, S., Domagk, M., Santjer, F., Athamna, I., and Klosse, R. (2016, January 14–15). Characterization of harmonic emission of individual wind turbines and pv inverters—Part II: Photovoltaic inverters. Proceedings of the 6th Solar Integration Workshop, Vienna, Austria.
- Meyer, J., Klatt, M., and Grevener, A. (2017, January 4–6). Supraharmonics—Future challenges in the frequency range 2–150 kHz, Keynote presentation. Proceedings of the International Conference on Renewable Energy and Power Quality (ICREPQ), Malaga, Spain.
Cited by
Sorted by citations
State-of-the-art of hosting capacity in modern power systems with distributed generation
Ismael, S. M., Abdel Aleem, S. H. E., Abdelaziz, A. Y., & Zobaa, A. F. (2019) · Renewable Energy · doi:10.1016/j.renene.2018.07.008 · Cited by 599
Mulenga, E., Bollen, M. H. J., & Etherden, N. (2020) · International Journal of Electrical Power & Energy Systems · doi:10.1016/j.ijepes.2019.105445 · Cited by 271
Self-citationFachrizal, R., Ramadhani, U. H., Munkhammar, J., & Widén, J. (2021) · Sustainable Energy, Grids and Networks · doi:10.1016/j.segan.2021.100445 · Cited by 173
Review on the PV Hosting Capacity in Distribution Networks
Fatima, S., Püvi, V., & Lehtonen, M. (2020) · Energies · doi:10.3390/en13184756 · Cited by 137
A unified index for power quality evaluation in distributed generation systems
Elbasuony, G. S., Aleem, S. H. E. A., Ibrahim, A. M., & Sharaf, A. M. (2018) · Energy · doi:10.1016/j.energy.2018.02.088 · Cited by 123
Metadata
- Authors
- Bollen, M., & Rönnberg, S.
- Affiliations
- Luleå University of Technology (SE)
- Corresponding author
- Bollen, Math
- Rönnberg, Sarah
- Venue
- Energies
- Publisher
- MDPI AG
- Published
- 2017-09-02
- Volume
- 10
- Issue
- 9
- Pages
- 1325
- ISSN
- 1996-1073 (ISSN-L)
- OpenAlex
- W2752735451
- Cited by
- 169
- References
- 82
- Citations by year
- 2026: 10 · 2025: 14 · 2024: 17 · 2023: 32 · 2022: 23 · 2021: 19 · 2020: 23 · 2019: 19 · 2018: 12
- FWCI
- 6.14
- Type
- journal article
- Language
- en
- Open access
- gold
- doi.org
- Licence
- Locations
- Energies (publishedVersion, cc-by)
- RePEc: Research Papers in Economics (submittedVersion)
- DOAJ (DOAJ: Directory of Open Access Journals) (submittedVersion, cc-by-sa)
- Funders
- Energiforsk
- Skellefteå Kraft Elnät
- Umeå Energi
- Topics
- Physical Sciences › Engineering › Electrical and Electronic Engineering › Optimal Power Flow Distribution
- Physical Sciences › Engineering › Electrical and Electronic Engineering › Smart Grid Energy Management
- Physical Sciences › Engineering › Electrical and Electronic Engineering › Electric Power System Optimization
- Keywords
- hosting capacity, distribution network planning, uncertainty, photovoltaic generation, electric vehicle charging stations, low-voltage distribution networks, undervoltage, overvoltage, performance index, overcurrent, voltage unbalance, harmonics, supraharmonics
About these checks
Registry, retraction, Cites and statistics results are computed, not judged, with one exception: a printed reference that no index lists is read once by a model before it counts as a citation error. Claims are extracted by a model and kept only when their quote appears verbatim in the text; each cited source is then checked, with a model’s help, for whether it says what the claim relies on. Those verdicts can be wrong — read the claim’s quote and the cited source before relying on one.
Statistics and arithmetic are recomputed, not judged.
Confidence bands are shown only for fields calibrated on our annotated test set. None is calibrated yet, so no band is shown.
What counts as a claim ›How we measure confidence ›How we check this ›
Are you an author, or do you see a problem with this page? Request a review
