

Using Artificial Intelligence to Predict Wind Speed for Energy Application in Saudi Arabia
Open accessThe DOI matches its Crossref record; 53 of the 54 references it cites were found in a registry or an index.
Abstract
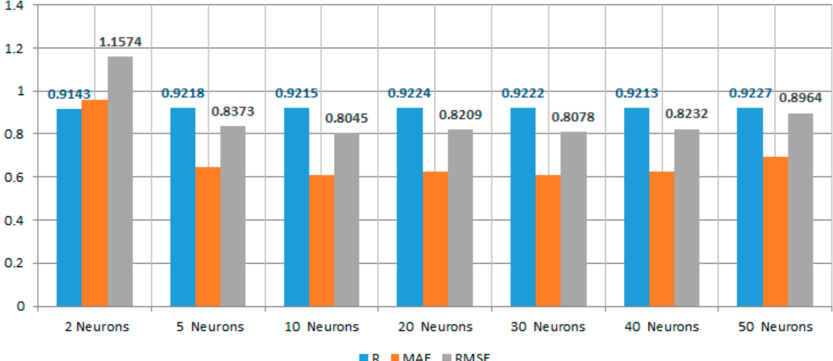
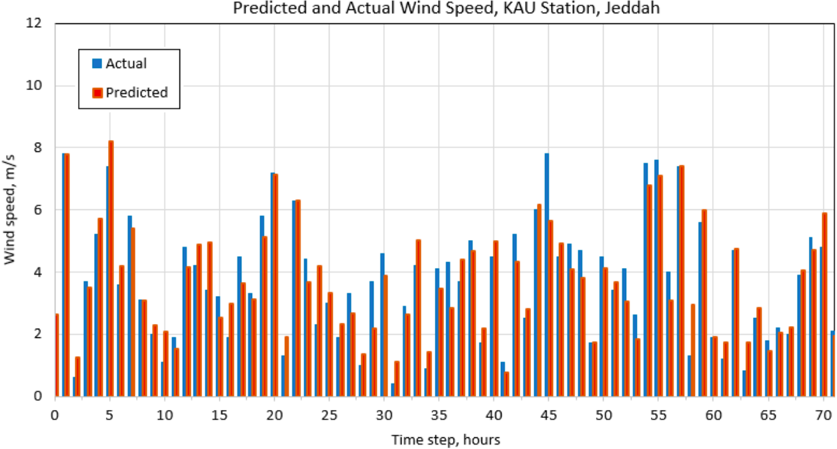
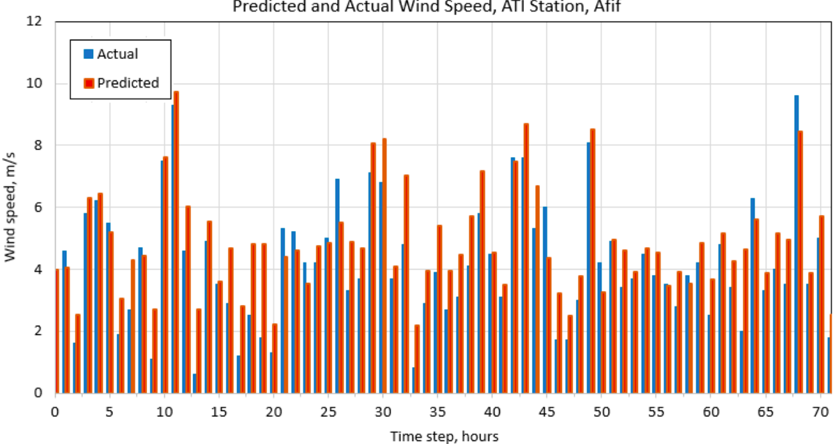
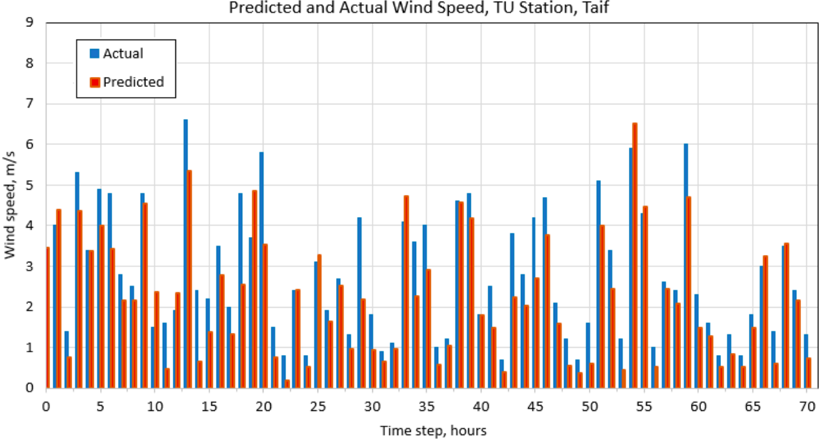
Predicting wind speed for wind energy conversion systems (WECS) is an essential monitor, control, plan, and dispatch generated power and meets customer needs. The Kingdom of Saudi Arabia recently set ambitious targets in its national transformation program and Vision 2030 to move away from oil dependence and redirect oil and gas exploration efforts to other higher-value uses, chiefly meeting 10% of its energy demand through renewable energy sources. In this paper, we propose the use of the artificial neural networks (ANNs) method as a means of predicting daily wind speed in a number of locations in the Kingdom of Saudi Arabia based on multiple local meteorological measurement data provided by K.A.CARE. The suggested model is a feed-forward neural network model with the administered learning technique using a back-propagation algorithm. Results indicate that the best structure is obtained with thirty neurons in the hidden layers matching a minimum root mean square error (RMSE) and the highest correlation coefficient (R). A comparison between predicted and actual data from meteorological stations showed good agreement. A comparison between five machine learning algorithms, namely ANN, support vector machines (SVM), random tree, random forest, and RepTree revealed that random tree has low correlation and relatively high root mean square error. The significance of the present study relies on its ability to predict wind speeds, a necessary prerequisite to executing sustainable integration of wind power into Saudi Arabia’s electrical grid, assisting operators in efficiently managing generated power, and helping achieve the energy efficiency and production targets of Vision 2030.
Overview
The claims and statistics of this paper haven’t been checked yet.
Free: it reads the open-access text and checks the first 5 claims that cite a source we can check. Create a free account to check every claim.
Integrity signals
Registry
Cites
Statistics
Figures



Verification
Claims the paper makes
The claims and statistics of this paper haven’t been checked yet.
Free: it reads the open-access text and checks the first 5 claims that cite a source we can check. Create a free account to check every claim.
Claims other papers make about this one
Each is checked against this paper’s own text: does it say what the citing paper says it does?
The check wasn’t confident either way, so it gives no verdict — never disputed.
In the citing paper
“Accordingly, the current trends divulge that by 2030, road traffic injuries are predicted to be the seventh leading cause of death across all age groups in Saudi Arabia if no adequate preventive measures are effectuated [2].”
From A Real-Time Computer Vision Based Approach to Detection and Classification of Traffic Incidents (2023) · cites this paper as [2]
Experimental — accuracy not yet measured
Self-check
Percentages, sums and reported differences re-computed from the paper’s own numbers.
The self-check needs the paper’s full text.
Citations
Cites
Review on Methods to Fix Number of Hidden Neurons in Neural Networks
Sheela, K. G., & Deepa, S. N. (2013) · Mathematical Problems in Engineering · doi:10.1155/2013/425740 · Cited by 941
A review on the young history of the wind power short-term prediction
Costa, A., Crespo, A., Navarro, J., Lizcano, G., Madsen, H., & Feitosa, E. (2008) · Renewable and Sustainable Energy Reviews · doi:10.1016/j.rser.2007.01.015 · Cited by 638 · cited 1×
“[52] suggested further study on complex terrain and research on adaptive parameter estimation.”
BackgroundRepeated wavelet transform based ARIMA model for very short-term wind speed forecasting
Aasim, Singh, S. N., & Mohapatra, A. (2019) · Renewable Energy · doi:10.1016/j.renene.2019.01.031 · Cited by 617
State of the Art of Machine Learning Models in Energy Systems, a Systematic Review
Mosavi, A., Salimi, M., Faizollahzadeh Ardabili, S., Rabczuk, T., Shamshirband, S., & Varkonyi-Koczy, A. R. (2019) · Energies · doi:10.3390/en12071301 · Cited by 578
A survey of artificial neural network in wind energy systems
Marugán, A. P., Márquez, F. P. G., Perez, J. M. P., & Ruiz-Hernández, D. (2018) · Applied Energy · doi:10.1016/j.apenergy.2018.07.084 · Cited by 479 · cited 1×
“[51] demonstrated that artificial neural networks could be an alternative to conventional methods in many cases.”
MethodErnst, B., Oakleaf, B., Ahlstrom, M., Lange, M., Moehrlen, C., Lange, B., Focken, U., & Rohrig, K. (2007) · IEEE Power and Energy Magazine · doi:10.1109/mpe.2007.906306 · Cited by 441
Machine Learning: An Algorithmic Perspective
Marsland, S. (2014) · Chapman & Hall/CRC eBooks · doi:10.1201/b17476 · Cited by 353
Review of the use of Numerical Weather Prediction (NWP) Models for wind energy assessment
Al-Yahyai, S., Charabi, Y., & Gastli, A. (2010) · Renewable and Sustainable Energy Reviews · doi:10.1016/j.rser.2010.07.001 · Cited by 347
A Literature Review of Wind Forecasting Methods
Chang, W.-Y. (2014) · Journal of Power and Energy Engineering · doi:10.4236/jpee.2014.24023 · Cited by 302 · cited 1×
“The main objective is to take advantage of each method and increase the accuracy of the wind speed forecast [17,40].”
MethodKhosravi, A., Koury, R. N. N., Machado, L., & Pabon, J. J. G. (2018) · Sustainable Energy Technologies and Assessments · doi:10.1016/j.seta.2018.01.001 · Cited by 279 · cited 1×
“Among the most popular models used in forecasting wind speed based on artificial intelligence we found ANN models [18,42], support vector machines (SVM) [43,44], fuzzy logic [45], and the adaptive neuro-fuzzy inference framework (ANFIS) approach [46,47].”
Method
Research works printed but not linked: 4
- Geoffron, P., Greening, L.A., and Heffron, R. (2019). Energy Policy-Making in a Cross-National Comparison: Energy Resources, Policy Processes and Law, Springer.
- MEIM, Ministry of Energy, Industry and Mineral Resources (MEIM) (2019, October 10). Embarking on Round Two of Saudi Arabia’s National Renewable Energy Program, Available online: https://www.powersaudiarabia.com.sa/web/attach/news/Press-Release-080719-REPDO-Round2RFQ-EN.pdf.
- Giebel, G., and Kariniotakis, G. (2019, September 29). Best Practice in the Use of Short-Term Forecasting. A Users Guide. Available online: https://www.researchgate.net/publication/47398578_Best_Practice_in_short-term_Forecasting_A_users_Guide.
- Manwell, J.F., McGowan, J.G., and Rogers, A.L. (2011). Wind Energy Explained: Theory, Design and Application, John Wiley & Sons, Ltd.
Cited by
A Real-Time Computer Vision Based Approach to Detection and Classification of Traffic Incidents
Basheer Ahmed, M. I., Zaghdoud, R., Ahmed, M. S., Sendi, R., Alsharif, S., Alabdulkarim, J., Albin Saad, B. A., Alsabt, R., Rahman, A., & Krishnasamy, G. (2023) · Big Data and Cognitive Computing · doi:10.3390/bdcc7010022 · Cited by 122
Smart grid infrastructure and renewable energy deployment: A conceptual review of Saudi Arabia
Khan, K. A., Quamar, M. M., Al-Qahtani, F. H., Asif, M., Alqahtani, M. F., & Khalid, M. (2023) · Energy Strategy Reviews · doi:10.1016/j.esr.2023.101247 · Cited by 128
A Review on ANN Based Model for Solar Radiation and Wind Speed Prediction with Real-Time Data
Malik, P., Gehlot, A., Singh, R., Gupta, L. R., & Thakur, A. K. (2022) · Archives of Computational Methods in Engineering · doi:10.1007/s11831-021-09687-3 · Cited by 81
A review on short‐term load forecasting models for micro‐grid application
Kondaiah, V. Y., Saravanan, B., Padmanaban, S., & Khan, B. (2022) · The Journal of Engineering · doi:10.1049/tje2.12151 · Cited by 76
Noman, A. A., Tasneem, Z., Sahed, M. F., Muyeen, S. M., Das, S. K., & Alam, F. (2022) · Renewable and Sustainable Energy Reviews · doi:10.1016/j.rser.2022.112531 · Cited by 67
Metadata
- Authors
- Brahimi, T.
- Affiliations
- Effat University (SA)
- Corresponding author
- Brahimi, Tayeb
- ORCID
- Brahimi, Tayeb
- Venue
- Energies
- Publisher
- MDPI AG
- Published
- 2019-12-09
- Volume
- 12
- Issue
- 24
- Pages
- 4669
- ISSN
- 1996-1073 (ISSN-L)
- OpenAlex
- W2993384776
- Cited by
- 74
- References
- 54
- Citations by year
- 2026: 4 · 2025: 10 · 2024: 8 · 2023: 14 · 2022: 23 · 2021: 14 · 2020: 1
- FWCI
- 3.42
- Type
- journal article
- Language
- en
- Open access
- gold
- doi.org
- Licence
- Locations
- Energies (publishedVersion, cc-by)
- RePEc: Research Papers in Economics (submittedVersion)
- Funders
- Effat University
- Topics
- Physical Sciences › Engineering › Electrical and Electronic Engineering › Energy Load and Power Forecasting
- Physical Sciences › Energy › Renewable Energy, Sustainability and the Environment › Solar Radiation and Photovoltaics
- Physical Sciences › Energy › Renewable Energy, Sustainability and the Environment › Wind Energy Research and Development
- Keywords
- wind speed forecasting, artificial neural networks, feedforward neural networks, backpropagation, wind energy conversion system, renewable energy integration, Saudi Arabia, Saudi Vision 2030, meteorological observations, random forest, support vector machine, REPTree, random trees
About these checks
Registry, retraction, Cites and statistics results are computed, not judged, with one exception: a printed reference that no index lists is read once by a model before it counts as a citation error. Claims are extracted by a model and kept only when their quote appears verbatim in the text; each cited source is then checked, with a model’s help, for whether it says what the claim relies on. Those verdicts can be wrong — read the claim’s quote and the cited source before relying on one.
Statistics and arithmetic are recomputed, not judged.
Confidence bands are shown only for fields calibrated on our annotated test set. None is calibrated yet, so no band is shown.
What counts as a claim ›How we measure confidence ›How we check this ›
Are you an author, or do you see a problem with this page? Request a review
How to cite
Cite CoChat for the checks on this page, and the paper for its own findings.
- This page
- CoChat. (2026). Citation check: Using Artificial Intelligence to Predict Wind Speed for Energy Application in Saudi Arabia. https://app.cochat.ai/papers/10.3390/en12244669
- The paper
- Brahimi, T. (2019). Using Artificial Intelligence to Predict Wind Speed for Energy Application in Saudi Arabia. Energies. https://doi.org/10.3390/en12244669
Data sources
Bibliographic data: Semantic Scholar, OpenAlex, Crossref.
Contains information from the Semantic Scholar Academic Graph Datasets, made available under the ODC Attribution License (ODC-BY 1.0).
Semantic Scholar’s data is described in: Kinney, R., et al. (2023). The Semantic Scholar Open Data Platform. arXiv:2301.10140.
