

The DOI matches its Crossref record; 79 of the 79 references it cites were found in a registry or an index.
Variable Response in Alpine Tree-Ring Stable Isotopes Following Volcanic Eruptions in the Tropics and Iceland
Open accessAbstract
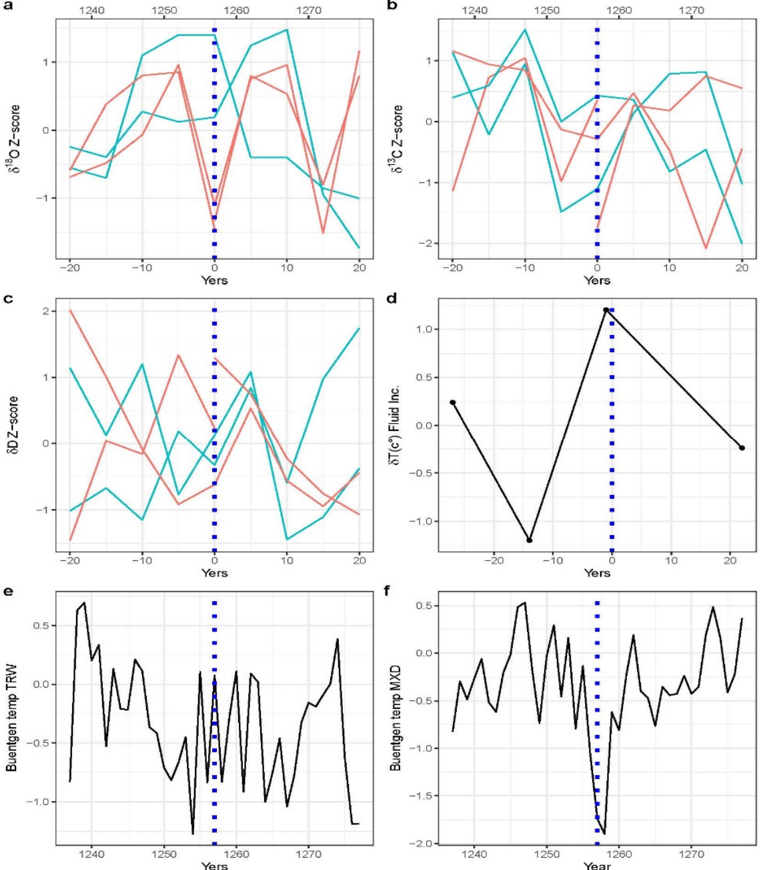
The importance of the stable isotopes in tree rings for the study of the climate variations caused by volcanic eruptions is still unclear. We studied δ18O, δD, δ13C stable isotopes of larch and cembran pine cellulose around four major eruptions with annual resolution, along with a superposed epoch analysis of 34 eruptions with 5-year resolution. Initial analysis of the tropical Tambora (1815 CE) and Samalas (1257 CE) eruptions showed a post-eruption decrease in δ18O values attributed to post-volcanic cooling and increased summer precipitation in Southern Europe, as documented by observations and climate simulations. The post-volcanic cooling was captured by the δD of speleothem fluid inclusion. The δ18O decrease was also observed in the analysis of 34 major tropical eruptions over the last 2000 years. In contrast, the eruptions of c. 750, 756, and 764 CE attributed to Icelandic volcanoes left no significant responses in the cellulose isotopes. Further analysis of all major Icelandic eruptions in the last 2000 years showed no consistent isotopic fingerprints, with the exception of lower post-volcanic δ13C values in larch. In summary, the δ18O values of cellulose can provide relevant information on climatic and hydroclimatic variations following major tropical volcanic eruptions, even when using the 5-year resolution wood samples of the Alpine Tree-Ring Isotope Record database.
Overview
The claims and statistics of this paper haven’t been checked yet.
Free: it reads the open-access text and checks the first 5 claims that cite a source we can check. Create a free account to check every claim.
Integrity signals
Registry
Cites
Statistics
Figures


![Figure 5 Comparison between the trend of the oxygen isotope series and those of oth proxies in mid-8th-century eruptions attributed to Icelandic volcanoes: ( a ) Average series values of the two trees with annual resolution. ( b ) Temperature from the speleothem fl sions from Milandre Cave. ( c ) Reconstructed temperature evolution based on TRW by [6 constructed summer temperature based on MDX by [70]. Figure 5. Comparison between the trend of the oxygen isotope series and those of other climate proxies in mid-8th-century eruptions attributed to Icelandic volcanoes: ( a ) Average series of the δ 18 O values of the two trees with annual resolution. ( b ) Temperature from the speleothem fluid inclusions from Milandre Cave. ( c ) Reconstructed temperature evolution based on TRW by [69] ( d ) Reconstructed summer temperature based on MDX by [70].](https://figures.cochat.ai/paper-figures/a92c9b3487b0440a8b4a85a1f22014ba/variable-response-in-alpine-tree-ring-stable-isotopes-following-volcanic-figure-5.png)


Verification
Claims the paper makes
The claims and statistics of this paper haven’t been checked yet.
Free: it reads the open-access text and checks the first 5 claims that cite a source we can check. Create a free account to check every claim.
Claims other papers make about this one
Each is checked against this paper’s own text: does it say what the citing paper says it does?
The source backs part of the claim, not all of it — or backs it for a different population, condition or comparison.
In the citing paper
“In contrast to many historic large eruptions, no major summer cooling anomaly is recorded in Northern Hemisphere tree-ring reconstructions in the year following the explosive stratospheric end-phase of the Hrafnkatla episode (i.e., 764 CE) [78][79][80] .”
From Decadal-to-centennial increases of volcanic aerosols from Iceland challenge the concept of a Medieval Quiet Period (2024) · cites this paper as [80]
Experimental — accuracy not yet measured
Self-check
Percentages, sums and reported differences re-computed from the paper’s own numbers.
The self-check needs the paper’s full text.
Citations
Cites
Volcanic eruptions and climate
Robock, A. (2000) · Reviews of Geophysics · doi:10.1029/1998rg000054 · Cited by 2,806 · cited 3×
“The solid ash particles have a residence time of a few months, but the volcanic gases—especially SO2 and H2S—produce much more significant effects, as they reach global coverage in the troposphere and form sulphuric acid (H2SO4) aerosols with a residence time of 1–3 years [1].”
BackgroundInfluentialMcCarroll, D., & Loader, N. J. (2004) · Quaternary Science Reviews · doi:10.1016/j.quascirev.2003.06.017 · Cited by 1,817 · cited 2×
“Thus, the δ18O data are of sufficient robustness for climatic investigation, in agreement with [28], and represent a better climate proxy than the other cellulose isotopes [77].”
BackgroundMethod2500 Years of European Climate Variability and Human Susceptibility
Büntgen, U., Tegel, W., Nicolussi, K., McCormick, M., Frank, D., Trouet, V., Kaplan, J. O., Herzig, F., Heussner, K.-U., Wanner, H., et al. (2011) · Science · doi:10.1126/science.1197175 · Cited by 1,451 · cited 8×
“It is worth noting that the isotopes of Central European oak and the δ 18 O of Siberian larch at high-and low-altitude sites were not affected by the Tambora eruption [31,69].”
BackgroundMethodResultInfluentialSelf-citationTiming and climate forcing of volcanic eruptions for the past 2,500 years
Sigl, M., Winstrup, M., McConnell, J. R., Welten, K. C., Plunkett, G., Ludlow, F., Büntgen, U., Caffee, M., Chellman, N., Dahl-Jensen, D., et al. (2015) · Nature · doi:10.1038/nature14565 · Cited by 1,325 · cited 9×
“Such eruptions can cause surface cooling on regional and global scales through stratospheric injection of aerosols and fine ash particles [2].”
BackgroundMethodResultInfluentialSelf-citationHISTALP—historical instrumental climatological surface time series of the Greater Alpine Region
Auer, I., Böhm, R., Jurkovic, A., Lipa, W., Orlik, A., Potzmann, R., Schöner, W., Ungersböck, M., Matulla, C., Briffa, K., et al. (2007) · International Journal of Climatology · doi:10.1002/joc.1377 · Cited by 1,133 · cited 16×
“They were collected from treeline sites in different parts of the European Alps covering a southwest – northeast transect with an elevation range between 1930 and 2400 m ( Figure 1).”
BackgroundMethodInfluentialReporting of stable hydrogen, carbon, and oxygen isotopic abundances (Technical Report)
Coplen, T. B. (1994) · Pure and Applied Chemistry · doi:10.1351/pac199466020273 · Cited by 856 · cited 1×
“The results are reported in parts per thousand (‰) relative to the Vienna Pee Dee Belemnite (VPDB) for carbon and to the Vienna Standard Mean Ocean Water (VSMOW) for hydrogen and oxygen [49].”
Radiocarbon Concentration in Modern Wood
SUESS, H. E. (1955) · Science · doi:10.1126/science.122.3166.415-a · Cited by 748 · cited 1×
“Fossil fuel burning and land-use changes in the Industrial Revolution from about 1850 onward led to a continuous increase in atmospheric carbon dioxide (CO2), which is depleted in δ13C [50]—known as the Suess effect [51].”
BackgroundCooling and societal change during the Late Antique Little Ice Age from 536 to around 660 AD
Büntgen, U., Myglan, V. S., Ljungqvist, F. C., McCormick, M., Di Cosmo, N., Sigl, M., Jungclaus, J., Wagner, S., Krusic, P. J., Esper, J., et al. (2016) · Nature Geoscience · doi:10.1038/ngeo2652 · Cited by 722 · cited 1×
“Moreover, observations, along with climate and glacier reconstructions, show a strong sensitivity of the alpine climate to volcanic forcing (e.g., [5,75,76]).”
BackgroundSelf-citationAtmospheric and environmental effects of the 1783–1784 Laki eruption: A review and reassessment
Thordarson, T., & Self, S. (2003) · Journal of Geophysical Research: Atmospheres · doi:10.1029/2001jd002042 · Cited by 569 · cited 1×
“0 °C, and to have caused winter cooling over a period of three years after the eruption [7,59].”
BackgroundOppenheimer, C. (2003) · Progress in Physical Geography: Earth and Environment · doi:10.1191/0309133303pp379ra · Cited by 514 · cited 1×
“Large socioeconomic impacts following widespread crop failures and subsequent famines in 1816 have been partially associated with the Tambora eruption [5,54].”
Background
Research works printed but not linked: 3
- Schaller, 2009, Climate Effects of the 1883 Krakatoa Eruption: Historical and Present Perspectives, Vjschr. Natf. Ges. Zürich, 154, 31
- Fritz, H. (1976). Tree Rings: Basics and Applications of Dendrochronology, Springer Science & Business Media.
- Treydte, 2001, The Climatic Significance of δ 13 C in Subalpine Spruces (Lötschental, Swiss Alps): A Case Study with Respect to Altitude, Exposure and Soil Moisture, Tellus B Chem. Phys. Meteorol., 53, 593
Cited by
Gabriel, I., Plunkett, G., Abbott, P. M., Behrens, M., Burke, A., Chellman, N., Cook, E., Fleitmann, D., Hörhold, M., Hutchison, W., et al. (2024) · Communications Earth & Environment · doi:10.1038/s43247-024-01350-6 · Cited by 26
“In contrasttomany historiclargeeruptions,no majorsummercooling anomaly is recorded in Northern Hemisphere tree-ring reconstructions in the year following the explosive stratospheric end-phase of the Hrafnkatla episode (i.e., 764 CE) 78 – 80 .”
BackgroundSelf-citationMethodological constrains of tree-ring stable isotope chronologies
Arosio, T., Torbenson, M. C. A., Bebchuk, T., Kirdyanov, A. V., Esper, J., Nakatsuka, T., Sano, M., Urban, O., Nicolussi, K., Leuenberger, M., et al. (2024) · Quaternary Science Reviews · doi:10.1016/j.quascirev.2024.108861 · Cited by 3
Self-citation
Metadata
- Authors
- Arosio, T., Affolter, S., Nicolussi, K., Sigl, M., Ziehmer-Wenz, M. M., Schlüchter, C., Schaad, E., Stähli, R., & Leuenberger, M. C.
- Affiliations
- University of Bern (CH)
- University of Basel (CH)
- Universität Innsbruck (AT)
- Climate and Environmental Physics, Physics Institute, University of Bern, 3012 Bern, Switzerland
- Corresponding author
- Arosio, Tito
- Leuenberger, Markus Christian
- ORCID
- Venue
- Geosciences
- Publisher
- MDPI AG
- Published
- 2022-10-08
- Volume
- 12
- Issue
- 10
- Pages
- 371
- ISSN
- 2076-3263 (ISSN-L)
- OpenAlex
- W4303685888
- Cited by
- 2
- References
- 79
- Citations by year
- 2024: 2
- FWCI
- 0.19
- Type
- journal article
- Language
- en
- Open access
- gold
- doi.org
- Licence
- Locations
- Geosciences (publishedVersion, cc-by)
- edoc (University of Basel) (acceptedVersion)
- Bern Open Repository and Information System (University of Bern) (submittedVersion, cc-by)
- DOAJ (DOAJ: Directory of Open Access Journals) (submittedVersion, cc-by-sa)
- Funders
- Swiss National Science Foundation (SNF 200021L_144255, SNF 200020_172550, I-265 1183-N19, CRSI22-132646, CRSII2_147674, 820047)
- Austrian Science Fund (SNF 200021L_144255, SNF 200020_172550, I-265 1183-N19, CRSI22-132646, CRSII2_147674, 820047)
- Oeschger Centre for Climate Change Research, University of Bern (SNF 200021L_144255, SNF 200020_172550, I-265 1183-N19, CRSI22-132646, CRSII2_147674, 820047)
- European Research Council Horizon 2020 Research and Innovation program (SNF 200021L_144255, SNF 200020_172550, I-265 1183-N19, CRSI22-132646, CRSII2_147674, 820047)
- Topics
- Physical Sciences › Earth and Planetary Sciences › Atmospheric Science › Tree-ring climate responses
- Physical Sciences › Earth and Planetary Sciences › Atmospheric Science › Geology and Paleoclimatology Research
- Social Sciences › Archeology › Archaeology and ancient environmental studies
- Keywords
- volcanic eruptions, tree-ring stable isotopes, tropical eruptions, Tambora eruption, Samalas eruption, larch, hydroclimatic variability, superposed epoch analysis
About these checks
Registry, retraction, Cites and statistics results are computed, not judged, with one exception: a printed reference that no index lists is read once by a model before it counts as a citation error. Claims are extracted by a model and kept only when their quote appears verbatim in the text; each cited source is then checked, with a model’s help, for whether it says what the claim relies on. Those verdicts can be wrong — read the claim’s quote and the cited source before relying on one.
Statistics and arithmetic are recomputed, not judged.
Confidence bands are shown only for fields calibrated on our annotated test set. None is calibrated yet, so no band is shown.
What counts as a claim ›How we measure confidence ›How we check this ›
Are you an author, or do you see a problem with this page? Request a review
How to cite
Cite CoChat for the checks on this page, and the paper for its own findings.
- This page
- CoChat. (2026). Citation check: Variable Response in Alpine Tree-Ring Stable Isotopes Following Volcanic Eruptions in the Tropics and Iceland. https://app.cochat.ai/papers/10.3390/geosciences12100371
- The paper
- Arosio, T., Affolter, S., Nicolussi, K., Sigl, M., Ziehmer-Wenz, M. M., Schlüchter, C., Schaad, E., Stähli, R., & Leuenberger, M. C. (2022). Variable Response in Alpine Tree-Ring Stable Isotopes Following Volcanic Eruptions in the Tropics and Iceland. Geosciences. https://doi.org/10.3390/geosciences12100371
Data sources
Bibliographic data: Semantic Scholar, OpenAlex, Crossref.
Contains information from the Semantic Scholar Academic Graph Datasets, made available under the ODC Attribution License (ODC-BY 1.0).
Semantic Scholar’s data is described in: Kinney, R., et al. (2023). The Semantic Scholar Open Data Platform. arXiv:2301.10140.
