

Flood Susceptibility Mapping through the GIS-AHP Technique Using the Cloud
Open accessThe DOI matches its Crossref record; 55 of the 55 references it cites were found in a registry or an index.
Abstract
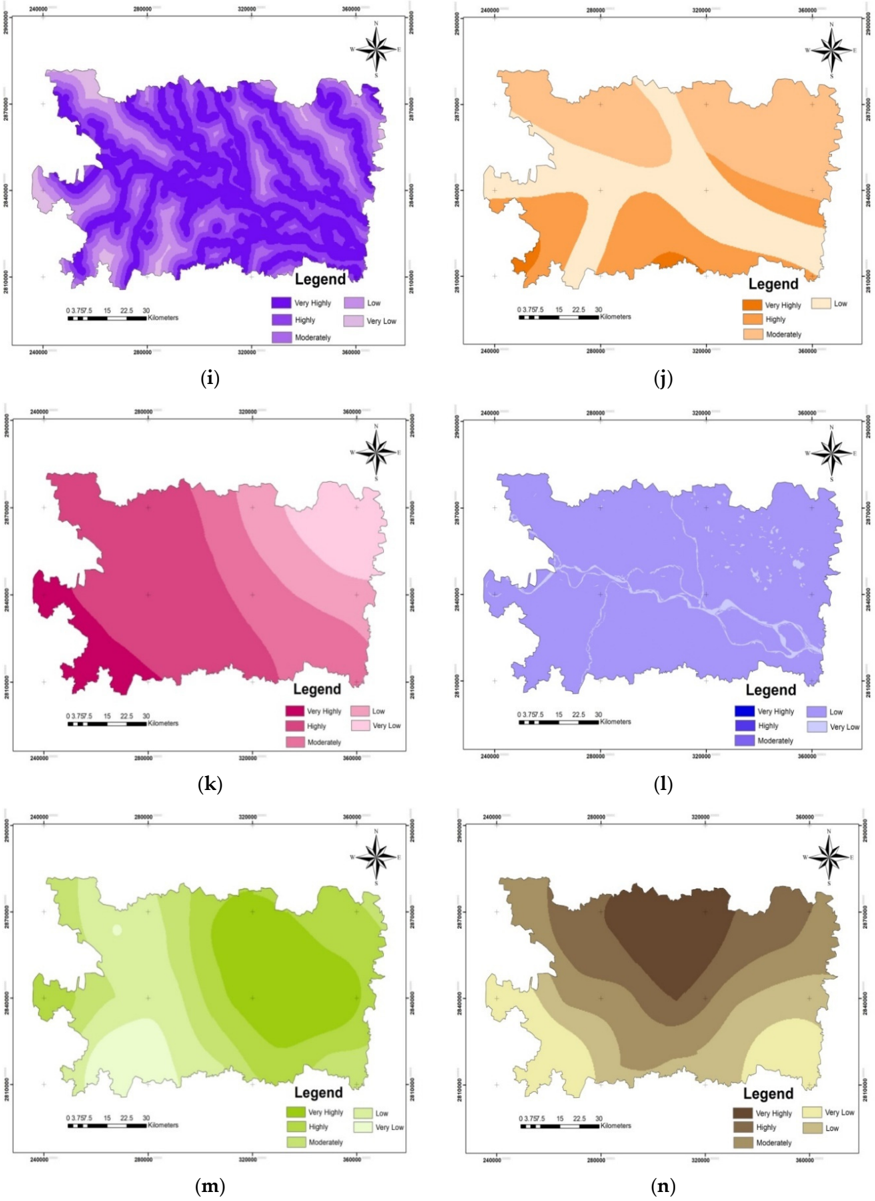
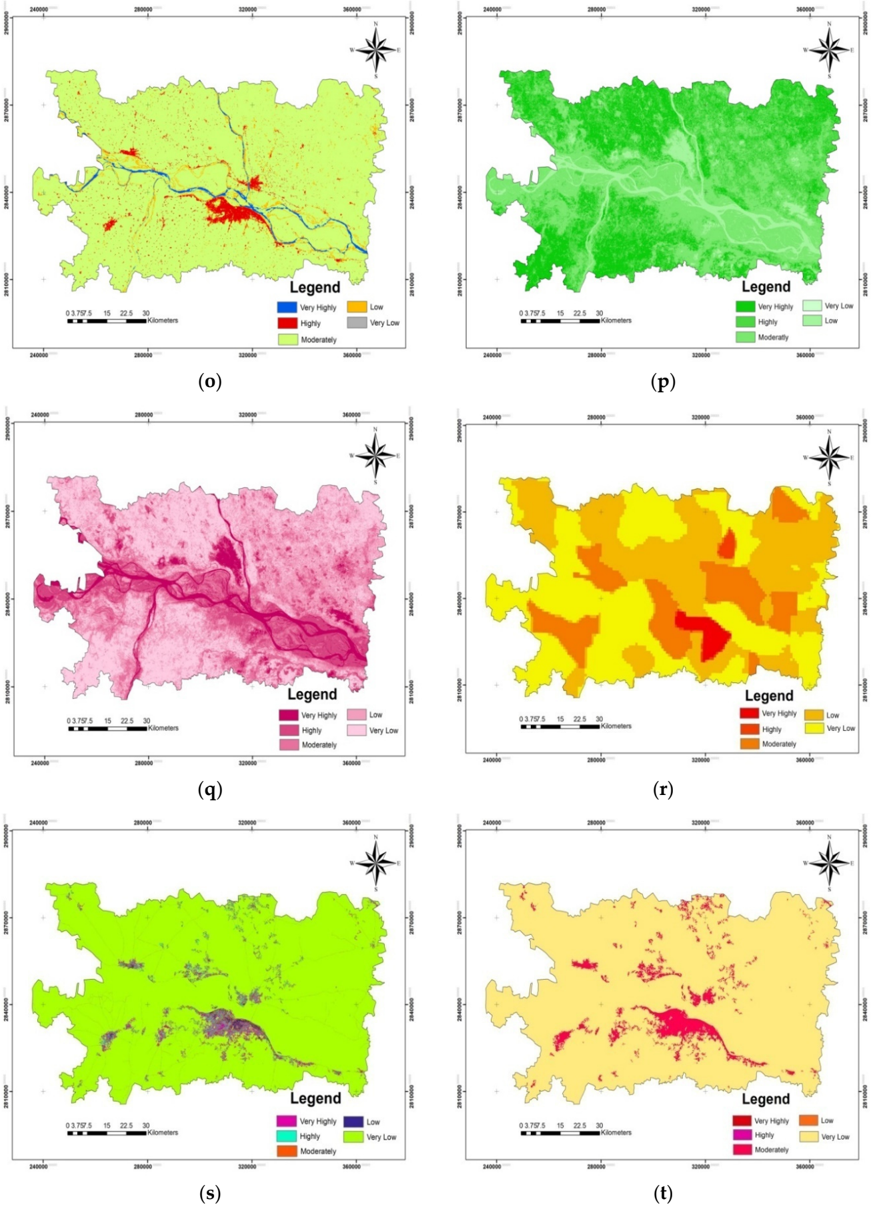
Flood susceptibility mapping is essential for characterizing flood risk zones and for planning mitigation approaches. Using a multi-criteria decision support system, this study investigated a flood susceptible region in Bihar, India. It used a combination of the analytical hierarchy process (AHP) and geographic information system (GIS)/remote sensing (RS) with a cloud computing API on the Google Earth Engine (GEE) platform. Five main flood-causing criteria were broadly selected, namely hydrologic, morphometric, permeability, land cover dynamics, and anthropogenic interference, which further had 21 sub-criteria. The relative importance of each criterion prioritized as per their contribution toward flood susceptibility and weightage was given by an AHP pair-wise comparison matrix (PCM). The most and least prominent flood-causing criteria were hydrologic (0.497) and anthropogenic interference (0.037), respectively. An area of ~3000 sq km (40.36%) was concentrated in high to very high flood susceptibility zones that were in the vicinity of rivers, whereas an area of ~1000 sq km (12%) had very low flood susceptibility. The GIS-AHP technique provided useful insights for flood zone mapping when a higher number of parameters were used in GEE. The majorities of detected flood susceptible areas were flooded during the 2019 floods and were mostly located within 500 m of the rivers’ paths.
Overview
The claims and statistics of this paper haven’t been checked yet.
Free: it reads the open-access text and checks the first 5 claims that cite a source we can check. Create a free account to check every claim.
Integrity signals
Registry
Cites
Statistics
Figures




Verification
Claims the paper makes
The claims and statistics of this paper haven’t been checked yet.
Free: it reads the open-access text and checks the first 5 claims that cite a source we can check. Create a free account to check every claim.
Claims other papers make about this one
Each is checked against this paper’s own text: does it say what the citing paper says it does?
The source backs part of the claim, not all of it — or backs it for a different population, condition or comparison.
In the citing paper
“Elevation significantly impacts flood vulnerability, with lower-lying areas typically facing a higher risk of flooding, especially in coastal regions [59,60].”
From Urban Flood Vulnerability Assessment in Freetown, Sierra Leone: AHP Approach (2024) · cites this paper as [59]
Experimental — accuracy not yet measured
Self-check
Percentages, sums and reported differences re-computed from the paper’s own numbers.
The self-check needs the paper’s full text.
Citations
Cites
Red and photographic infrared linear combinations for monitoring vegetation
Tucker, C. J. (1979) · Remote Sensing of Environment · doi:10.1016/0034-4257(79)90013-0 · Cited by 11,754 · cited 1×
“In our study, the GEE platform utilized the resampling cubic convolution of Landsat 8 (Collection-1 Tier-1) calibrated reflectance values for Path: 141 and Row: 42 (covering the study area) images with supporting metadata between 20 August 2019 and 20 October 2019 with cloud-free images (<5% cloud cover) for SAVI and…”
MethodA soil-adjusted vegetation index (SAVI)
Huete, A. R. (1988) · Remote Sensing of Environment · doi:10.1016/0034-4257(88)90106-x · Cited by 7,948 · cited 1×
“A wide range of such data sets are available, such as GHSL and gridded population of the world (GPW) [48,49].”
BackgroundBEVEN, K. J., & KIRKBY, M. J. (1979) · Hydrological Sciences Bulletin · doi:10.1080/02626667909491834 · Cited by 6,670
Renard, K. G., Foster, G. R., Weesies, G. A., McCool, D. K., & Yoder, D. C. (1996) · Cited by 4,785
Optimization by the Analytic Hierarchy Process
Saaty, T. L. (1979) · doi:10.21236/ada214804 · Cited by 4,466
Effective and efficient global optimization for conceptual rainfall‐runoff models
Duan, Q., Sorooshian, S., & Gupta, V. (1992) · Water Resources Research · doi:10.1029/91wr02985 · Cited by 3,310 · cited 1×
“ANN has been extensively used for flood susceptibility mapping [18,19]; however, it has drawbacks, such as over-fitting and under-fitting, slow learning, the curse of dimensionality, and slow convergence to a local optimum; in addition, its performance for processing complex hydrological phenomena has been inadequate…”
BackgroundAyalew, L., & Yamagishi, H. (2005) · Geomorphology · doi:10.1016/j.geomorph.2004.06.010 · Cited by 1,913 · cited 1×
“AHP is a multi-perspective multi-objective decision-making model that enables users and planners to quantitatively derive a scale of preference drawn from a set of alternatives [51].”
BackgroundTehrany, M. S., Pradhan, B., & Jebur, M. N. (2014) · Journal of Hydrology · doi:10.1016/j.jhydrol.2014.03.008 · Cited by 1,005 · cited 3×
“In our study, the GEE platform utilized the resampling cubic convolution of Landsat 8 (Collection-1 Tier-1) calibrated reflectance values for Path: 141 and Row: 42 (covering the study area) images with supporting metadata between 20 August 2019 and 20 October 2019 with cloud-free images (<5% cloud cover) for SAVI and…”
BackgroundInfluentialKhosravi, K., Pham, B. T., Chapi, K., Shirzadi, A., Shahabi, H., Revhaug, I., Prakash, I., & Tien Bui, D. (2018) · Science of The Total Environment · doi:10.1016/j.scitotenv.2018.01.266 · Cited by 792
Choubin, B., Moradi, E., Golshan, M., Adamowski, J., Sajedi-Hosseini, F., & Mosavi, A. (2019) · Science of The Total Environment · doi:10.1016/j.scitotenv.2018.10.064 · Cited by 787
Research works printed but not linked: 4
- Amin, K. Application of Remote Sensing and GIS in Flash Flood Hazard Mapping and Hydraulic Design (Case Study of Wadi Dahdah, Saudi Arabia). 2019. Available online: https://www.academia.edu/20126182/ Application_of_Remote_Sensing_and_GIS_for_Floodplain_mapping_and_Hydraulic_design (accessed on 1 January 2020).
- Center for International Earth Science Information Network-CIESIN-Columbia University (CIESIN). Gridded Population of the World, Version 4 (GPWv4): Basic Demographic Characteristics, Revision 11; NASA Socioeconomic Data and Applications Center (SEDAC): Palisades, NY, USA, 2018. Available online: https: //sedac.ciesin.columbia.edu/data/collection/gpw-v4 (accessed on 10 May 2019). [CrossRef]
- Pesaresi, M.; Ehrilch, D.; Florczyk, A.J.; Freire, S.; Julea, A. GHS Built-Upgrid, Derived from Landsat, Multitemporal (1975, 1990, 2000, 2014) (versionR2015); European Commission, Joint Research Centre (JRC): Ispra, Italy, 2019. Available online: http://data.europa.eu/89h/jrc-ghsl-hs_built_ldsmt_globe_r2015b (accessed on 21 April 2019).
- Saaty, T.L.; Vargas, G.L. Models, Methods, Concepts, and Applications of the Analytic Hierarchy Process. Int. Ser. Oper. Res. Manag. Sci. 2001, 32, 93. [CrossRef]
Cited by
Items 101–200 of 287
Abrar, M. F., Iman, Y. E., Mustak, M. B., & Pal, S. K. (2024) · Environmental Monitoring and Assessment · doi:10.1007/s10661-024-12780-2 · Cited by 10
“The final map of flood susceptibility was constructed with a CR range of 0.055 ( 0.1 , verified) following the application of the total weighted causal criteria (Swain et al., 2020).”
InfluentialKakavand, M., Haghizadeh, A., & Soleimani-Motlagh, M. (2025) · Earth Science Informatics · doi:10.1007/s12145-024-01577-z · Cited by 10
“Swain et al. (2020) used the GIS-AHP technique in the Google Earth Engine (GEE) with a high number of parameters for flood hazard zoning.”
Mapping flood hazard in Driouch region (north-eastern of Morocco) using AHP and numerical approaches
Hadri, L. E., Boushaba, F., Chourak, M., & Baida, M. E. (2025) · Journal of African Earth Sciences · doi:10.1016/j.jafrearsci.2025.105776 · Cited by 9
Quang, N. H., Hanh, L. N., & An, N. V. (2025) · Advances in Space Research · doi:10.1016/j.asr.2025.07.105 · Cited by 9
Chihi, H., Hammami, M. A., & Mezni, I. (2025) · Natural Hazards · doi:10.1007/s11069-025-07533-4 · Cited by 9
“Sentinel-1 SAR data for the pre-and post-flood periods of both events were processed independently for each flood (Swain et al. 2020).”
Delineation of flood risk terrains and rainfall visualisation in the North Western part of Ghana
Dekongmen, B. W., Kabo-bah, A. T., Anornu, G. K., Akpoti, K., Amo-Boateng, M., Antwi, E. O., Boamah, E. O., & Sunkari, E. D. (2024) · Modeling Earth Systems and Environment · doi:10.1007/s40808-024-02041-z · Cited by 9
“…selectively combined different thematic factors to either model, delineate, and assess; flood risk areas (Liuzzo et al. 2019; Mishra and Sinha 2020; Swain et al. 2020a, b; Roy et al. 2021; Gacu et al. 2022; Al-Taani et al. 2023), and groundwater recharge potential zones (Andualem and Demeke 2019;…”
InfluentialFlood prioritization based on fuzzy best worse multi-criteria decision-making method
Meshram, S. G., Ildoromi, A., Sepehri, M., & Santos, C. A. G. (2022) · Arabian Journal of Geosciences · doi:10.1007/s12517-022-10570-z · Cited by 9
“2020), flood magnitude (Swain et al. 2020; Sepehri et al. 2017; Lin et al. 2020), and groundwater vulnerability (Sener and Davraz 2013; Abdullah et al.”
BackgroundRasam, A. R. A., Taileh, V., Lin, S., Adnan, N. A., & Ghazali, R. (2023) · PLANNING MALAYSIA · doi:10.21837/pm.v21i26.1264 · Cited by 9
“Mapping flood vulnerability is critical for identifying flood risk zones and developing mitigation strategies (Swain et al., 2020).”
BackgroundPluvial Flood Susceptibility in the Local Community of the City of Gospić (Croatia)
Šiljeg, S., Milošević, R., & Mamut, M. (2024) · Sustainability · doi:10.3390/su16041701 · Cited by 9
Aksoy, O., Çakıl, E. A., & Erken, K. (2023) · Doğal Afetler ve Çevre Dergisi · doi:10.21324/dacd.1174813 · Cited by 8
Flood Risk Assessment of Himalayan Foothill Rivers: A Study of Jaldhaka River, India
Raha, A., Gupta, S., & Biswas, M. (2023) · Springer geography · doi:10.1007/978-3-031-21086-0_4 · Cited by 8
Kotecha, M. J., Tripathi, G., Singh, S. K., Kanga, S., Meraj, G., Sajan, B., & Kumar, P. (2023) · Advances in geographical and environmental sciences · doi:10.1007/978-981-99-2605-3_14 · Cited by 9
Singha, C., & Swain, K. C. (2022) · Algorithms for intelligent systems · doi:10.1007/978-981-16-8225-4_6 · Cited by 8
Self-citationNedala, S., Puja, S., Kempango, L., & Ikendi, S. (2024) · Natural Hazards · doi:10.1007/s11069-024-06843-3 · Cited by 9
“Floods are one of the most common and dangerous natural hazard that threaten lives, prop - erty, farmland, and the socioeconomic system of population (Swain et al. 2020 ; Kassegn and Endris 2021).”
Urban Flood Susceptibility Mapping of Kochi Taluk Using Remote Sensing and GIS
Shreekumar, S., Madhu, D., & Akella, A. K. (2021) · International Conference on Electrical, Computer and Communication Technologies (ICECCT) · doi:10.1109/icecct52121.2021.9616790 · Cited by 8
de Melo, S. K., Almeida, A. K., & de Almeida, I. K. (2023) · Environmental Science and Pollution Research · doi:10.1007/s11356-023-27856-8 · Cited by 8
Mind’je, R., Li, L., Kayumba, P. M., Mupenzi, C., Mindje, M., & Hao, J. (2023) · Environmental Earth Sciences · doi:10.1007/s12665-023-11088-7 · Cited by 7
“4i) has been considered as it relates to the rate of discharge with the power of erosion of the flowing water in a specific basin area (Swain et al. 2020).”
BackgroundHossain, M. Z., & Adhikary, S. K. (2024) · Lecture notes in civil engineering · doi:10.1007/978-981-99-3826-1_7 · Cited by 7
Borowska-Stefańska, M., Diller, C., Grama, V., Goniewicz, K., Kowalski, M., Kurzyk, P., Sahebgharani, A., & Wiśniewski, S. (2022) · International Journal of Disaster Risk Reduction · doi:10.1016/j.ijdrr.2022.103431 · Cited by 7
Okoli, E. A., Maximus, J. K., Agoha, C. C., Ikoro, D. O., Odondiri, O. D., Aniyom, E. A., Oladipupo, J. T., & Emenyonu, U. D. (2025) · Journal of African Earth Sciences · doi:10.1016/j.jafrearsci.2025.105872 · Cited by 7
Ocak, F., & BAHADIR, M. (2024) · Jeomorfolojik Araştırmalar Dergisi · doi:10.46453/jader.1513212 · Cited by 7
“…(Warner, 2001; Sanjay & Goel, 2002; Gupta & Srivastava, 2010; Patel & Srivastava, 2013; Özşahin, 2016; El-Haddad et al., 2020; Balogun et al., 2020; Swain et al., 2020; Ocak & Bahadır, 2020; 2021; Oğuz et al., 2022; Tariq et al., 2022; Majeed et al., 2023; Bozdoğan & Canpolat, 2024; Altın et al.,…”
A systematic flood risk assessment of Bloemfontein Watershed, South Africa
Mshelia, Z. H., & Belle, J. A. (2024) · Geomatics Natural Hazards and Risk · doi:10.1080/19475705.2024.2423739 · Cited by 7
“Researchers often validate their data-sets against historical flood records or conduct field surveys to ensure reliability (Swain et al. 2020; Mshelia., 2024).”
Singha, C., Swain, K. C., Sahoo, S., Al‐Quraishi, A. M. F., Alao, J. O., Almohamad, H., Ahmed, M. F. M., & Abdo, H. G. (2025) · Forest Science and Technology · doi:10.1080/21580103.2025.2481122 · Cited by 9
“Elevation and slope are topographic factors reflecting total water storage, which affects TWI and forest biomass structure drought conditions (Swain et al. 2020).”
Self-citationBishikwabo, I., Mambo, H., Kamanda, J. K., Abdelbaki, C., Nanyunga, M. A., & Kumar, N. (2025) · GeoHazards · doi:10.3390/geohazards6030038 · Cited by 6
Kumar, V., Rashiq, A., & Prakash, O. (2025) · Theoretical and Applied Climatology · doi:10.1007/s00704-025-05669-8 · Cited by 7
“To tackle the recurring issue of floods, researchers have utilized advanced remote sensing techniques and geospatial analyses (Basak et al. 2022 ; Jha and Gundimeda 2019 ; Matheswaran et al. 2019 ; Pandey et al. 2010 ; Sarkar et al. 2022 ; Swain et al. 2020 ; Tripathi et al. 2022 ).”
Ashraf, M., Shah, Q., Arshad, A., & Murtaza, G. (2025) · Natural Hazards · doi:10.1007/s11069-025-07723-0 · Cited by 6
“Among all, the analytical hierarchy process (AHP), which is the most recommended method, has been utilized to develop a unique framework for decision-making regarding flood susceptibility mapping (Swain et al. 2020).”
Development, Application, and Validation of the Urban Flood Susceptibility Index
de Moraes, R. B. F., & Gonçalves, F. V. (2024) · Water Resources Management · doi:10.1007/s11269-024-03782-3 · Cited by 6
“Swain et al. (2020) point out that densely inhabited and urbanized areas are relevant to the hydrological dynamics of watersheds.”
InfluentialYurteri, C. (2024) · Mühendislik Bilimleri ve Tasarım Dergisi · doi:10.21923/jesd.1438999 · Cited by 8
Sharma, L., & Rana, N. K. (2024) · IDRiM Journal · doi:10.5595/001c.121460 · Cited by 5
“Land Use & Land Cover: Land use & Land cover has a considerable impact on geological stability and hydrological functions which in response significantly influences all the hazards (Khatakho et al., 2021; Aksha et al., 2020; Azarafza et al., 2021; Kumar et al., 2018; Swain et al., 2020).”
BackgroundStemn, E., Kumi-Boateng, B., & Fosu, S. (2025) · Journal of African Earth Sciences · doi:10.1016/j.jafrearsci.2025.105706 · Cited by 5
Dieno, W. U., & Pathan, S. A. (2025) · Remote Sensing in Earth Systems Sciences · doi:10.1007/s41976-025-00226-3 · Cited by 5
“Swain et al. [28] demonstrated the effectiveness of GIS-AHP integration in Bihar, India, to produce detailed flood susceptibility maps.”
COĞRAFİ BİLGİ SİSTEMİ TABANLI ANALİTİK HİYERARŞİ SÜRECİ KULLANILARAK TAŞKIN TEHLİKE HARİTALAMASI
Karakuş, C. B., & Ceylan, Ş. (2022) · Mühendislik Bilimleri ve Tasarım Dergisi · doi:10.21923/jesd.1049464 · Cited by 7
Assessing flash flood inundation from an extreme rainfall event: case study: Wadi Al Jizzi Oman
Abushandi, E., Sarihi, M. A., & Ibrahim, O. R. (2023) · AQUA - Water Infrastructure Ecosystems and Society · doi:10.2166/aqua.2023.100 · Cited by 5
Girma, D. (2023) · OPSearch American Journal of Open Research · doi:10.58811/opsearch.v2i2.30 · Cited by 5
COPACEAN, L., Man, E. T., Herban, S., Popescu, C. A., & COJOCARIU, L. (2024) · Present Environment and Sustainable Development · doi:10.47743/pesd2024181009 · Cited by 5
“Parameters for determining TWI were generated from the DEM, and to generate the TWI map, the relation (1) was applied (Swain et al., 2020): (1) where α is the cumulative upslope draining area per contour length (unity) and tanβ is the slope angle at the point of contact.”
BackgroundMethodInfluentialKundu, S., & Mondal, T. K. (2025) · Stochastic Environmental Research and Risk Assessment · doi:10.1007/s00477-025-02957-7 · Cited by 5
“Vegetation cover facilitates infiltration and reduces flood risk (Tehrany et al. 2015a ; Swain et al. 2020 ).”
Flood detection using PolSAR decomposition, feature selection, and deep learning
Lee, J., Janizadeh, S., Melancon, A. M., Bateni, S. M., Kim, D., Molthan, A., Jun, C., Farhadiani, R., Homayouni, S., & Dinka, M. O. (2025) · Gondwana Research · doi:10.1016/j.gr.2025.06.022 · Cited by 5
Rakesh, C. J., Govindaraju, G., Lokanath, S., & Kumar, A. K. (2023) · Arabian Journal of Geosciences · doi:10.1007/s12517-023-11780-9 · Cited by 5
“…and is also used in various applications like groundwater quality analysis (Fatma et al. 2022), site suitability of groundwater recharge zone (Kaliraj et al. 2014), flood susceptibility mapping (Swain et al. 2020) and land suitability analysis for agriculture (Yalew et al. 2016; Roy et al. 2022).”
BackgroundCerbelaud, A., Roupioz, L., Blanchet, G., Breil, P., & Briottet, X. (2021) · The international archives of the photogrammetry, remote sensing and spatial information sciences/International archives of the photogrammetry, remote sensing and spatial information sciences · doi:10.5194/isprs-archives-xliii-b3-2021-693-2021 · Cited by 5
“* Corresponding author Some authors have developed change detection techniques to detect areas affected by flood and erosion from a heavy rainfall, but over long time intervals and with medium spatial resolution (30 m from Landsat, Dhakal et al., 2002), or with higher resolution but strictly limited to overflowing (4…”
InfluentialBucogen, G. G. B., Píccolo, M. C., & Bohn, V. Y. (2020) · Scientific Repository of Open Access of Portugal (RCAAP) · doi:10.18055/finis21647 · Cited by 5
Zhang, Y., & Jaber, F. H. (2025) · Ecological Informatics · doi:10.1016/j.ecoinf.2025.103573 · Cited by 4
Pawar, U. V., & Irfan, M. (2026) · Springer eBooks · doi:10.1007/978-3-032-04754-0_21 · Cited by 4
Sutradhar, H. (2023) · GeoJournal · doi:10.1007/s10708-023-10948-w · Cited by 4
“…neural networks (ANNs) (Elsafi, 2014; Wahab & Muhamad Ludin, 2018); Analytic Hierarchy Process (AHP) (Souissi et al., 2020; Vojtek et al., 2019; Swain et al., 2020; Dahri & Abida, 2017); fuzzy AHP (Costache et al., 2020; Talha et al., 2019); logistic regression (Chowdhuri et al., 2020; Nandi…”
Settlement Suitability Analysis: The Case of Bursa City
Kuşcu, İ. (2024) · Bilge International Journal of Science and Technology Research · doi:10.30516/bilgesci.1527354 · Cited by 4
Hulu, A. E., Dandy Adriansyah, R., Mizero, A., Arianingsih, I., Hamka, H., Purnama, R., & Maiwa, A. (2025) · Jurnal Ilmu Lingkungan · doi:10.14710/jil.23.5.1243-1252 · Cited by 4
Shakti, P. C., Hirano, K., & Iwanami, K. (2023) · Sustainability · doi:10.3390/su15064909 · Cited by 4
Hung, P. M., Nguyen, H. D., & Van, C. P. (2023) · Geographia Technica · doi:10.21163/gt_2023.182.07 · Cited by 4
Aksoy, H. (2023) · Kastamonu University Journal of Forestry Faculty · doi:10.17475/kastorman.1394958 · Cited by 6
Abdelgiom, M. A. (2024) · Yanbu Journal of Engineering and Science · doi:10.53370/001c.118790 · Cited by 3
DETERMINATION OF GROUNDWATER POTENTIAL ZONE USING AHP BASED ON GIS FOR KONYA, TÜRKİYE
Baykal, T., Taylan, D., & Terzi, Ö. (2024) · Mühendislik Bilimleri ve Tasarım Dergisi · doi:10.21923/jesd.1495305 · Cited by 3
An assessment framework for evaluating urban flood vulnerabilities using Night-Time Light data
Kangana, N., & Kankanamge, N. (2025) · Urban Resilience and Sustainability · doi:10.3934/urs.2025003 · Cited by 3
Wale, P. B., Sivasankar, T., Sanyal, R., Ghosh, S., & Srivastava, H. S. (2025) · Journal of the Indian Society of Remote Sensing · doi:10.1007/s12524-025-02320-x · Cited by 3
“…and capture all variables that might be relevant to the target outcome, regardless of linear relationships, a limitation of VIF/TOL which only addresses linear sample quality and quantity, FCF selection, and algorithm performance (Prasad et al., 2024; Purwanto et al., 2023; Swain et al., 2020).”
Asitatikie, A. N., Mekonnen, Y. A., & Melsse, D. W. (2025) · Discover Sustainability · doi:10.1007/s43621-025-02038-3 · Cited by 4
“Flood intensity is also significantly influenced by drainage density [54].”
Ghosh, D., & Das, S. (2025) · Advances in Space Research · doi:10.1016/j.asr.2025.11.084 · Cited by 4
Geospatial analysis and machine learning for flood susceptibility mapping
Bhattarai, N., Bk, S., Sharma, A., Dumre, S., Shrestha, R., & Regmi, S. (2026) · Journal of Water and Climate Change · doi:10.2166/wcc.2026.315 · Cited by 3
Identifikasi Daerah Rawan Banjir di Kabupaten Sikka Menggunakan Geographic Information System (GIS)
Zulkifli, B., Ihsan, F., Makkawaru, M. A., Fadhalna, M., & Tallo, A. J. (2024) · Angkasa Jurnal Ilmiah Bidang Teknologi · doi:10.28989/angkasa.v16i1.1966 · Cited by 3
Senan, C. P. P. C., Ajin, R. S., Devi, B. R. A., Rajaneesh, A., Nagar, J. K., & Sajinkumar, K. S. (2025) · Water Conservation Science and Engineering · doi:10.1007/s41101-025-00423-7 · Cited by 3
“High TWI values encourage accumulation of water and result in high overland flow [6].”
InfluentialGhosh, D., Banerjee, M., Karmakar, M., & Mandal, D. (2021) · Advances in geographic information science · doi:10.1007/978-3-030-75197-5_6 · Cited by 3
Bone, C., Rubinato, M., Bosseler, B., & Schlüter, M. (2023) · Geosciences · doi:10.3390/geosciences13050134 · Cited by 3
Shannon Entropi (SE) ve AHP Metoduyla Artvin (Arhavi) Kapisre Taşkınının İncelenmesi
Yükseler, U., & DURSUN, Ö. F. (2024) · Yüzüncü Yıl Üniversitesi Fen Bilimleri Enstitüsü Dergisi · doi:10.53433/yyufbed.1395065 · Cited by 3
CLIM-SEG: A generalizable segmentation model for heat and flood risk mapping
Ray, A., Xu, K., Bayomi, N., & Fernández, J. (2024) · Climate Risk Management · doi:10.1016/j.crm.2024.100654 · Cited by 3
Flood Vulnerability Assessment of A Semi-Arid Region: A Case Study of Dutse in Jigawa State, Nigeria
Kura, N. U., Usman, S. U., & Khalil, M. S. (2023) · Journal of Environmental Issues and Climate Change · doi:10.59110/jeicc.v2i1.151 · Cited by 3
“Flood is a natural and persistent overflow of voluminous amount water which happens due to heavy rainfall beyond the absorption capacity of the geographical area and its features (Swain, Singha, & Nayak, 2020).”
BackgroundDeepika, B., Rajakumari, S., Madhumitha, R., & Malathi, M. (2024) · Journal of the Indian Society of Remote Sensing · doi:10.1007/s12524-024-01999-8 · Cited by 2
“Prominent among these techniques are the Analytic Hierarchy Process (AHP), Fre - quency Ratio (FR), Weight of Evidence (WOE), Logistic Regression (LR), and weighting factor (Addis, 2023; Khos-ravi et al., 2019; Swain et al., 2020 ; Wang et al., 2023).”
Abishek, S. R., Antony Ravindran, A., Pitchaimani, S., V, Velmurugan, P. M., Sakthi Priya, R., Haris, S., & Nishamangai, G. (2025) · Economics of Disasters and Climate Change · doi:10.1007/s41885-025-00169-5 · Cited by 2
“For example, Hammami et al. (2019) employed GIS-based multi-criteria decision analysis with AHP in Tunisia, and Swain et al. (2020) used GIS-AHP methodologies with cloud computing to map flood susceptibility.”
Assessing Flood Susceptibility Using GIS and AHP Method: Case of Mandovi River Basin, Goa
Rajeev, R., Naik, S., & Nivedha, N. (2025) · Springer geography · doi:10.1007/978-3-031-62376-9_4 · Cited by 2
Imani, W. N., Mokhtar, E. S., Hanif, M., & Idrees Mohammed, O. (2025) · PLANNING MALAYSIA · doi:10.21837/pm.v23i36.1706 · Cited by 2
“The rainfall map is divided into different categories using the natural break (Jenks) method (Swain et al., 2020) and kernel density to identify areas with higher and lower flood risk within the study area.”
Linghu, C.-W., Qian, Z., Chen, W., Li, J., Yang, K., Zou, S., Yang, L., Gao, Y., Zhu, Z., & Gao, Q. (2025) · Land · doi:10.3390/land14101966 · Cited by 2
HEC-RAS Tabanlı 2 Boyutlu Taşkın Tehlike Çalışması: Bahadınlı ve Karadere (Burhaniye – Balıkesir)
Durak, M., & Cürebal, İ. (2025) · Jeomorfolojik Araştırmalar Dergisi · doi:10.46453/jader.1777585 · Cited by 2
Saketh Shetty, T., Prashanth, K., & Shetty, A. (2026) · Journal of the Indian Society of Remote Sensing · doi:10.1007/s12524-025-02381-y · Cited by 2
BİTEK, D., & Erenoğlu, R. C. (2026) · Jeomorfolojik Araştırmalar Dergisi · doi:10.46453/jader.1892689 · Cited by 2
Ali, Z. F., Khoshnaw, D. S., Ibrahim, G. R. F., Salem, A., Kiss, K., & Pirisi, G. (2026) · Geoenvironmental Disasters · doi:10.1186/s40677-026-00378-4 · Cited by 2
Hassanvand, M. R., Zecchin, A. C., & Dandy, G. C. (2026) · Environmental Challenges · doi:10.1016/j.envc.2026.101479 · Cited by 3
COPACEAN, L., Cojocariu, L. L., Popescu, C. A., Bădăluță-Minda, C., Horablaga, A., Pisculidis, T., & Herbei, M. V. (2026) · Land · doi:10.3390/land15050724 · Cited by 3
Flood vulnerability assessment along the eThekwini east coastline, South Africa
Amatebelle, E. C., Mshelia, Z. H., & Ogundeji, A. A. (2026) · Progress in Disaster Science · doi:10.1016/j.pdisas.2026.100692 · Cited by 2
Carrasco, G. G. A., Zuloeta, O. C., Nunura, G. D. S. S., Villegas, D. V. V., Talledo, R. D. C., & Aguilar, W. A. O. (2022) · Revista Científica Epistemia · doi:10.26495/re.v6i1.2132 · Cited by 2
Kundu, A., Mukhopadhyay, S., & Panja, S. (2022) · Springer eBooks · doi:10.1007/978-3-031-11181-5_8 · Cited by 2
Bose, S., & Halder, S. (2023) · Asia-Pacific Journal of Regional Science · doi:10.1007/s41685-023-00274-x · Cited by 2
“2020), flood affected areas (Ghosh and Kar 2018; Swain et al. 2020), landslide mapping (Pourghasemi et al.”
BackgroundMaulana, B. I., Hidayah, E., & Halik, G. (2023) · UKaRsT · doi:10.30737/ukarst.v7i2.3999 · Cited by 2
“[5], [6], analytic hierarchy processes (AHP) [7], [8], logistic regression [9], fuzzy logic[10], weights-of-evidence [11] and decision trees [12].”
BackgroundAlfa, M. I., Adie, D. B., Yaroson, H. B., Ovuarume, B. U., & Owamah, H. I. (2024) · Circular economy and sustainability · doi:10.1007/978-3-031-50725-0_21 · Cited by 2
Flood Mapping using HEC-RAS and GIS: A Case Study of Palembang Watersheds
Alia, F., Rendana, M., Idris, W. M. R., Sarino, S., & Yuono, A. L. (2024) · Journal of Advanced Research in Applied Sciences and Engineering Technology · doi:10.37934/araset.63.1.244256 · Cited by 2
“It can also use as a combination of the analytical hierarchy process and geographic information system and HMA (Hierarchical Multi-criterion Analysis), offering a low-cost methodology to produce vulnerability maps [13,14].”
MethodBansal, K., Nath, A., Choudhury, T., & Koley, B. (2025) · Spatial Information Research · doi:10.1007/s41324-025-00650-z · Cited by 3
“In this context a recent researchers Swain et al. [ 19 ] has been applied a hybrid method for the catchment area of Bihar, where AHP was performed with the combination of GIS and remote sensing (RS) techniques through the platform of google earth engine (GEE) for preparing the flood haz - ard…”
GIS-BASED ANALYTICAL HIERARCHY PROCESS MODELING FOR FLOOD‑PRONE AREA MAPPING IN VIETNAM
Nguyen, H. D., & Şerban, G. (2022) · Geographia Technica · doi:10.21163/gt_2023.181.05 · Cited by 2
Goswami, A., Sen, S., & Majumder, P. (2023) · Practice, progress, and proficiency in sustainability · doi:10.4018/978-1-6684-8223-0.ch005 · Cited by 1
Pavithra, B. S., Gururaj, P., & Pathak, A. A. (2023) · IEEE India Geoscience and Remote Sensing Symposium (InGARSS) · doi:10.1109/ingarss59135.2023.10490352 · Cited by 1
Sukmawati, A. M., Utomo, P., & Nuansyah, A. (2024) · AIP conference proceedings · doi:10.1063/5.0210304 · Cited by 1
-, S. R. L., & -, H. M. R. G. (2024) · International Journal For Multidisciplinary Research · doi:10.36948/ijfmr.2024.v06i03.23538 · Cited by 2
Scaling Up Study Area Size in Flood Susceptibility Mapping
Mundayatt, A., & Sreevalsan‐Nair, J. (2024) · IEEE International Geoscience and Remote Sensing Symposium (IGARSS) · doi:10.1109/igarss53475.2024.10640798 · Cited by 1
“Statistical methods, such as Bivariate and Multivariate Analysis, efficiently handle large datasets but may oversimplify the dynamics of flood susceptibility due to their linear assumptions [3].”
MethodImpact-Based Forecasting (IBF) untuk Mendukung Manajemen Risiko Banjir di Kawasan Jabodetabek
Dhuha, M. A. S., Saputra, A. H., Kristianto, A., & Mulya, A. (2024) · Jurnal Ilmu Lingkungan · doi:10.14710/jil.22.5.1159-1173 · Cited by 3
Sheikh, S., Roslan, S. N. A., & Shafri, H. Z. M. (2024) · IOP Conference Series Earth and Environmental Science · doi:10.1088/1755-1315/1412/1/012012 · Cited by 1
Rathod, N., & Ukey, M. S. (2025) · Journal of the Indian Society of Remote Sensing · doi:10.1007/s12524-025-02304-x · Cited by 1
Mapping flood vulnerability in Wasit province, Iraq, using enhanced AHP-GIS techniques
Abood, R. H., Hameed, I. A., & Alrikabi, A. S. (2025) · IOP Conference Series Earth and Environmental Science · doi:10.1088/1755-1315/1543/1/012002 · Cited by 1
“Subsequently, the Weighted Linear Combination (WLC) method was applied within a GIS environment to integrate the standardized thematic layers and generate the final flood susceptibility zones[9].”
Dar, H. M. U. D., Bhat, D. M., & Mir, K. H. (2025) · Journal of the Indian Society of Remote Sensing · doi:10.1007/s12524-025-02340-7 · Cited by 1
“A total of 10 key variables were selected based on their influence on flood occurrence, categorized as topographic, climatic, soil, and vegetation factors (Swain et al., 2020 ).”
Farzad, R., Sharafati, A., & Kheyruri, Y. (2025) · Acta Geophysica · doi:10.1007/s11600-025-01769-1 · Cited by 2
“In the same year, Swain et al. (2020) investigated the flood sensitivity map by the GIS_AHP method employing the cloud computing API.”
Adaptation and mitigation actions for flood management.
Delgado-Moreira, M. I., & Bowen, J. R. (2024) · Visions for Sustainability · doi:10.13135/2384-8677/10345 · Cited by 1
A GIS-enabled AHP approach for mapping urban flood susceptibility in Bhubaneswar city
Panigrahi, M., Pal, S., & Sharma, A. (2026) · AIMS Geosciences · doi:10.3934/geosci.2026005 · Cited by 1
Dana, E., Tesfamariam, S., & Govindu, V. (2026) · Scientific African · doi:10.1016/j.sciaf.2026.e03312 · Cited by 1
Rasul, N., Debnath, J., Sahariah, D., Lahon, D., & Dutta, P. (2026) · Journal of Sustainable Forestry · doi:10.1080/10549811.2026.2646682 · Cited by 1
“The process begins with the construction of a hierarchical structure through pair-wise comparisons using the Saaty’s scale for consistency (Swain et al., 2020).”
Neshat, A., Paryani, S., & Javadi, S. (2026) · Environmental Challenges · doi:10.1016/j.envc.2026.101483 · Cited by 1
Subbulakshmi, M., & Nanda, S. (2026) · Journal of the Indian Society of Remote Sensing · doi:10.1007/s12524-026-02479-x · Cited by 2
“Proximity of a river serves as a primary flood routes, for surrounding lands to that river (Shaikh et al., 2024; Swain et al., 2020 ).”
Flood Risk Mapping in Batu Pahat Using GIS and Analytic Hierarchy Process
Zainudin, M. A. A., Abdullah, M. A. A., Abdullah, N. M., Him, N. C., & Sufahani, S. F. (2026) · Jurnal RESTI (Rekayasa Sistem dan Teknologi Informasi) · doi:10.29207/resti.v10i2.6644 · Cited by 1
Metadata
- Authors
- Swain, K. C., Singha, C., & Nayak, L.
- Affiliations
- Visva-Bharati University (IN)
- ICAR-NINFET, 12 Regent Park, Kolkata 700040, India
- Corresponding author
- Swain, Kishore Chandra
- Venue
- ISPRS International Journal of Geo-Information
- Publisher
- MDPI AG
- Published
- 2020-12-02
- Volume
- 9
- Issue
- 12
- Pages
- 720
- ISSN
- 2220-9964 (ISSN-L)
- OpenAlex
- W3109806479
- Cited by
- 273
- References
- 55
- Citations by year
- 2026: 61 · 2025: 64 · 2024: 52 · 2023: 46 · 2022: 36 · 2021: 13 · 2020: 1
- FWCI
- 8.65
- Type
- journal article
- Language
- en
- Open access
- gold
- doi.org
- Licence
- Locations
- ISPRS International Journal of Geo-Information (publishedVersion, cc-by)
- DOAJ (DOAJ: Directory of Open Access Journals) (submittedVersion, cc-by-sa)
- Topics
- Physical Sciences › Environmental Science › Global and Planetary Change › Flood Risk Assessment and Management
- Physical Sciences › Environmental Science › Environmental Engineering › Groundwater and Watershed Analysis
- Physical Sciences › Environmental Science › Management, Monitoring, Policy and Law › Landslides and related hazards
- Keywords
- flood susceptibility mapping, flood risk areas, multi-criteria decision support system, analytic hierarchy process, Google Earth Engine, cloud computing, human disturbance, land cover dynamics, river proximity
About these checks
Registry, retraction, Cites and statistics results are computed, not judged, with one exception: a printed reference that no index lists is read once by a model before it counts as a citation error. Claims are extracted by a model and kept only when their quote appears verbatim in the text; each cited source is then checked, with a model’s help, for whether it says what the claim relies on. Those verdicts can be wrong — read the claim’s quote and the cited source before relying on one.
Statistics and arithmetic are recomputed, not judged.
Confidence bands are shown only for fields calibrated on our annotated test set. None is calibrated yet, so no band is shown.
What counts as a claim ›How we measure confidence ›How we check this ›
Are you an author, or do you see a problem with this page? Request a review
Data sources
Bibliographic data: Semantic Scholar, OpenAlex, Crossref.
Contains information from the Semantic Scholar Academic Graph Datasets, made available under the ODC Attribution License (ODC-BY 1.0).
Semantic Scholar’s data is described in: Kinney, R., et al. (2023). The Semantic Scholar Open Data Platform. arXiv:2301.10140.
