

The DOI matches its Crossref record; 39 of the 39 references it cites were found in a registry or an index.
Existence of SARS-CoV-2 Entry Molecules in the Oral Cavity
Open accessAbstract
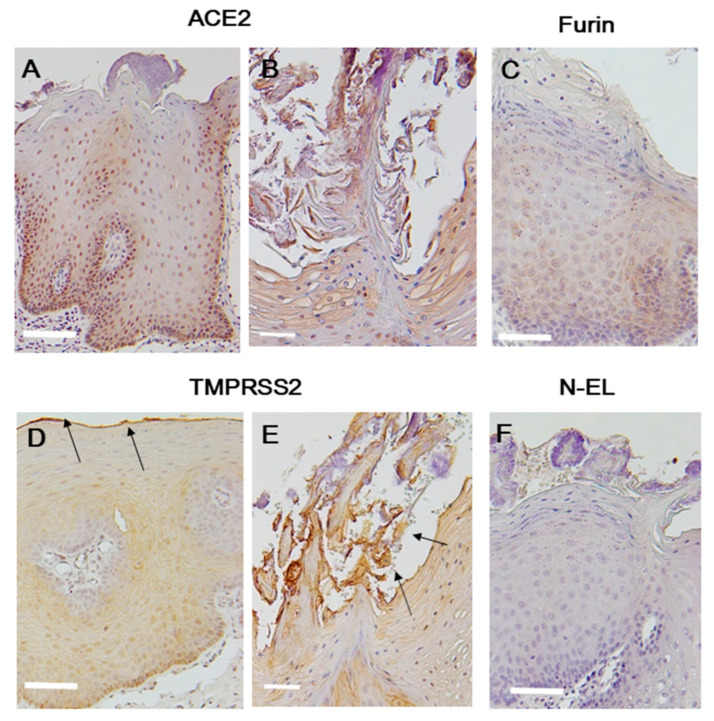
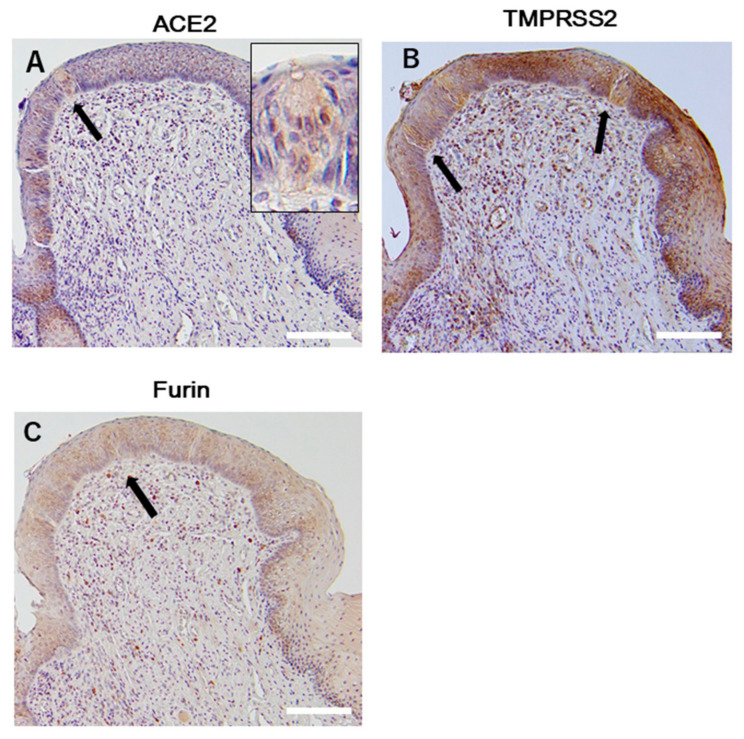
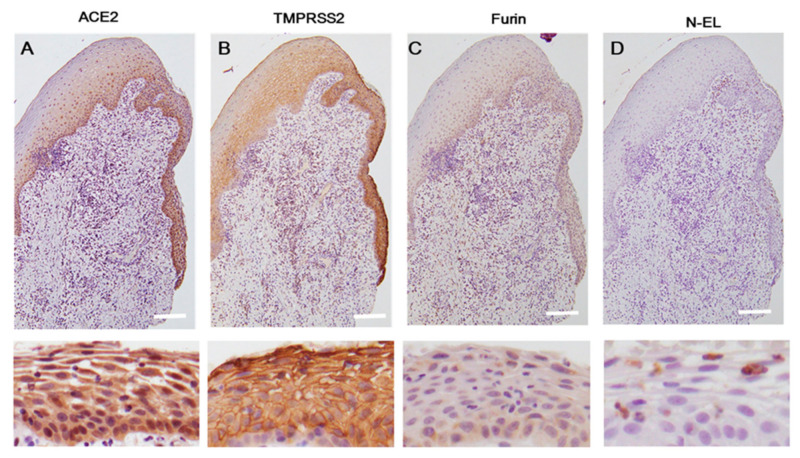
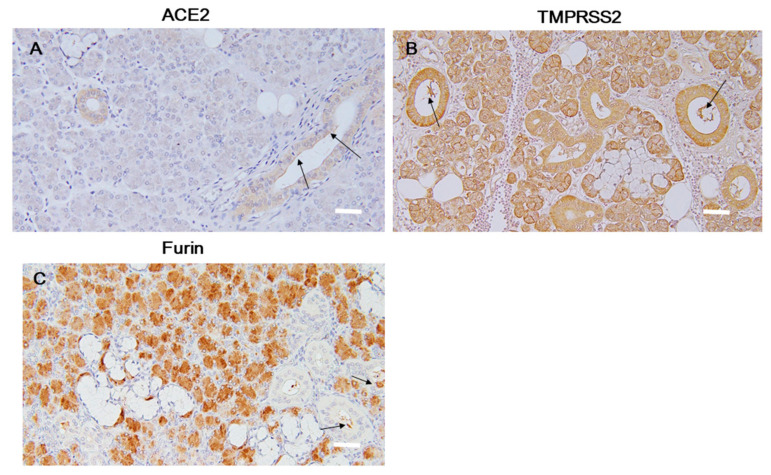
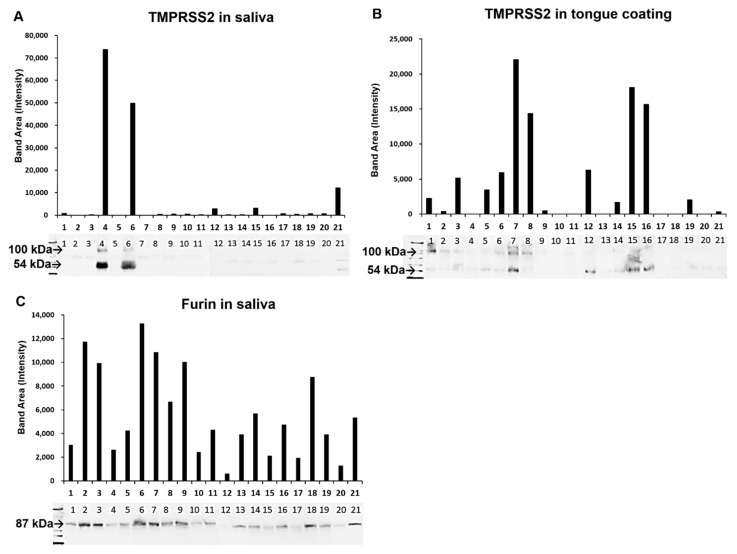
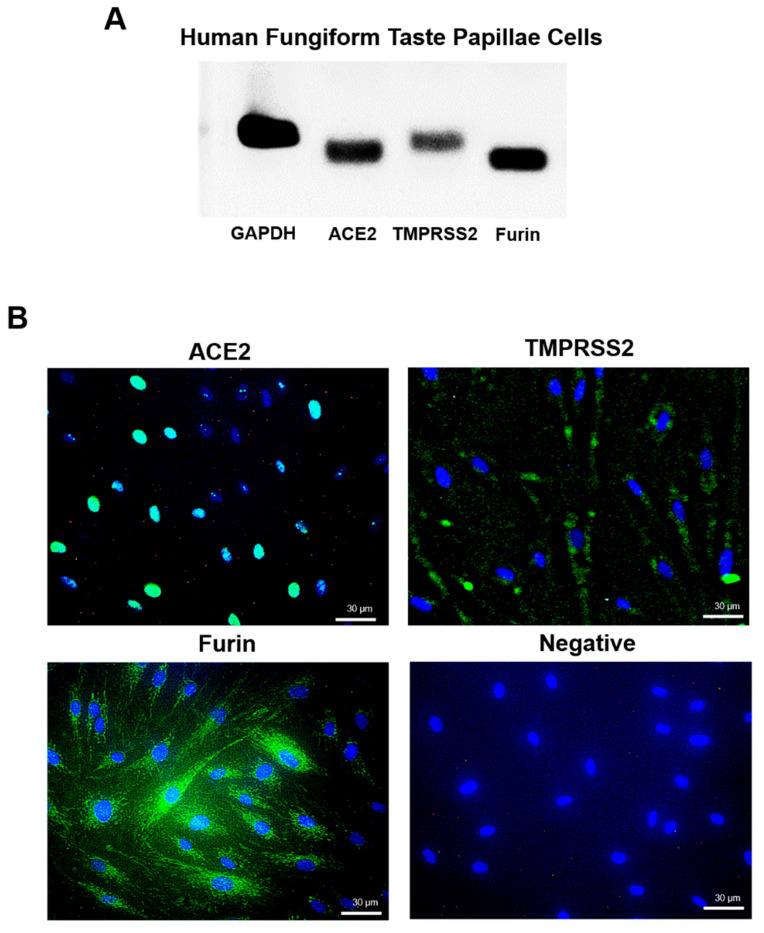
The severe acute respiratory syndrome coronavirus 2 (SARS-CoV-2) receptor, angiotensin-converting enzyme 2 (ACE2), transmembrane protease serine 2 (TMPRSS2), and furin, which promote entry of the virus into the host cell, have been identified as determinants of SARS-CoV-2 infection. Dorsal tongue and gingiva, saliva, and tongue coating samples were examined to determine the presence of these molecules in the oral cavity. Immunohistochemical analyses showed that ACE2 was expressed in the stratified squamous epithelium of the dorsal tongue and gingiva. TMPRSS2 was strongly expressed in stratified squamous epithelium in the keratinized surface layer and detected in the saliva and tongue coating samples via Western blot. Furin was localized mainly in the lower layer of stratified squamous epithelium and detected in the saliva but not tongue coating. ACE2, TMPRSS2, and furin mRNA expression was observed in taste bud-derived cultured cells, which was similar to the immunofluorescence observations. These data showed that essential molecules for SARS-CoV-2 infection were abundant in the oral cavity. However, the database analysis showed that saliva also contains many protease inhibitors. Therefore, although the oral cavity may be the entry route for SARS-CoV-2, other factors including protease inhibitors in the saliva that inhibit viral entry should be considered.
Overview
The claims and statistics of this paper haven’t been checked yet.
Run the check — free, no account needed. It reads the open-access text and checks the sources it cites.
Integrity signals
Registry
Cites
Statistics
Figures
Verification
Claims the paper makes
The claims and statistics of this paper haven’t been checked yet.
Run the check — free, no account needed. It reads the open-access text and checks the sources it cites.
Claims other papers make about this one
Each is checked against this paper’s own text: does it say what the citing paper says it does?
In the citing paper
“Within the oral cavity, there is little evidence for expression of ACE2, TMPRSS2, or Furin on any other cells than epithelial cells (Sakaguchi et al., 2020).”
From COVID-19 and the human innate immune system (2021) · cites this paper as Sakaguchi et al., 2020
Self-check
Percentages, sums and reported differences re-computed from the paper’s own numbers.
The self-check needs the paper’s full text.
Citations
Cites
Lu, R., Zhao, X., Li, J., Niu, P., Yang, B., Wu, H., Wang, W., Song, H., Huang, B., Zhu, N., et al. (2020) · The Lancet · doi:10.1016/s0140-6736(20)30251-8 · Cited by 11,907
Hamming, I., Timens, W., Bulthuis, M., Lely, A., Navis, G., & van Goor, H. (2004) · The Journal of Pathology · doi:10.1002/path.1570 · Cited by 5,676
High expression of ACE2 receptor of 2019-nCoV on the epithelial cells of oral mucosa
Xu, H., Zhong, L., Deng, J., Peng, J., Dan, H., Zeng, X., Li, T., & Chen, Q. (2020) · International Journal of Oral Science · doi:10.1038/s41368-020-0074-x · Cited by 2,838
Coutard, B., Valle, C., de Lamballerie, X. N., Canard, B., Seidah, N. G., & Decroly, É. (2020) · Antiviral Research · doi:10.1016/j.antiviral.2020.104742 · Cited by 1,706
Bourgonje, A. R., Abdulle, A. E., Timens, W., Hillebrands, J., Navis, G. J., Gordijn, S. J., Bolling, M. C., Dijkstra, G. D. H., Voors, A. A., Osterhaus, A. D. M. E., et al. (2020) · The Journal of Pathology · doi:10.1002/path.5471 · Cited by 1,160
Forner, L. E., Larsen, T. E., Kilian, M., & Holmstrup, P. (2006) · Journal Of Clinical Periodontology · doi:10.1111/j.1600-051x.2006.00924.x · Cited by 769
Yan, C. H., Faraji, F., Prajapati, D. P., Boone, C. E., & DeConde, A. S. (2020) · International Forum of Allergy & Rhinology · doi:10.1002/alr.22579 · Cited by 754 · cited 13×
“The expression of ACE2 in the taste buds remains unclear, although taste impairment has received particular attention as a symptom of COVID-19 [5].”
BackgroundInfluentialShi, Y., Wang, G., Cai, X.-P., Deng, J.-W., Zheng, L., Zhu, H.-H., Zheng, M., Yang, B., & Chen, Z. (2020) · Journal of Zhejiang University SCIENCE B · doi:10.1631/jzus.b2000083 · Cited by 638
Kawase, M., Shirato, K., van der Hoek, L., Taguchi, F., & Matsuyama, S. (2012) · Journal of Virology · doi:10.1128/jvi.00094-12 · Cited by 517
Böttcher, E., Matrosovich, T. Y., Beyerle, M., Klenk, H., Garten, W., & Matrosovich, M. N. (2006) · Journal of Virology · doi:10.1128/jvi.01118-06 · Cited by 490
Cited by
Sorted by citations
COVID-19 and the human innate immune system
Schultze, J. L., & Aschenbrenner, A. C. (2021) · Cell · doi:10.1016/j.cell.2021.02.029 · Cited by 714
SARS-CoV-2 infects and replicates in cells of the human endocrine and exocrine pancreas
Müller, J. A., Groß, R. M., Conzelmann, C., Krüger, J., Merle, U., Steinhart, J., Weil, T., Koepke, L., Bozzo, C. P., Read, C., et al. (2021) · Nature Metabolism · doi:10.1038/s42255-021-00347-1 · Cited by 564
Nasal ciliated cells are primary targets for SARS-CoV-2 replication in the early stage of COVID-19
Ahn, J. H., Kim, J., Hong, S. P., Choi, S. Y., Yang, M. J., Ju, Y. S., Kim, Y. T., Kim, H. M., Rahman, M. T., Chung, M. K., et al. (2021) · Journal of Clinical Investigation · doi:10.1172/jci148517 · Cited by 295
Covid‐19 and oral diseases: Crosstalk, synergy or association?
Brandini, D. A., Takamiya, A. S., Thakkar, P., Schaller, S. J., Rahat, R., & Naqvi, A. R. (2021) · Reviews in Medical Virology · doi:10.1002/rmv.2226 · Cited by 120
Novel impacts of saliva with regard to oral health
Uchida, H., & Ovitt, C. E. (2021) · Journal of Prosthetic Dentistry · doi:10.1016/j.prosdent.2021.05.009 · Cited by 96
Metadata
- Authors
- Sakaguchi, W., Kubota, N., Shimizu, T., Saruta, J., Fuchida, S., Kawata, A., Yamamoto, Y., Sugimoto, M., Yakeishi, M., & Tsukinoki, K.
- Affiliations
- Kanagawa Dental University (JP)
- Kanagawa Dental University Junior College (JP)
- Tokyo Medical University (JP)
- Corresponding author
- Saruta, Juri
- ORCID
- Venue
- International Journal of Molecular Sciences
- Publisher
- MDPI AG
- Published
- 2020-08-20
- Volume
- 21
- Issue
- 17
- Pages
- 6000
- ISSN
- 1422-0067 (ISSN-L)
- PMC
- PMC7503451
- OpenAlex
- W3078858731
- Cited by
- 200
- References
- 38
- Citations by year
- 2026: 8 · 2025: 14 · 2024: 19 · 2023: 45 · 2022: 45 · 2021: 66 · 2020: 3
- FWCI
- 5.21
- Type
- journal article
- Language
- en
- Open access
- gold
- doi.org
- Licence
- Locations
- International Journal of Molecular Sciences (publishedVersion, cc-by)
- PubMed Central (publishedVersion, cc-by)
- PubMed (publishedVersion)
- DOAJ (DOAJ: Directory of Open Access Journals) (submittedVersion, cc-by-sa)
- Funders
- Japan Society for the Promotion of Science (20H05743, 19K10427, 18K17035)
- Topics
- Health Sciences › Medicine › Infectious Diseases › SARS-CoV-2 and COVID-19 Research
- Health Sciences › Dentistry › General Dentistry › Dental Research and COVID-19
- Health Sciences › Medicine › Dermatology › Dermatological and COVID-19 studies
- Keywords
- SARS-CoV-2, ACE2, TMPRSS2, furin, viral entry, oral cavity, tongue, gingiva, saliva, tongue coating, stratified squamous epithelium, taste buds, protease inhibitors, COVID-19 pandemic
- MeSH terms
- Betacoronavirus, Angiotensin-Converting Enzyme 2, COVID-19, SARS-CoV-2, Gingiva, Humans, Peptidyl-Dipeptidase A, Mouth Mucosa, Pneumonia, Viral, Saliva, Serine Endopeptidases, Tongue, Coronavirus Infections, Furin, Virus Internalization, Pandemics, Spike Glycoprotein, Coronavirus
About these checks
Registry, retraction, Cites and statistics results are computed, not judged, with one exception: a printed reference that no index lists is read once by a model before it counts as a citation error. Claims are extracted by a model and kept only when their quote appears verbatim in the text; each cited source is then checked, with a model’s help, for whether it says what the claim relies on. Those verdicts can be wrong — read the claim’s quote and the cited source before relying on one.
Statistics and arithmetic are recomputed, not judged.
Confidence bands are shown only for fields calibrated on our annotated test set. None is calibrated yet, so no band is shown.
What counts as a claim ›How we measure confidence ›How we check this ›
Are you an author, or do you see a problem with this page? Request a review
