

The DOI matches its Crossref record; 84 of the 84 references it cites were found in a registry or an index.
Unravelling the Adaptation Mechanisms to High Pressure in Proteins
Open accessPublished version of a preprint
Abstract
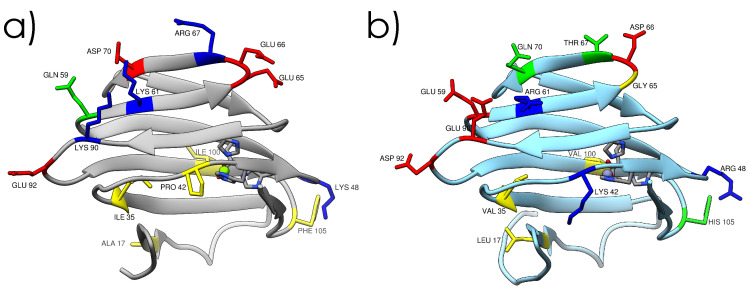
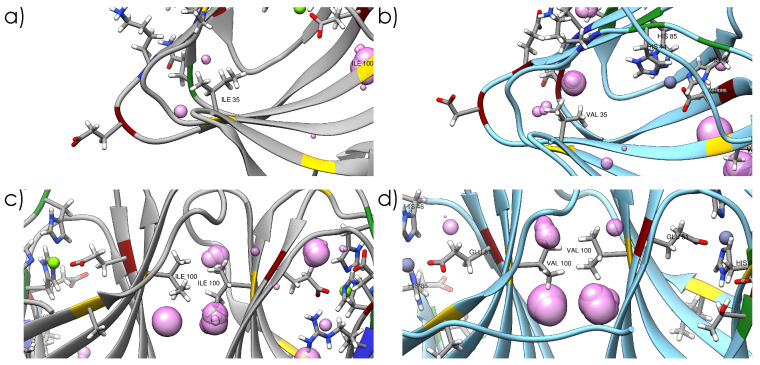
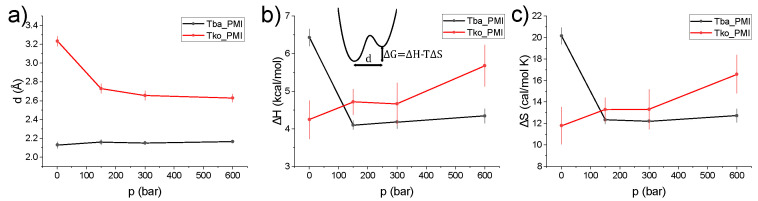
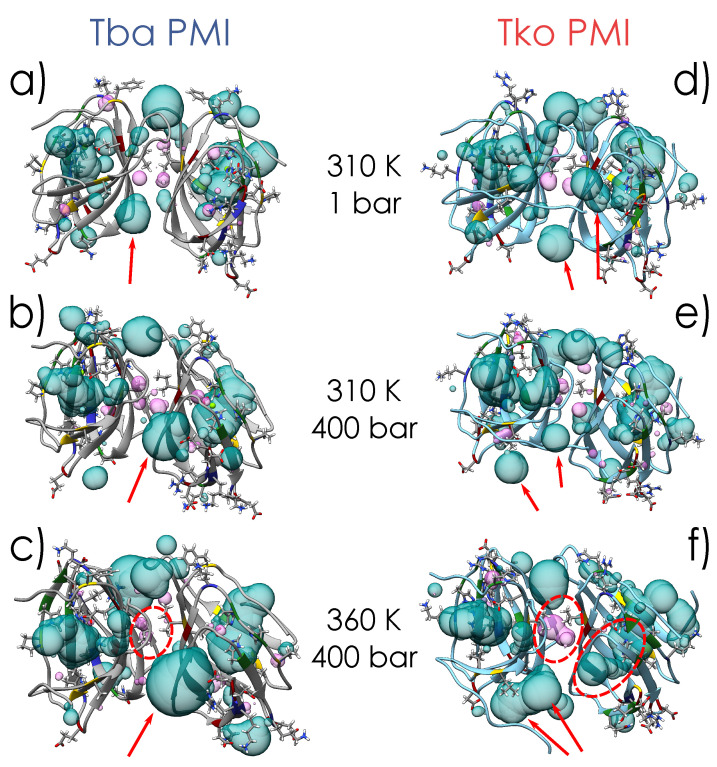
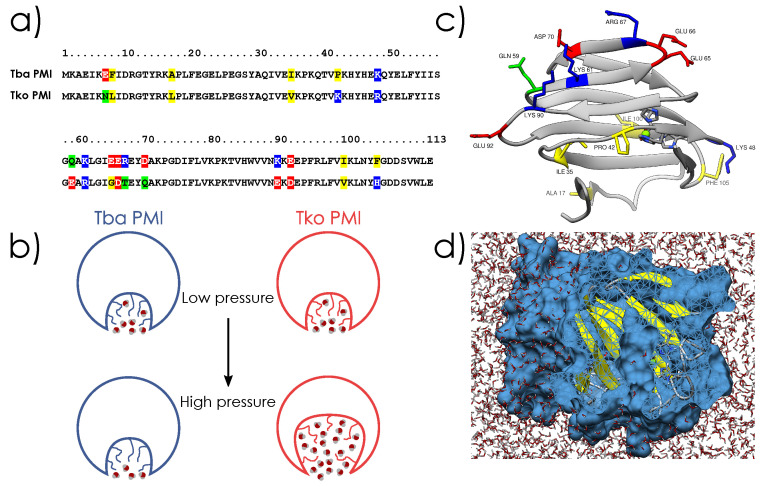
Life is thought to have appeared in the depth of the sea under high hydrostatic pressure. Nowadays, it is known that the deep biosphere hosts a myriad of life forms thriving under high-pressure conditions. However, the evolutionary mechanisms leading to their adaptation are still not known. Here, we show the molecular bases of these mechanisms through a joint structural and dynamical study of two orthologous proteins. We observed that pressure adaptation involves the decoupling of protein–water dynamics and the elimination of cavities in the protein core. This is achieved by rearranging the charged residues on the protein surface and using bulkier hydrophobic residues in the core. These findings will be the starting point in the search for a complete genomic model explaining high-pressure adaptation.
Overview
The claims and statistics of this paper haven’t been checked yet.
Run the check — free, no account needed. It reads the open-access text and checks the sources it cites.
Integrity signals
Registry
Cites
Statistics
Figures
Verification
Claims the paper makes
The claims and statistics of this paper haven’t been checked yet.
Run the check — free, no account needed. It reads the open-access text and checks the sources it cites.
Self-check
Percentages, sums and reported differences re-computed from the paper’s own numbers.
The self-check needs the paper’s full text.
Citations
Cites
VMD: visual molecular dynamics
Humphrey, W., Dalke, A., & Schulten, K. (1996) · Journal of Molecular Graphics · doi:10.1016/0263-7855(96)00018-5 · Cited by 66,952
UCSF Chimera—A visualization system for exploratory research and analysis
Pettersen, E. F., Goddard, T. D., Huang, C. C., Couch, G. S., Greenblatt, D. M., Meng, E. C., & Ferrin, T. E. (2004) · Journal of Computational Chemistry · doi:10.1002/jcc.20084 · Cited by 45,828
Highly accurate protein structure prediction with AlphaFold
Jumper, J., Evans, R., Pritzel, A., Green, T., Figurnov, M., Ronneberger, O., Tunyasuvunakool, K., Bates, R., Žídek, A., Potapenko, A., et al. (2021) · Nature · doi:10.1038/s41586-021-03819-2 · Cited by 43,764
Features and development of Coot
Emsley, P., Lohkamp, B., Scott, W. G., & Cowtan, K. (2010) · Acta Crystallographica Section D Biological Crystallography · doi:10.1107/s0907444910007493 · Cited by 29,915
Phaser crystallographic software
McCoy, A. J., Grosse-Kunstleve, R. W., Adams, P. D., Winn, M. D., Storoni, L. C., & Read, R. J. (2007) · Journal of Applied Crystallography · doi:10.1107/s0021889807021206 · Cited by 20,612
Kabsch, W. (2010) · Acta Crystallographica Section D Biological Crystallography · doi:10.1107/s0907444909047337 · Cited by 16,463
SWISS-MODEL: homology modelling of protein structures and complexes
Waterhouse, A., Bertoni, M., Bienert, S., Studer, G., Tauriello, G., Gumienny, R., Heer, F. T., de Beer, T. A. P., Rempfer, C., Bordoli, L., et al. (2018) · Nucleic Acids Research · doi:10.1093/nar/gky427 · Cited by 13,067
CHARMM‐GUI: A web‐based graphical user interface for CHARMM
Jo, S., Kim, T., Iyer, V. G., & Im, W. (2008) · Journal of Computational Chemistry · doi:10.1002/jcc.20945 · Cited by 9,284
Liebschner, D., Afonine, P. V., Baker, M. L., Bunkóczi, G., Chen, V. B., Croll, T. I., Hintze, B., Hung, L.-W., Jain, S., McCoy, A. J., et al. (2019) · Acta Crystallographica Section D Structural Biology · doi:10.1107/s2059798319011471 · Cited by 7,953
Use of bacteriophage T7 RNA polymerase to direct selective high-level expression of cloned genes
Studier, F. W., & Moffatt, B. A. (1986) · Journal of Molecular Biology · doi:10.1016/0022-2836(86)90385-2 · Cited by 6,405
The I-TASSER Suite: protein structure and function prediction
Yang, J., Yan, R., Roy, A., Xu, D., Poisson, J., & Zhang, Y. (2015) · Nature Methods · doi:10.1038/nmeth.3213 · Cited by 5,596
Towards automated crystallographic structure refinement with phenix.refine
Afonine, P. V., Grosse-Kunstleve, R. W., Echols, N., Headd, J. J., Moriarty, N. W., Mustyakimov, M., Terwilliger, T. C., Urzhumtsev, A., Zwart, P. H., & Adams, P. D. (2012) · Acta Crystallographica Section D Biological Crystallography · doi:10.1107/s0907444912001308 · Cited by 5,511
Constant pressure molecular dynamics simulation: The Langevin piston method
Feller, S. E., Zhang, Y., Pastor, R. W., & Brooks, B. R. (1995) · The Journal of Chemical Physics · doi:10.1063/1.470648 · Cited by 4,398
Neutron scattering lengths and cross sections
Sears, V. F. (1992) · Neutron News · doi:10.1080/10448639208218770 · Cited by 3,835
Tabor, S., & Richardson, C. C. (1985) · Proceedings of the National Academy of Sciences · doi:10.1073/pnas.82.4.1074 · Cited by 3,148
Scalable molecular dynamics on CPU and GPU architectures with NAMD
Phillips, J. C., Hardy, D. J., Maia, J. D. C., Stone, J. E., Ribeiro, J. V., Bernardi, R. C., Buch, R., Fiorin, G., Hénin, J., Jiang, W., et al. (2020) · The Journal of Chemical Physics · doi:10.1063/5.0014475 · Cited by 3,144
Correlations in Space and Time and Born Approximation Scattering in Systems of Interacting Particles
Hove, L. V. (1954) · Physical Review · doi:10.1103/physrev.95.249 · Cited by 2,845
CASTp 3.0: computed atlas of surface topography of proteins
Tian, W., Chen, C., Lei, X., Zhao, J., & Liang, J. (2018) · Nucleic Acids Research · doi:10.1093/nar/gky473 · Cited by 2,389
CASTp: Computed Atlas of Surface Topography of proteins
Binkowski, T. A. (2003) · Nucleic Acids Research · doi:10.1093/nar/gkg512 · Cited by 1,693
Hydrothermal vents and the origin of life
Martin, W., Baross, J., Kelley, D., & Russell, M. J. (2008) · Nature Reviews Microbiology · doi:10.1038/nrmicro1991 · Cited by 1,608
REFMAC 5 dictionary: organization of prior chemical knowledge and guidelines for its use
Vagin, A. A., Steiner, R. A., Lebedev, A. A., Potterton, L., McNicholas, S., Long, F., & Murshudov, G. N. (2004) · Acta Crystallographica Section D Biological Crystallography · doi:10.1107/s0907444904023510 · Cited by 1,350
Dynamical transition of myoglobin revealed by inelastic neutron scattering
Doster, W., Cusack, S., & Petry, W. (1989) · Nature · doi:10.1038/337754a0 · Cited by 1,142
Conformational Substates In Proteins
Frauenfelder, H., Parak, F., & Young, R. D. (1988) · Annual Review of Biophysics and Biophysical Chemistry · doi:10.1146/annurev.bb.17.060188.002315 · Cited by 1,009
Neutron Scattering from a Liquid on a Jump Diffusion Model
Chudley, C. T., & Elliott, R. J. (1961) · Proceedings of the Physical Society · doi:10.1088/0370-1328/77/2/319 · Cited by 737
How Soft Is a Protein? A Protein Dynamics Force Constant Measured by Neutron Scattering
Zaccai, G. (2000) · Science · doi:10.1126/science.288.5471.1604 · Cited by 733
Ortega, Á., Amorós, D., & de la Torre, J. G. (2011) · Biophysical Journal · doi:10.1016/j.bpj.2011.06.046 · Cited by 664
Reversible pressure-temperature denaturation of chymotrypsinogen
Hawley, S. A. (1971) · Biochemistry · doi:10.1021/bi00789a002 · Cited by 602
Diffusive Motions in Water and Cold Neutron Scattering
Singwi, K. S., & Sjölander, A. (1960) · Physical Review · doi:10.1103/physrev.119.863 · Cited by 597
Analysis and Visualisation of Neutron-Scattering Data
Richard, D., Ferrand, M., & Kearley, G. J. (1996) · Journal of Neutron Research · doi:10.1080/10238169608200065 · Cited by 434
Observation of fragile-to-strong dynamic crossover in protein hydration water
Chen, S.-H., Liu, L., Fratini, E., Baglioni, P., Faraone, A., & Mamontov, E. (2006) · Proceedings of the National Academy of Sciences · doi:10.1073/pnas.0602474103 · Cited by 433
Fukui, T., Atomi, H., Kanai, T., Matsumi, R., Fujiwara, S., & Imanaka, T. (2005) · Genome Research · doi:10.1101/gr.3003105 · Cited by 425
Revisiting volume changes in pressure-induced protein unfolding
Royer, C. A. (2002) · Biochimica et Biophysica Acta (BBA) - Protein Structure and Molecular Enzymology · doi:10.1016/s0167-4838(01)00344-2 · Cited by 413
Cavities determine the pressure unfolding of proteins
Roche, J., Caro, J. A., Norberto, D. R., Barthe, P., Roumestand, C., Schlessman, J. L., Garcia, A. E., García-Moreno E., B., & Royer, C. A. (2012) · Proceedings of the National Academy of Sciences · doi:10.1073/pnas.1200915109 · Cited by 385
Self-citationSubmarine hot springs and the origin of life
Miller, S. L., & Bada, J. L. (1988) · Nature · doi:10.1038/334609a0 · Cited by 338 · cited 1×
“According to one of the most credited hypotheses on the origins of life, it appeared in the deep sea [1], protected from the deleterious radiation of the young sun, but close to energy sources (e.”
BackgroundA habitat for psychrophiles in deep Antarctic ice
Price, P. B. (2000) · Proceedings of the National Academy of Sciences · doi:10.1073/pnas.97.3.1247 · Cited by 330
Frauenfelder, H., Alberding, N., Ansari, A., Braunstein, D., Cowen, B. R., Hong, M. K., Iben, I. E. T., Johnson, J. B., & Luck, S. (1990) · The Journal of Physical Chemistry · doi:10.1021/j100366a002 · Cited by 278
Onsets of Anharmonicity in Protein Dynamics
Roh, J. H., Novikov, V. N., Gregory, R. B., Curtis, J. E., Chowdhuri, Z., & Sokolov, A. P. (2005) · Physical Review Letters · doi:10.1103/physrevlett.95.038101 · Cited by 250
Marteinsson, V., Birrien, J., Reysenbach, A., Vernet, M., Marie, D., Gambacorta, A., Messner, P., Sleytr, U. B., & Prieur, D. (1999) · INTERNATIONAL JOURNAL OF SYSTEMATIC AND EVOLUTIONARY MICROBIOLOGY · doi:10.1099/00207713-49-2-351 · Cited by 223
Origin of the Vogel–Fulcher–Tammann law in glass-forming materials: the α–β bifurcation
Rault, J. (2000) · Journal of Non-Crystalline Solids · doi:10.1016/s0022-3093(00)00099-5 · Cited by 219
Incoherent neutron scattering functions for random jump diffusion in bounded and infinite media
Hall, P. L., & Ross, D. K. (1981) · Molecular Physics · doi:10.1080/00268978100100521 · Cited by 211
Strong and fragile glasses: A powerful classification and its consequences
Vilgis, T. A. (1993) · Physical review. B, Condensed matter · doi:10.1103/physrevb.47.2882 · Cited by 198
Theoretical basis for the Vogel-Fulcher-Tammann equation
Garc�a-Col�n, L. S., del Castillo, L. F., & Goldstein, P. (1989) · Physical review. B, Condensed matter · doi:10.1103/physrevb.40.7040 · Cited by 194
Cinar, H., Fetahaj, Z., Cinar, S., Vernon, R. M., Chan, H. S., & Winter, R. (2019) · Chemistry - A European Journal · doi:10.1002/chem.201902210 · Cited by 187
Bowler, M. W., Nurizzo, D., Barrett, R., Beteva, A., Bodin, M., Caserotto, H., Delageniere, S., Dobias, F., Flot, D. M., Giraud, T., et al. (2015) · Journal of Synchrotron Radiation · doi:10.1107/s1600577515016604 · Cited by 178
Protein Flexibility from the Dynamical Transition:A Force Constant Analysis
Bicout, D., & Zaccaı̈, G. (2001) · Biophysical Journal · doi:10.1016/s0006-3495(01)76089-4 · Cited by 128
Auerbach, G., Ostendorp, R., Prade, L., Korndörfer, I. P., Dams, T., Huber, R., & Jaenicke, R. (1998) · Structure · doi:10.1016/s0969-2126(98)00078-1 · Cited by 121
Fully automatic characterization and data collection from crystals of biological macromolecules
Svensson, O., Monaco, S., Popov, A. N., Nurizzo, D., & Bowler, M. W. (2015) · Acta Crystallographica Section D Biological Crystallography · doi:10.1107/s1399004715011918 · Cited by 119
Density and viscosity of deuterium oxide solutions from 5-70.deg.
Millero, F. J., Dexter, R., & Hoff, E. V. (1971) · Journal of Chemical & Engineering Data · doi:10.1021/je60048a006 · Cited by 116
The Behavior of the Hydrophobic Effect under Pressure and Protein Denaturation
Grigera, J. R., & McCarthy, A. N. (2010) · Biophysical Journal · doi:10.1016/j.bpj.2009.12.4298 · Cited by 115
Protein Compressibility, Dynamics, and Pressure
Kharakoz, D. P. (2000) · Biophysical Journal · doi:10.1016/s0006-3495(00)76313-2 · Cited by 114
The more adaptive to change, the more likely you are to survive: Protein adaptation in extremophiles
Brininger, C. M., Spradlin, S., Cobani, L., & Evilia, C. (2018) · Seminars in Cell and Developmental Biology · doi:10.1016/j.semcdb.2017.12.016 · Cited by 107
Role of the solvent in the dynamical transitions of proteins: The case of the lysozyme-water system
Mallamace, F., Chen, S. H., Broccio, M., Corsaro, C., Crupi, V., Majolino, D., Venuti, V., Baglioni, P., Fratini, E., Vannucci, C., et al. (2007) · The Journal of Chemical Physics · doi:10.1063/1.2757171 · Cited by 103
Combining structure and dynamics: non-denaturing high-pressure effect on lysozyme in solution
Ortore, M. G., Spinozzi, F., Mariani, P., Paciaroni, A., Barbosa, L. R. S., Amenitsch, H. W., Steinhart, M., Ollivier, J., & Russo, D. (2009) · Journal of The Royal Society Interface · doi:10.1098/rsif.2009.0163.focus · Cited by 102
Lagi, M., Chu, X.-Q., Kim, C., Mallamace, F., Baglioni, P., & Chen, S. H. (2008) · The Journal of Physical Chemistry B · doi:10.1021/jp710714j · Cited by 83
Methyl Rotation Barriers in Proteins from 2H Relaxation Data. Implications for Protein Structure
Xue, Y., Pavlova, M. S., Ryabov, Y., Reif, B., & Skrynnikov, N. R. (2007) · Journal of the American Chemical Society · doi:10.1021/ja0702061 · Cited by 76
Meinhold, L., Smith, J. C., Kitao, A., et al. (2007) · Proceedings of the National Academy of Sciences · doi:10.1073/pnas.0708199104 · Cited by 74
Natali, F., Peters, J., Russo, D., Barbieri, S., Chiapponi, C., Cupane, A., Deriu, A., Bari, M. T. D., Farhi, E., Gerelli, Y., et al. (2008) · Neutron News · doi:10.1080/10448630802474083 · Cited by 72
Self-citationVannier, P., Marteinsson, V., Friðjónsson, Ó. H., Oger, P., & Jebbar, M. (2011) · Journal of Bacteriology · doi:10.1128/jb.01490-10 · Cited by 69
Self-citationHydrostatic limits of Fluorinert liquids used for neutron and transport studies at high pressure
Sidorov, V. A., & Sadykov, R. A. (2005) · Journal of Physics Condensed Matter · doi:10.1088/0953-8984/17/40/002 · Cited by 64
Martínez, N., Michoud, G., Cario, A., et al. (2016) · Scientific Reports · doi:10.1038/srep32816 · Cited by 64
Grimaldo, M., Roosen‐Runge, F., Hennig, M., Zanini, F., Zhang, F., Jalarvo, N., Zamponi, M., Schreiber, F., & Seydel, T. (2015) · Physical Chemistry Chemical Physics · doi:10.1039/c4cp04944f · Cited by 63
The Vogel–Fulcher–Tammann law in the elastic theory of glass transition
Trachenko, K. (2008) · Journal of Non-Crystalline Solids · doi:10.1016/j.jnoncrysol.2008.05.021 · Cited by 45
Svensson, O., Gilski, M., Nurizzo, D., & Bowler, M. W. (2018) · Acta Crystallographica Section D Structural Biology · doi:10.1107/s2059798318003728 · Cited by 44
Cario, A., Jebbar, M., Thiel, A., Kervarec, N., & Oger, P. (2016) · Scientific Reports · doi:10.1038/srep29483 · Cited by 43
Self-citationThe New Cold Neutron Time-of-Flight Spectrometer IN5
Ollivier, J., Mutka, H., & Didier, L. (2010) · Neutron News · doi:10.1080/10448631003757573 · Cited by 42
Bowler, M. W., Svensson, O., & Nurizzo, D. (2016) · Crystallography Reviews · doi:10.1080/0889311x.2016.1155050 · Cited by 41
Nurizzo, D., Bowler, M. W., Caserotto, H., Dobias, F., Giraud, T., Surr, J., Guichard, N., Papp, G., Guijarro, M., Mueller‐Dieckmann, C., et al. (2016) · Acta Crystallographica Section D Structural Biology · doi:10.1107/s205979831601158x · Cited by 41
Influence of Pressure and Crowding on the Sub-Nanosecond Dynamics of Globular Proteins
Erlkamp, M., Marion, J., Martínez, N., Czeslik, C., Peters, J., & Winter, R. (2015) · The Journal of Physical Chemistry B · doi:10.1021/acs.jpcb.5b01017 · Cited by 38
Self-citationMetatla, N., & Soldera, A. (2007) · Macromolecules · doi:10.1021/ma071788+ · Cited by 38
Marion, J., Trovaslet, M., Martínez, N., Masson, P., Schweins, R., Nachon, F., Trapp, M., & Peters, J. (2014) · Physical Chemistry Chemical Physics · doi:10.1039/c4cp02992e · Cited by 37
Self-citationEffects of pressure on the dynamics of an oligomeric protein from deep-sea hyperthermophile
Shrestha, U. R., Bhowmik, D., Copley, J. R. D., Tyagi, M., Leão, J. B., & Chu, X.-Q. (2015) · Proceedings of the National Academy of Sciences · doi:10.1073/pnas.1514478112 · Cited by 36
The generalized Vogel-Fulcher-Tamman equation for describing the dynamics of relaxor ferroelectrics
Levit, R., Martinez-Garcia, J. C., Ochoa, D. A., & García, J. E. (2019) · Scientific Reports · doi:10.1038/s41598-019-48864-0 · Cited by 32
Deep Sea Microbes Probed by Incoherent Neutron Scattering Under High Hydrostatic Pressure
Peters, J., Martínez, N., Michoud, G., Cario, A., Franzetti, B., Oger, P., & Jebbar, M. (2014) · Zeitschrift für Physikalische Chemie · doi:10.1515/zpch-2014-0547 · Cited by 30
Self-citationFomina, M., Schirò, G., & Cupane, A. (2013) · Biophysical Chemistry · doi:10.1016/j.bpc.2013.11.004 · Cited by 29
High hydrostatic pressure equipment for neutron scattering studies of samples in solutions
Peters, J., Trapp, M., Hughes, D. J., Rowe, S., Demé, B., Laborier, J.-L., Payre, C., Gonzales, J. M., Baudoin, S., Belkhier, N., et al. (2011) · High Pressure Research · doi:10.1080/08957959.2011.642376 · Cited by 29
Self-citationA derivation of the Vogel–Fulcher–Tammann relation for supercooled liquids
Granato, A. V. (2010) · Journal of Non-Crystalline Solids · doi:10.1016/j.jnoncrysol.2010.08.012 · Cited by 24
Frauenfelder, H., Young, R., & Fenimore, P. W. (2013) · The Journal of Physical Chemistry B · doi:10.1021/jp403832n · Cited by 22
The effects of pressure on the energy landscape of proteins
Librizzi, F., Carrotta, R., Peters, J., & Cupane, A. (2018) · Scientific Reports · doi:10.1038/s41598-018-20417-x · Cited by 21
Self-citationThe Effect of Crowding on Protein Stability, Rigidity, and High Pressure Sensitivity in Whole Cells
Golub, M., Martínez, N., Michoud, G., Ollivier, J., Jebbar, M., Oger, P., & Peters, J. (2018) · Langmuir · doi:10.1021/acs.langmuir.8b01240 · Cited by 21
Self-citationThe first study on the impact of osmolytes in whole cells of high temperature-adapted microorganisms
Salvador‐Castell, M., Golub, M., Martínez, N., Ollivier, J., Peters, J., & Oger, P. (2019) · Soft Matter · doi:10.1039/c9sm01196j · Cited by 18
Self-citationLelièvre-Berna, E., Demé, B., Gonthier, J., Gonzales, J.-P., Maurice, J., Memphis, Y., Payre, C., Oger, P., Peters, J., & Vial, S. (2017) · Journal of Neutron Research · doi:10.3233/jnr-170044 · Cited by 17
Self-citationA comparative anatomy of protein crystals: lessons from the automatic processing of 56 000 samples
Svensson, O., Gilski, M., Nurizzo, D., & Bowler, M. W. (2019) · IUCrJ · doi:10.1107/s2052252519008017 · Cited by 13
High Hydrostatic Pressure–A Key Element to Investigate Molecular Dynamics in Biosystems
Peters, J. (2022) · Frontiers in Physics · doi:10.3389/fphy.2021.801539 · Cited by 7
Self-citationFully Autonomous Characterization and Data Collection from Crystals of Biological Macromolecules
Hutin, S., Laer, B. V., Mueller‐Dieckmann, C., Leonard, G. A., Nurizzo, D., & Bowler, M. W. (2019) · Journal of Visualized Experiments · doi:10.3791/59032 · Cited by 2
Research works printed but not linked: 1
- 1884, Sur un Énoncé gènèral des lois des Équilibres chimiques, C. R. Acad. Sci., 99, 786
Metadata
- Authors
- Caliò, A., Dubois, C., Fontanay, S., Koza, M. M., Hoh, F., Roumestand, C., Oger, P., & Peters, J.
- Affiliations
- Lyon 1 Université (FR)
- Centre National de la Recherche Scientifique (FR)
- Institut Laue-Langevin (FR)
- Corresponding author
- Oger, Philippe
- Peters, Judith
- ORCID
- Venue
- International Journal of Molecular Sciences
- Publisher
- MDPI AG
- Published
- 2022-07-30
- Volume
- 23
- Issue
- 15
- Pages
- 8469
- ISSN
- 1422-0067 (ISSN-L)
- PMC
- PMC9369236
- OpenAlex
- W4289175460
- Cited by
- 12
- References
- 84
- Citations by year
- 2026: 1 · 2025: 3 · 2024: 3 · 2023: 4 · 2022: 1
- FWCI
- 0.90
- Type
- journal article
- Language
- en
- Open access
- gold
- doi.org
- Licence
- Locations
- International Journal of Molecular Sciences (publishedVersion, cc-by)
- bioRxiv (Cold Spring Harbor Laboratory) (acceptedVersion)
- PubMed Central (publishedVersion, cc-by)
- PubMed (publishedVersion)
- HAL (submittedVersion, other-oa)
- HAL (submittedVersion)
- DOAJ (DOAJ: Directory of Open Access Journals) (submittedVersion, cc-by-sa)
- Funders
- French National Research Agency (ANR 17-CE11-0012-01)
- Mission pour les Initiatives Transverses et Interdisciplinaires of the CNRS (ANR 17-CE11-0012-01)
- French Ministry of Science and Technology (ANR 17-CE11-0012-01)
- Topics
- Life Sciences › Biochemistry, Genetics and Molecular Biology › Molecular Biology › Protein Structure and Dynamics
- Life Sciences › Biochemistry, Genetics and Molecular Biology › Structural Biology › Enzyme Structure and Function
- Physical Sciences › Earth and Planetary Sciences › Geophysics › High-pressure geophysics and materials
- Keywords
- high-pressure adaptation, deep-sea fauna, deep biosphere, protein cavities, charged residues, hydrophobic core, protein structure and dynamics, orthologous proteins, adaptive evolution
- MeSH terms
- Acclimatization, Adaptation, Physiological, Hydrostatic Pressure
About these checks
Registry, retraction, Cites and statistics results are computed, not judged, with one exception: a printed reference that no index lists is read once by a model before it counts as a citation error. Claims are extracted by a model and kept only when their quote appears verbatim in the text; each cited source is then checked, with a model’s help, for whether it says what the claim relies on. Those verdicts can be wrong — read the claim’s quote and the cited source before relying on one.
Statistics and arithmetic are recomputed, not judged.
Confidence bands are shown only for fields calibrated on our annotated test set. None is calibrated yet, so no band is shown.
What counts as a claim ›How we measure confidence ›How we check this ›
Are you an author, or do you see a problem with this page? Request a review
Data sources
Bibliographic data: Semantic Scholar, OpenAlex, Crossref.
Contains information from the Semantic Scholar Academic Graph Datasets, made available under the ODC Attribution License (ODC-BY 1.0).
Semantic Scholar’s data is described in: Kinney, R., et al. (2023). The Semantic Scholar Open Data Platform. arXiv:2301.10140.
