

The DOI matches its Crossref record; 4 of the 4 references it cites were found in a registry or an index.
The Solvation of the E. coli CheY Phosphorylation Site Mapped by XFMS
Open accessPublished version of a preprint
Abstract
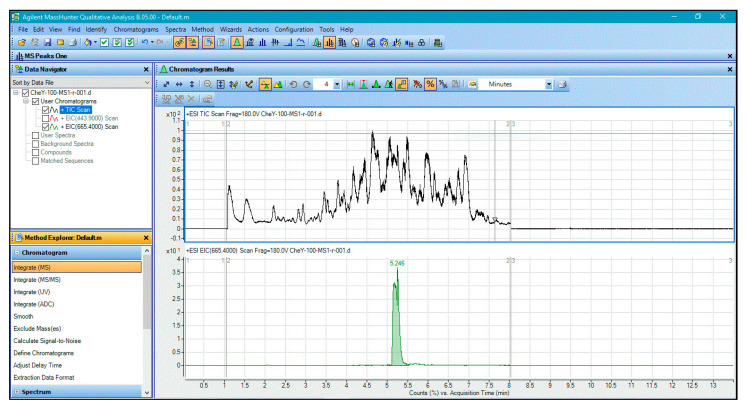
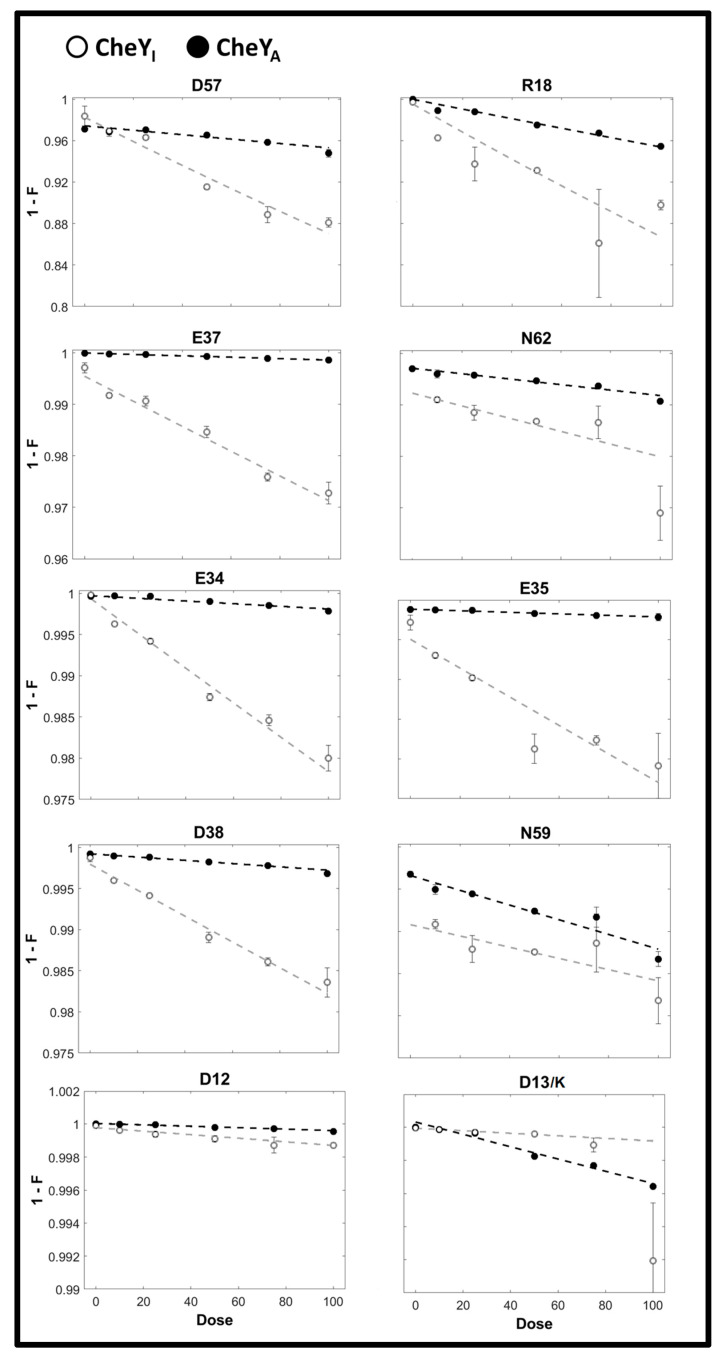
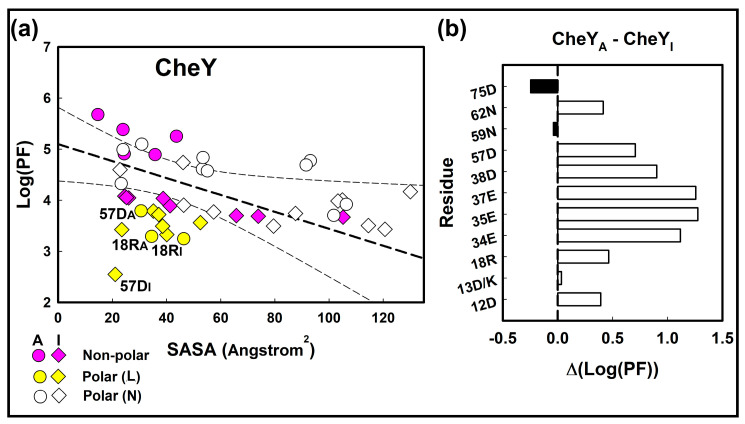
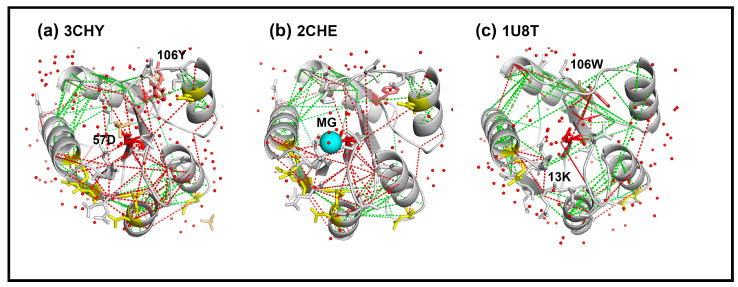
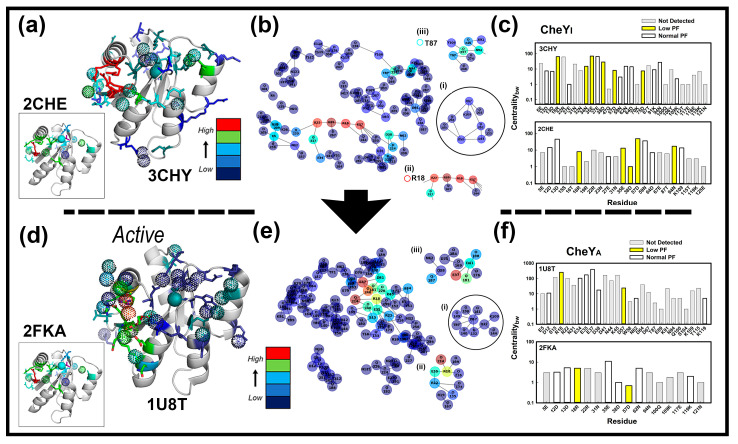
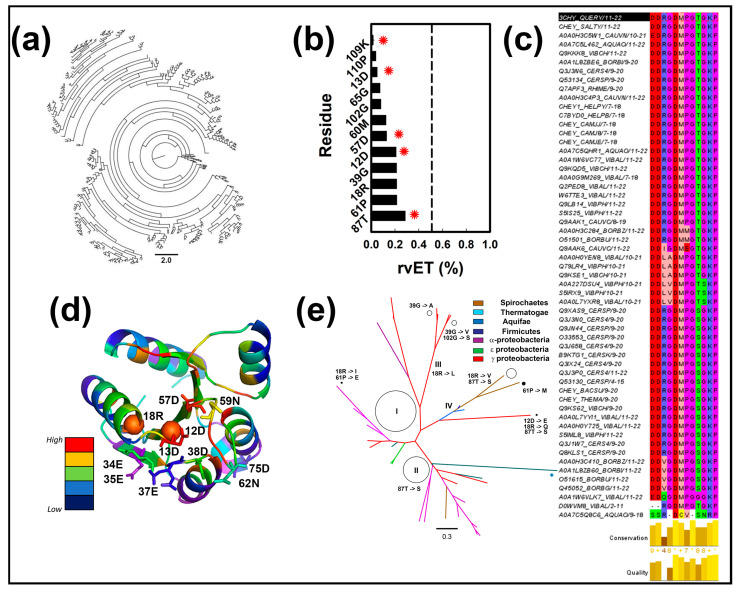
The Escherichia coli CheY protein belongs to a large bacterial response regulator superfamily. X-ray hydroxy radical foot-printing with mass spectroscopy (XFMS) has shown that allosteric activation of CheY by its motor target triggers a concerted internalization of aromatic sidechains. We reanalyzed the XFMS data to compare polar versus non-polar CheY residue positions. The polar residues around and including the 57D phosphorylated site had an elevated hydroxy radical reactivity. Bioinformatic measures revealed that a water-mediated hydrogen bond network connected this ring of residues with the central 57D. These residues solvated 57D to energetically stabilize the apo-CheY fold. The abundance of these reactive residues was reduced upon activation. This result was supported by the bioinformatics and consistent with the previously reported activation-induced increase in core hydrophobicity. It further illustrated XFMS detection of structural waters. Direct contacts between the ring residues and the phosphorylation site would stabilize the aspartyl phosphate. In addition, we report that the ring residue, 18R, is a constant central node in the 57D solvation network and that 18R non-polar substitutions determine CheY diversity as assessed by its evolutionary trace in bacteria with well-studied chemotaxis. These results showcase the importance of structured water dynamics for phosphorylation-mediated signal transduction.
Overview
The claims and statistics of this paper haven’t been checked yet.
Run the check — free, no account needed. It reads the open-access text and checks the sources it cites.
Integrity signals
Registry
Cites
Statistics
Figures
Verification
Claims the paper makes
The claims and statistics of this paper haven’t been checked yet.
Run the check — free, no account needed. It reads the open-access text and checks the sources it cites.
Self-check
Percentages, sums and reported differences re-computed from the paper’s own numbers.
The self-check needs the paper’s full text.
Citations
Cites
Highly accurate protein structure prediction with AlphaFold
Jumper, J., Evans, R., Pritzel, A., Green, T., Figurnov, M., Ronneberger, O., Tunyasuvunakool, K., Bates, R., Žídek, A., Potapenko, A., et al. (2021) · Nature · doi:10.1038/s41586-021-03819-2 · Cited by 43,764
A Unified View of “How Allostery Works”
Tsai, C.-J., & Nussinov, R. (2014) · PLoS Computational Biology · doi:10.1371/journal.pcbi.1003394 · Cited by 401
Defining a new nomenclature for the structures of active and inactive kinases
Modi, V., & Dunbrack, R. L. (2019) · Proceedings of the National Academy of Sciences · doi:10.1073/pnas.1814279116 · Cited by 367
Structural waters define a functional channel mediating activation of the GPCR, rhodopsin
Angel, T. E., Gupta, S., Jastrzebska, B., Palczewski, K., & Chance, M. R. (2009) · Proceedings of the National Academy of Sciences · doi:10.1073/pnas.0901074106 · Cited by 203
Research works printed but not linked: 39
- Kauzmann, 1959, Some Factors in the Interpretation of Protein Denaturation, Advances in Protein Chemistry, Volume 14, 1, 10.1016/S0065-3233(08)60608-7 · DOI
- Papoian, 2004, Water in protein structure prediction, Proc. Natl. Acad. Sci. USA, 101, 3352, 10.1073/pnas.0307851100 · DOI
- Samways, 2021, Water molecules at protein–drug interfaces: Computational prediction and analysis methods, Chem. Soc. Rev., 50, 9104, 10.1039/D0CS00151A · DOI
- Spyrakis, 2017, The Roles of Water in the Protein Matrix: A Largely Untapped Resource for Drug Discovery, J. Med. Chem., 60, 6781, 10.1021/acs.jmedchem.7b00057 · DOI
- McClendon, 2014, Dynamic architecture of a protein kinase, Proc. Natl. Acad. Sci. USA, 111, E4623, 10.1073/pnas.1418402111 · DOI
- Xu, 2007, Hydroxyl Radical-Mediated Modification of Proteins as Probes for Structural Proteomics, Chem. Rev., 107, 3514, 10.1021/cr0682047 · DOI
- Gupta, 2016, Synchrotron X-ray footprinting as a method to visualize water in proteins, J. Synchrotron Radiat., 23, 1056, 10.1107/S1600577516009024 · DOI
- Gupta, 2019, Water molecules mediate zinc mobility in the bacterial zinc diffusion channel ZIPB, J. Biol. Chem., 294, 13327, 10.1074/jbc.RA119.009239 · DOI
- Gustavsson, 2017, Structural basis of ligand interaction with atypical chemokine receptor 3, Nat. Commun., 8, 14135, 10.1038/ncomms14135 · DOI
- Gupta, 2012, Structure and dynamics of protein waters revealed by radiolysis and mass spectrometry, Proc. Natl. Acad. Sci. USA, 109, 14882, 10.1073/pnas.1209060109 · DOI
- Huang, 2015, Quantitative Mapping of Protein Structure by Hydroxyl Radical Footprinting-Mediated Structural Mass Spectrometry: A Protection Factor Analysis, Biophys. J., 108, 107, 10.1016/j.bpj.2014.11.013 · DOI
- Wang, 2017, Protein Footprinting Comes of Age: Mass Spectrometry for Biophysical Structure Assessment, Mol. Cell. Proteom., 16, 706, 10.1074/mcp.O116.064386 · DOI
- Wheatley, 2020, Allosteric Priming of E. Coli CheY by the Flagellar Motor Protein FliM, bioRxiv, 119, 1108
- Gao, 2019, Structural Basis of Response Regulator Function, Annu. Rev. Microbiol., 73, 175, 10.1146/annurev-micro-020518-115931 · DOI
- Dyer, 2006, Switched or Not?: The Structure of Unphosphorylated CheY Bound to the N Terminus of FliM, J. Bacteriol., 188, 7354, 10.1128/JB.00637-06 · DOI
- Dyer, 2004, Structure of the Constitutively Active Double Mutant CheYD13K Y106W Alone and in Complex with a FliM Peptide, J. Mol. Biol., 342, 1325, 10.1016/j.jmb.2004.07.084 · DOI
- Volz, 1991, Crystal structure of Escherichia coli CheY refined at 1.7-A resolution, J. Biol. Chem., 266, 15511, 10.1016/S0021-9258(18)98646-1 · DOI
- Basharat, 2019, SPECTRUM—A MATLAB Toolbox for Proteoform Identification from Top-Down Proteomics Data, Sci. Rep., 9, 11267, 10.1038/s41598-019-47724-1 · DOI
- Stock, 1993, Structure of the magnesium-bound form of CheY and mechanism of phosphoryl transfer in bacterial chemotaxis, Biochemistry, 32, 13375, 10.1021/bi00212a001 · DOI
- Guhaniyogi, 2006, Crystal Structures of Beryllium Fluoride-free and Beryllium Fluoride-bound CheY in Complex with the Conserved C-terminal Peptide of CheZ Reveal Dual Binding Modes Specific to CheY Conformation, J. Mol. Biol., 359, 624, 10.1016/j.jmb.2006.03.050 · DOI
- Bourret, 2010, Receiver domain structure and function in response regulator proteins, Curr. Opin. Microbiol., 13, 142, 10.1016/j.mib.2010.01.015 · DOI
- Ferreiro, 2011, On the role of frustration in the energy landscapes of allosteric proteins, Proc. Natl. Acad. Sci. USA, 108, 3499, 10.1073/pnas.1018980108 · DOI
- Freiberger, 2019, Local frustration around enzyme active sites, Proc. Natl. Acad. Sci. USA, 116, 4037, 10.1073/pnas.1819859116 · DOI
- Lee, 2001, Crystal Structure of an Activated Response Regulator Bound to Its Target, Nat. Struct. Biol., 8, 52, 10.1038/nsb0901-789 · DOI
- Smith, 2003, Investigation of the Role of Electrostatic Charge in Activation of the Escherichia coli Response Regulator CheY, J. Bacteriol., 185, 6385, 10.1128/JB.185.21.6385-6391.2003 · DOI
- Foster, 2021, Role of Position K+4 in the Phosphorylation and Dephosphorylation Reaction Kinetics of the CheY Response Regulator, Biochemistry, 60, 2130, 10.1021/acs.biochem.1c00246 · DOI
- Pilizota, 2009, A molecular brake, not a clutch, stops the Rhodobacter sphaeroides flagellar motor, Proc. Natl. Acad. Sci. USA, 106, 11582, 10.1073/pnas.0813164106 · DOI
- Rossmann, 2020, In situ structure of the Caulobacter crescentus flagellar motor and visualization of binding of a CheY-homolog, Mol. Microbiol., 114, 443, 10.1111/mmi.14525 · DOI
- Armstrong, 2016, Arginine side chain interactions and the role of arginine as a gating charge carrier in voltage sensitive ion channels, Sci. Rep., 6, 21759, 10.1038/srep21759 · DOI
- Mayol, 2020, HomolWat: A web server tool to incorporate ‘homologous’ water molecules into GPCR structures, Nucleic Acids Res., 48, W54, 10.1093/nar/gkaa440 · DOI
- Krishnamurthy, 2021, A nexus of intrinsic dynamics underlies translocase priming, Structure, 29, 846, 10.1016/j.str.2021.03.015 · DOI
- Chen, 2020, Surveying biomolecular frustration at atomic resolution, Nat. Commun., 11, 5944, 10.1038/s41467-020-19560-9 · DOI
- Davtyan, 2012, AWSEM-MD: Protein Structure Prediction Using Coarse-Grained Physical Potentials and Bioinformatically Based Local Structure Biasing, J. Phys. Chem. B, 116, 8494, 10.1021/jp212541y · DOI
- Parra, 2016, Protein Frustratometer 2: A tool to localize energetic frustration in protein molecules, now with electrostatics, Nucleic Acids Res., 44, W356, 10.1093/nar/gkw304 · DOI
- Siemers, 2021, Interactive Interface for Graph-Based Analyses of Dynamic H-Bond Networks: Application to Spike Protein S, J. Chem. Inf. Model., 61, 2998, 10.1021/acs.jcim.1c00306 · DOI
- Karathanou, 2020, A Graph-Based Approach Identifies Dynamic H-Bond Communication Networks in Spike Protein S of SARS-CoV-2, J. Struct. Biol., 212, 107617, 10.1016/j.jsb.2020.107617 · DOI
- Mihalek, 2004, A Family of Evolution–Entropy Hybrid Methods for Ranking Protein Residues by Importance, J. Mol. Biol., 336, 1265, 10.1016/j.jmb.2003.12.078 · DOI
- UniProt Consortium (2019). UniProt: A worldwide hub of protein knowledge. Nucleic Acids Res., 47, D506–D515. · DOI · Paper page
- Xu, 2005, Radiolytic Modification and Reactivity of Amino Acid Residues Serving as Structural Probes for Protein Footprinting, Anal. Chem., 77, 4549, 10.1021/ac050299+ · DOI
Metadata
- Authors
- Hamid, M., Khalid, M. F., Chaudhary, S. U., & Khan, S.
- Affiliations
- Lahore University of Management Sciences (PK)
- Lawrence Berkeley National Laboratory (US)
- Corresponding author
- Chaudhary, Safee Ullah
- Khan, Shahid
- Venue
- International Journal of Molecular Sciences
- Publisher
- MDPI AG
- Published
- 2022-10-23
- Volume
- 23
- Issue
- 21
- Pages
- 12771
- ISSN
- 1422-0067 (ISSN-L)
- PMC
- PMC9659070
- OpenAlex
- W4307267327
- Cited by
- 7
- References
- 4
- Citations by year
- 2026: 2 · 2025: 5
- FWCI
- 0.41
- Type
- journal article
- Language
- en
- Open access
- gold
- doi.org
- Licence
- Locations
- International Journal of Molecular Sciences (publishedVersion, cc-by)
- bioRxiv (Cold Spring Harbor Laboratory) (acceptedVersion)
- PubMed Central (publishedVersion, cc-by)
- PubMed (publishedVersion)
- OSTI OAI (U.S. Department of Energy Office of Scientific and Technical Information) (submittedVersion)
- DOAJ (DOAJ: Directory of Open Access Journals) (submittedVersion, cc-by-sa)
- Funders
- Higher Education Commission (HEC) of Pakistan (20-3629/NRPU/R, D/HEC/14/585, RF-NCBC-015)
- National Center for Bigdata and Cloud Computing (NCBC) (20-3629/NRPU/R, D/HEC/14/585, RF-NCBC-015)
- Topics
- Life Sciences › Biochemistry, Genetics and Molecular Biology › Molecular Biology › Protein Structure and Dynamics
- Life Sciences › Biochemistry, Genetics and Molecular Biology › Genetics › Bacterial Genetics and Biotechnology
- Life Sciences › Biochemistry, Genetics and Molecular Biology › Structural Biology › Enzyme Structure and Function
- Keywords
- CheY, phosphorylation sites, solvation, hydrogen bond network, structured water, allosteric activation, bacterial chemotaxis, response regulator, evolutionary trace, signal transduction
- MeSH terms
- Methyl-Accepting Chemotaxis Proteins, Bacterial Proteins, Chemotaxis, Escherichia coli, Membrane Proteins, Mutation, Phosphorylation, Water, Escherichia coli Proteins
About these checks
Registry, retraction, Cites and statistics results are computed, not judged, with one exception: a printed reference that no index lists is read once by a model before it counts as a citation error. Claims are extracted by a model and kept only when their quote appears verbatim in the text; each cited source is then checked, with a model’s help, for whether it says what the claim relies on. Those verdicts can be wrong — read the claim’s quote and the cited source before relying on one.
Statistics and arithmetic are recomputed, not judged.
Confidence bands are shown only for fields calibrated on our annotated test set. None is calibrated yet, so no band is shown.
What counts as a claim ›How we measure confidence ›How we check this ›
Are you an author, or do you see a problem with this page? Request a review
How to cite
Cite CoChat for the checks on this page, and the paper for its own findings.
- This page
- CoChat. (2026). Citation check: The Solvation of the E. coli CheY Phosphorylation Site Mapped by XFMS. https://app.cochat.ai/papers/10.3390/ijms232112771
- The paper
- Hamid, M., Khalid, M. F., Chaudhary, S. U., & Khan, S. (2022). The Solvation of the E. coli CheY Phosphorylation Site Mapped by XFMS. International Journal of Molecular Sciences. https://doi.org/10.3390/ijms232112771
