

The DOI matches its Crossref record; 90 of the 90 references it cites were found in a registry or an index.
Insight into the Structural Basis for Dual Nucleic Acid—Recognition by the Scaffold Attachment Factor B2 Protein
Open accessPublished version of a preprint
Abstract
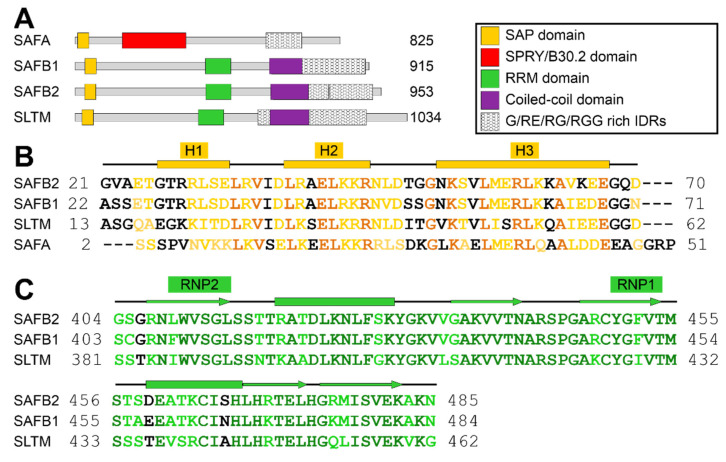
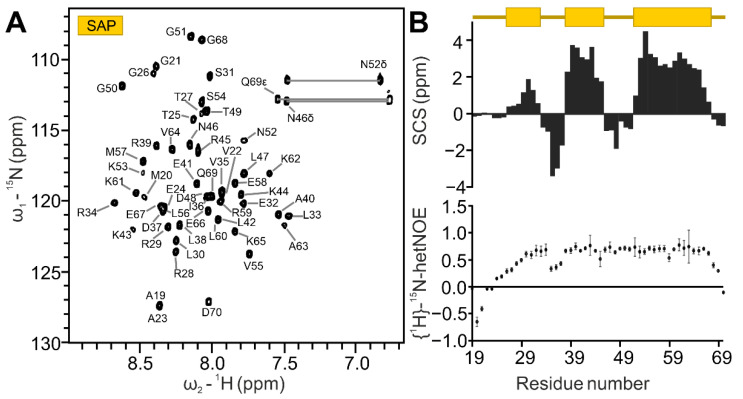
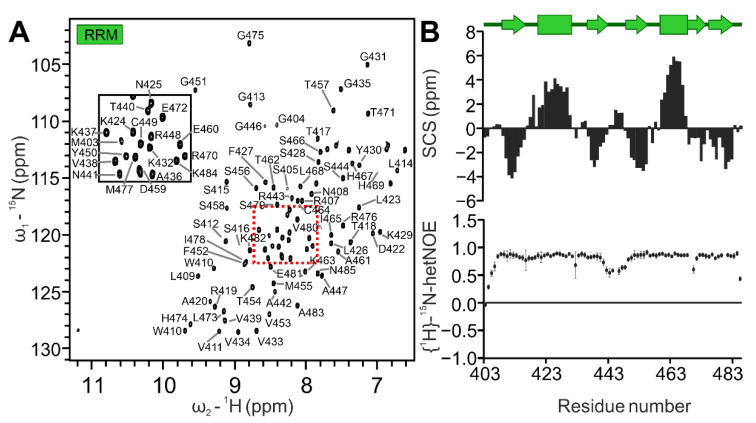
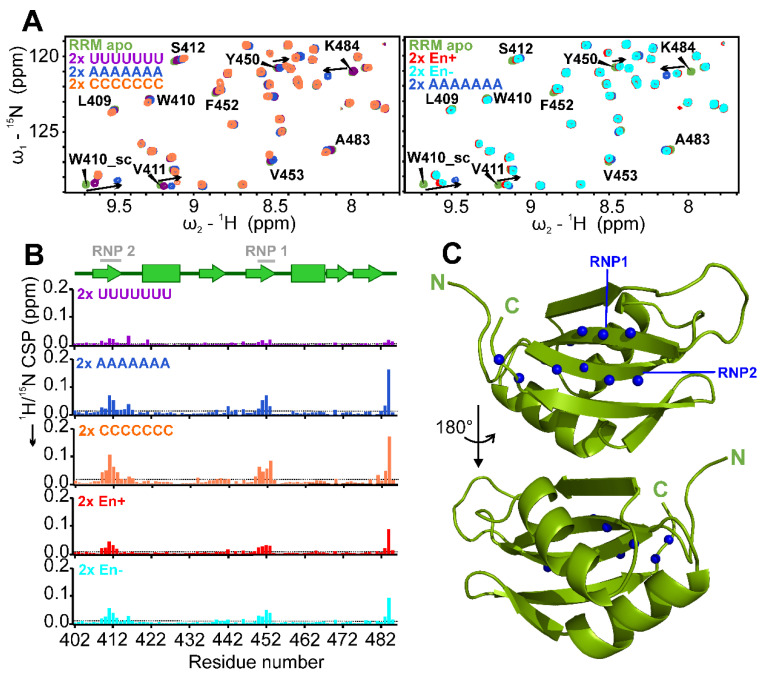
The family of scaffold attachment factor B (SAFB) proteins comprises three members and was first identified as binders of the nuclear matrix/scaffold. Over the past two decades, SAFBs were shown to act in DNA repair, mRNA/(l)ncRNA processing and as part of protein complexes with chromatin-modifying enzymes. SAFB proteins are approximately 100 kDa-sized dual nucleic acid-binding proteins with dedicated domains in an otherwise largely unstructured context, but whether and how they discriminate DNA and RNA binding has remained enigmatic. We here provide the SAFB2 DNA- and RNA-binding SAP and RRM domains in their functional boundaries and use solution NMR spectroscopy to ascribe DNA- and RNA-binding functions. We give insight into their target nucleic acid preferences and map the interfaces with respective nucleic acids on sparse data-derived SAP and RRM domain structures. Further, we provide evidence that the SAP domain exhibits intra-domain dynamics and a potential tendency to dimerize, which may expand its specifically targeted DNA sequence range. Our data provide a first molecular basis of and a starting point towards deciphering DNA- and RNA-binding functions of SAFB2 on the molecular level and serve a basis for understanding its localization to specific regions of chromatin and its involvement in the processing of specific RNA species.
Overview
The claims and statistics of this paper haven’t been checked yet.
Run the check — free, no account needed. It reads the open-access text and checks the sources it cites.
Integrity signals
Registry
Cites
Statistics
Figures
Verification
Claims the paper makes
The claims and statistics of this paper haven’t been checked yet.
Run the check — free, no account needed. It reads the open-access text and checks the sources it cites.
Self-check
Percentages, sums and reported differences re-computed from the paper’s own numbers.
The self-check needs the paper’s full text.
Citations
Cites
Highly accurate protein structure prediction with AlphaFold
Jumper, J., Evans, R., Pritzel, A., Green, T., Figurnov, M., Ronneberger, O., Tunyasuvunakool, K., Bates, R., Žídek, A., Potapenko, A., et al. (2021) · Nature · doi:10.1038/s41586-021-03819-2 · Cited by 43,764
Berman, H. M. (2000) · Nucleic Acids Research · doi:10.1093/nar/28.1.235 · Cited by 40,196
Fast, scalable generation of high‐quality protein multiple sequence alignments using Clustal Omega
Sievers, F., Wilm, A., Dineen, D., Gibson, T. J., Karplus, K., Li, W., Lopez, R., McWilliam, H., Remmert, M., Söding, J., et al. (2011) · Molecular Systems Biology · doi:10.1038/msb.2011.75 · Cited by 15,355
UniProt: the universal protein knowledgebase in 2021
The UniProt Consortium, Bateman, A., Martin, M.-J., Orchard, S., Magrane, M., Agivetova, R., Ahmad, S., Alpi, E., Bowler-Barnett, E. H., Britto, R., et al. (2021) · Nucleic Acids Research · doi:10.1093/nar/gkaa1100 · Cited by 6,372
Dali server: conservation mapping in 3D
Holm, L., & Rosenstr�m, P. (2010) · Nucleic Acids Research · doi:10.1093/nar/gkq366 · Cited by 3,640
The CCPN data model for NMR spectroscopy: Development of a software pipeline
Vranken, W. F., Boucher, W., Stevens, T. J., Fogh, R. H., Pajon, A., Llinas, M., Ulrich, E. L., Markley, J. L., Ionides, J., & Laue, E. D. (2005) · Proteins: Structure, Function, and Bioinformatics · doi:10.1002/prot.20449 · Cited by 3,209
1H, 13C and 15N chemical shift referencing in biomolecular NMR
Wishart, D. S., Bigam, C. G., Yao, J., Abildgaard, F., Dyson, H. J., Oldfield, E., Markley, J. L., & Sykes, B. D. (1995) · Journal of Biomolecular NMR · doi:10.1007/bf00211777 · Cited by 2,359
NMRFAM-SPARKY: enhanced software for biomolecular NMR spectroscopy
Lee, W., Tonelli, M., & Markley, J. L. (2015) · Bioinformatics · doi:10.1093/bioinformatics/btu830 · Cited by 2,045
RNA-binding proteins: modular design for efficient function
Lunde, B. M., Moore, C., & Varani, G. (2007) · Nature Reviews Molecular Cell Biology · doi:10.1038/nrm2178 · Cited by 1,321
Maris, C., Dominguez, C., & Allain, F. H. ‐. (2005) · The FEBS Journal · doi:10.1111/j.1742-4658.2005.04653.x · Cited by 1,125
Collaboration gets the most out of software
Morin, A., Eisenbraun, B., Key, J., Sanschagrin, P. C., Timony, M. A., Ottaviano, M., & Sliz, P. (2013) · eLife · doi:10.7554/elife.01456 · Cited by 1,081
New developments on the Encyclopedia of DNA Elements (ENCODE) data portal
Luo, Y., Hitz, B. C., Gabdank, I., Hilton, J. A., Kagda, M. S., Lam, B., Myers, Z., Sud, P., Jou, J., Lin, K., et al. (2020) · Nucleic Acids Research · doi:10.1093/nar/gkz1062 · Cited by 993
[12] Chemical shifts as a tool for structure determination
Wishart, D. S., & Sykes, B. D. (1994) · Methods in Enzymology · doi:10.1016/s0076-6879(94)39014-2 · Cited by 860
Consistent blind protein structure generation from NMR chemical shift data
Shen, Y., Lange, O., Delaglio, F., Rossi, P., Aramini, J. M., Liu, G., Eletsky, A., Wu, Y., Singarapu, K. K., Lemak, A., et al. (2008) · Proceedings of the National Academy of Sciences · doi:10.1073/pnas.0800256105 · Cited by 855
Furey, T. S. (2012) · Nature Reviews Genetics · doi:10.1038/nrg3306 · Cited by 835
RNA recognition motifs: boring? Not quite
Cléry, A., Blatter, M., & Allain, F. H.-T. (2008) · Current Opinion in Structural Biology · doi:10.1016/j.sbi.2008.04.002 · Cited by 635
Primary structure and binding activity of the hnRNP U protein: binding RNA through RGG box.
Kiledjian, M., & Dreyfuss, G. (1992) · The EMBO Journal · doi:10.1002/j.1460-2075.1992.tb05331.x · Cited by 629
Structure of the NF-κB p50 homodimer bound to DNA
Müller, C. W., Rey, F. A., Sodeoka, M., Verdine, G. L., & Harrison, S. C. (1995) · Nature · doi:10.1038/373311a0 · Cited by 535
SAP – a putative DNA-binding motif involved in chromosomal organization
Aravind, L., & Koonin, E. V. (2000) · Trends in Biochemical Sciences · doi:10.1016/s0968-0004(99)01537-6 · Cited by 512
The structure, function and evolution of proteins that bind DNA and RNA
Hudson, W. H., & Ortlund, E. A. (2014) · Nature Reviews Molecular Cell Biology · doi:10.1038/nrm3884 · Cited by 410
Molecular basis of UG-rich RNA recognition by the human splicing factor TDP-43
Lukavsky, P. J., Daujotyte, D., Tollervey, J. R., Ule, J., Stuani, C., Buratti, E., Baralle, F. E., Damberger, F. F., & Allain, F. H.-T. (2013) · Nature Structural & Molecular Biology · doi:10.1038/nsmb.2698 · Cited by 407
Lambert, N., Robertson, A., Jangi, M., McGeary, S., Sharp, P. A., & Burge, C. B. (2014) · Molecular Cell · doi:10.1016/j.molcel.2014.04.016 · Cited by 400
Edelheit, O., Hanukoglu, A., & Hanukoglu, I. (2009) · BMC Biotechnology · doi:10.1186/1472-6750-9-61 · Cited by 397
Pervasive Chromatin-RNA Binding Protein Interactions Enable RNA-Based Regulation of Transcription
Xiao, R., Chen, J.-Y., Liang, Z., Luo, D., Chen, G., Lu, Z. J., Chen, Y., Zhou, B., Li, H., Du, X., et al. (2019) · Cell · doi:10.1016/j.cell.2019.06.001 · Cited by 395
Smad Proteins Bind a Conserved RNA Sequence to Promote MicroRNA Maturation by Drosha
Davis, B. N., Hilyard, A. C., Nguyen, P. H., Lagna, G., & Hata, A. (2010) · Molecular Cell · doi:10.1016/j.molcel.2010.07.011 · Cited by 383
Spin-echo water suppression for the generation of pure-phase two-dimensional NMR spectra
Sklenář, V., & Bax, A. (1987) · Journal of Magnetic Resonance (1969) · doi:10.1016/0022-2364(87)90269-1 · Cited by 340
Structural insights into TDP-43 in nucleic-acid binding and domain interactions
Kuo, P.-H., Doudeva, L. G., Wang, Y.-T., Shen, C.-K. J., & Yuan, H. S. (2009) · Nucleic Acids Research · doi:10.1093/nar/gkp013 · Cited by 330
Romig, H., Fackelmayer, F. O., Renz, A., Ramsperger, U., & Richter, A. (1992) · The EMBO Journal · doi:10.1002/j.1460-2075.1992.tb05422.x · Cited by 263
Specificity of ribonucleoprotein interaction determined by RNA folding during complex formation
Allain, F. H. ‐., Gubser, C. C., Howe, P. W. A., Nagai, K., Neuhaus, D., & Varani, G. (1996) · Nature · doi:10.1038/380646a0 · Cited by 249
RRM–RNA recognition: NMR or crystallography…and new findings
Daubner, G. M., Cléry, A., & Allain, F. H. ‐. (2012) · Current Opinion in Structural Biology · doi:10.1016/j.sbi.2012.11.006 · Cited by 227
Lange, O. F., Rossi, P., Sgourakis, N. G., Song, Y., Lee, H., Aramini, J. M., Ertekin, A., Xiao, R., Acton, T., Montelione, G. T., et al. (2012) · Proceedings of the National Academy of Sciences · doi:10.1073/pnas.1203013109 · Cited by 210
Nuclear Export of NF90 Is Required for Interleukin-2 mRNA Stabilization
Shim, J., Lim, H., Yates, J. R., & Karin, M. (2002) · Molecular Cell · doi:10.1016/s1097-2765(02)00730-x · Cited by 187
NMR approaches for structural analysis of multidomain proteins and complexes in solution
Göbl, C., Madl, T., Simon, B., & Sattler, M. (2014) · Progress in Nuclear Magnetic Resonance Spectroscopy · doi:10.1016/j.pnmrs.2014.05.003 · Cited by 183
Secondary structure determination of conserved SARS-CoV-2 RNA elements by NMR spectroscopy
Wacker, A., Weigand, J. E., Akabayov, S. R., Altincekic, N., Bains, J. K., Banijamali, S. E., Binas, O., Castillo-Martínez, J., Çetiner, E. C., Ceylan, B., et al. (2020) · Nucleic Acids Research · doi:10.1093/nar/gkaa1013 · Cited by 176
Self-citationCrystal structure of NF-κB (p50) 2 complexed to a high-affinity RNA aptamer
Huang, D.-B., Vu, D., Cassiday, L. A., Zimmerman, J. M., Maher, L. J., & Ghosh, G. (2003) · Proceedings of the National Academy of Sciences · doi:10.1073/pnas.1632011100 · Cited by 167
Huo, X., Ji, L., Zhang, Y., Lv, P., Cao, X. D., Wang, Q., Yan, Z., Dong, S., Du, D., Zhang, F., et al. (2019) · Molecular Cell · doi:10.1016/j.molcel.2019.10.001 · Cited by 149
Renz, A., & Fackelmayer, F. O. (1996) · Nucleic Acids Research · doi:10.1093/nar/24.5.843 · Cited by 130
Crystal structure of T4 endonuclease VII resolving a Holliday junction
Biertümpfel, C., Yang, W., & Suck, D. (2007) · Nature · doi:10.1038/nature06152 · Cited by 125
Weighardt, F., Cobianchi, F., Cartegni, L., et al. (1999) · Journal of Cell Science · doi:10.1242/jcs.112.10.1465 · Cited by 124
Cléry, A., Sinha, R., Anczuków, O., Corrionero, A., Moursy, A., Daubner, G. M., Valcárcel, J., Krainer, A. R., & Allain, F. H. ‐. (2013) · Proceedings of the National Academy of Sciences · doi:10.1073/pnas.1303445110 · Cited by 123
Metzler, W. J., Constantine, K. L., Friedrichs, M. S., Bell, A., Ernst, E., Lavoie, T., & Mueller, L. (1993) · Biochemistry · doi:10.1021/bi00213a010 · Cited by 123
Metzler, W. J., Constantine, K. L., Friedrichs, M. S., Bell, A., Ernst, E., Lavoie, T., & Mueller, L. (2001) · Europe PMC (PubMed Central) · doi:10.13018/bmr4082 · Cited by 118
Functional characterization of Rad18 domains for Rad6, ubiquitin, DNA binding and PCNA modification
Notenboom, V., Hibbert, R. G., van Rossum-Fikkert, S. E., Olsen, J. V., Mann, M., & Sixma, T. K. (2007) · Nucleic Acids Research · doi:10.1093/nar/gkm615 · Cited by 110
Xiong, F., Wang, R., Lee, J.-H., Li, S., Chen, S.-F., Liao, Z., Hasani, L. A., Nguyen, P. T.-M., Zhu, X., Krakowiak, J., et al. (2021) · Cell Research · doi:10.1038/s41422-021-00515-8 · Cited by 108
Combinatorial recognition of clustered RNA elements by the multidomain RNA-binding protein IMP3
Schneider, T. P., Hung, L.-H., Aziz, M., Wilmen, A., Thaum, S., Wagner, J., Janowski, R., Müller, S., Schreiner, S., Friedhoff, P., et al. (2019) · Nature Communications · doi:10.1038/s41467-019-09769-8 · Cited by 101
Self-citationSAFB2, a New Scaffold Attachment Factor Homolog and Estrogen Receptor Corepressor
Townson, S. M., Dobrzycka, K. M., Lee, A. V., Air, M., Deng, W., Kang, K., Jiang, S., Kioka, N., Michaelis, K., & Oesterreich, S. (2003) · Journal of Biological Chemistry · doi:10.1074/jbc.m212988200 · Cited by 90
NF90 regulates inducible IL-2 gene expression in T cells
Shi, L., Godfrey, W. R., Lin, J., Zhao, G., & Kao, P. N. (2007) · The Journal of Experimental Medicine · doi:10.1084/jem.20052078 · Cited by 86
The Three-dimensional Structure of the C-terminal DNA-binding Domain of Human Ku70
Zhang, Z., Zhu, L., Lin, D., Chen, F., Chen, D. J., & Chen, Y. (2001) · Journal of Biological Chemistry · doi:10.1074/jbc.m105238200 · Cited by 75
Chemical shift-based methods in NMR structure determination
Nerli, S., McShan, A. C., & Sgourakis, N. G. (2018) · Progress in Nuclear Magnetic Resonance Spectroscopy · doi:10.1016/j.pnmrs.2018.03.002 · Cited by 74
Teplova, M., Malinina, L. V., Darnell, J. C., Song, J., Lu, M., Abagyan, R. A., Musunuru, K., Теплов, А. А., Burley, S. K., Darnell, R. B., et al. (2011) · Structure · doi:10.1016/j.str.2011.05.002 · Cited by 71
Fang, W., & Bartel, D. P. (2020) · Molecular Cell · doi:10.1016/j.molcel.2020.01.026 · Cited by 71
Structures and target RNA preferences of the RNA-binding protein family of IGF2BPs: An overview
Korn, S. M., Ulshöfer, C. J., Schneider, T. P., & Schlundt, A. (2021) · Structure · doi:10.1016/j.str.2021.05.001 · Cited by 67
Self-citationMuto, Y., & Yokoyama, S. (2012) · Wiley Interdisciplinary Reviews - RNA · doi:10.1002/wrna.1107 · Cited by 64
Hutter, K., Lohmüller, M., Jukic, A., Eichin, F., Avci, S., Labi, V., Szabó, T. G., Hoser, S. M., Hüttenhofer, A., Villunger, A., et al. (2020) · Molecular Cell · doi:10.1016/j.molcel.2020.05.011 · Cited by 61
Teplova, M., Farazi, T. A., Tuschl, T., & Patel, D. J. (2015) · Quarterly Reviews of Biophysics · doi:10.1017/s0033583515000207 · Cited by 55
Oesterreich, S. (2003) · Journal of Cellular Biochemistry · doi:10.1002/jcb.10685 · Cited by 54
Thomsen, N. D., Lawson, M. R., Witkowsky, L. B., Qu, S., & Berger, J. M. (2016) · Proceedings of the National Academy of Sciences · doi:10.1073/pnas.1616745113 · Cited by 53
The increasing diversity of functions attributed to the SAFB family of RNA-/DNA-binding proteins
Norman, M., Rivers, C. A., Lee, Y., Idris, J., & Uney, J. B. (2016) · Biochemical Journal · doi:10.1042/bcj20160649 · Cited by 53
Structural basis of IMP3 RRM12 recognition of RNA
Jia, M. Z., Gut, H., & Chao, J. A. (2018) · RNA · doi:10.1261/rna.065649.118 · Cited by 48
SAIL: a new conserved anti-fibrotic lncRNA in the heart
Luo, S., Zhang, M., Wu, H., Ding, X., Li, D., Dong, X., Hu, X., Su, S., Shang, W., Wu, J., et al. (2021) · Basic Research in Cardiology · doi:10.1007/s00395-021-00854-y · Cited by 48
Alternative RNA splicing complexes containing the scaffold attachment factor SAFB2
Sergeant, K. A., Bourgeois, C. F., Dalgliesh, C., Venables, J. P., Stévenin, J., & Elliott, D. J. (2007) · Journal of Cell Science · doi:10.1242/jcs.03344 · Cited by 44
Ron, M., & Ulitsky, I. (2022) · Nature Communications · doi:10.1038/s41467-022-30183-0 · Cited by 42
Raaijmakers, H. C. A., Törö, I., Birkenbihl, R. P., Kemper, B., & Suck, D. (2001) · Journal of Molecular Biology · doi:10.1006/jmbi.2001.4592 · Cited by 41
Huang, Y., Qiao, Y., Zhao, Y. F., Li, Y., Yuan, J., Zhou, J., Sun, H., & Wang, H. (2021) · Briefings in Bioinformatics · doi:10.1093/bib/bbab195 · Cited by 35
Zhao, H., Casillas, E., Shroff, H., Patterson, G. H., & Schuck, P. (2013) · PLoS ONE · doi:10.1371/journal.pone.0077245 · Cited by 32
Song, Z., Wu, P., Ji, P., Zhang, J., Gong, Q., Wu, J., & Shi, Y. (2012) · Biochemistry · doi:10.1021/bi300539t · Cited by 32
The KH domain facilitates the substrate specificity and unwinding processivity of DDX43 helicase
Yadav, M., Singh, R. S., Hogan, D., Vidhyasagar, V., Yang, S., Chung, I. Y. W., KUSALIK, A. J., Dmitriev, O. Y., Cygler, M., & Wu, Y. (2020) · Journal of Biological Chemistry · doi:10.1074/jbc.ra120.015824 · Cited by 32
SAFB1- and SAFB2-mediated transcriptional repression: relevance to cancer
Hong, E., Gautrey, H., Elliott, D. J., & Tyson-Capper, A. J. (2012) · Biochemical Society Transactions · doi:10.1042/bst20120030 · Cited by 30
Korn, S. M., Lambertz, R., Fürtig, B., Hengesbach, M., Löhr, F., Richter, C. P., Schwalbe, H., Weigand, J. E., Wöhnert, J., & Schlundt, A. (2020) · Biomolecular NMR Assignments · doi:10.1007/s12104-020-09995-y · Cited by 29
Self-citationHernández‐Hernández, J. M., Mallappa, C., Nasipak, B. T., Oesterreich, S., & Imbalzano, A. N. (2013) · Nucleic Acids Research · doi:10.1093/nar/gkt285 · Cited by 27
Gbp2 interacts with THO/TREX through a novel type of RRM domain
Martínez‐Lumbreras, S., Taverniti, V., Zorrilla, S., Séraphin, B., & Pérez‐Cañadillas, J. M. (2015) · Nucleic Acids Research · doi:10.1093/nar/gkv1303 · Cited by 26
Drakouli, S., Lyberopoulou, A., Papathanassiou, M., Mylonis, I., & Georgatsou, E. (2017) · FEBS Journal · doi:10.1111/febs.14141 · Cited by 26
Crystal structure and possible dimerization of the single RRM of human PABPN1
Ge, H., Zhou, D., Tong, S., Gao, Y., Teng, M., & Niu, L. (2008) · Proteins Structure Function and Bioinformatics · doi:10.1002/prot.21973 · Cited by 24
Inhibition of HSF1 and SAFB Granule Formation Enhances Apoptosis Induced by Heat Stress
Watanabe, K., & Ohtsuki, T. (2021) · International Journal of Molecular Sciences · doi:10.3390/ijms22094982 · Cited by 23
Duszczyk, M., Wischnewski, H., Kazeeva, T., Arora, R., Loughlin, F. E., von Schroetter, C., Pradère, U., Hall, J., Ciaudo, C., & Allain, F. H. ‐. (2022) · Nature Communications · doi:10.1038/s41467-022-33552-x · Cited by 22
Hashimoto, T., Matsuda, K., & Kawata, M. (2012) · Journal of Cellular Biochemistry · doi:10.1002/jcb.24182 · Cited by 21
Structures and nucleic acid-binding preferences of the eukaryotic ARID domain
Korn, S. M., & Schlundt, A. (2022) · Biological Chemistry · doi:10.1515/hsz-2021-0404 · Cited by 21
Self-citationThe RNA-binding profile of the splicing factor SRSF6 in immortalized human pancreatic β-cells
Alvelos, M. I., Brüggemann, M., Sutandy, F. X. R., Juan-Mateu, J., Colli, M. L., Busch, A., Lopes, M., Castela, Â., Aartsma-Rus, A. M., König, J., et al. (2020) · Life Science Alliance · doi:10.26508/lsa.202000825 · Cited by 20
Tants, J., Becker, L. M., McNicoll, F., Müller-McNicoll, M., & Schlundt, A. (2022) · Nucleic Acids Research · doi:10.1093/nar/gkac212 · Cited by 20
Self-citationShort-term hypoxia triggers ROS and SAFB mediated nuclear matrix and mRNA splicing remodeling
Taze, C., Drakouli, S., Samiotaki, M. K., Panayotou, G., Simos, G., Georgatsou, E., & Mylonis, I. (2022) · Redox Biology · doi:10.1016/j.redox.2022.102545 · Cited by 18
The heat's on: nuclear stress bodies signal intron retention
Erhardt, S., & Stoecklin, G. (2020) · The EMBO Journal · doi:10.15252/embj.2019104154 · Cited by 17
Weinheimer, A. S., Paung, Y., Rageul, J., Khan, A., Lo, N., Ho, B., Tong, M., Alphonse, S., Seeliger, M. A., & Kim, H. (2022) · Journal of Biological Chemistry · doi:10.1016/j.jbc.2022.102268 · Cited by 17
Affinity, Specificity, and Cooperativity of DNA Binding by Bacterial Gene Regulatory Proteins
Carey, J. (2022) · International Journal of Molecular Sciences · doi:10.3390/ijms23010562 · Cited by 16
Zhou, M., Kuruvilla, L., Shi, X., Viviano, S., Ahearn, I. M., Amendola, C. R., Su, W., Badri, S., Mahaffey, J. P., Fehrenbacher, N., et al. (2020) · Proceedings of the National Academy of Sciences · doi:10.1073/pnas.2005712117 · Cited by 13
SAFB1 interacts with and suppresses the transcriptional activity of p53
Peidis, P., Voukkalis, N., Aggelidou, E., Georgatsou, E., Hadzopoulou‐Cladaras, M., Scott, R. E., Nikolakaki, E., & Giannakouŕos, T. (2010) · FEBS Letters · doi:10.1016/j.febslet.2010.11.054 · Cited by 9
Korn, S. M., Dhamotharan, K., Fürtig, B., Hengesbach, M., Löhr, F., Qureshi, N. S., Richter, C. P., Saxena, K., Schwalbe, H., Tants, J., et al. (2020) · Biomolecular NMR Assignments · doi:10.1007/s12104-020-09971-6 · Cited by 7
Self-citationScaffold attachment factor B1 regulates androgen degradation pathways in prostate cancer.
Yang, J., Chen, Q., You, S., Rotinen, M., Posadas, E. M., Freedland, S. J., Vizio, D. D., Kim, J., & Freeman, M. R. (2021) · Europe PMC (PubMed Central) · Cited by 3
CRYSTAL STRUCTURE OF NF-kB(p50)2 COMPLEXED TO A HIGH-AFFINITY RNA APTAMER
Huang, D. B., Vu, D., Cassiday, L. A., Zimmerman, J. M., Maher, L. J., III, & Ghosh, G. (2003) · Worldwide Protein Data Bank · doi:10.2210/pdb1ooa/pdb · Cited by 2
Burge, C. B. (2020) · ENCODE Datasets · doi:10.17989/encsr558rbk · Cited by 1
Fu, X. (2017) · ENCODE Datasets · doi:10.17989/encsr072vuo · Cited by 1
Metadata
- Authors
- Korn, S. M., Von Ehr, J., Dhamotharan, K., Tants, J.-N., Abele, R., & Schlundt, A.
- Affiliations
- Goethe University Frankfurt (DE)
- Corresponding author
- Schlundt, Andreas
- ORCID
- Venue
- International Journal of Molecular Sciences
- Publisher
- MDPI AG
- Published
- 2023-02-07
- Volume
- 24
- Issue
- 4
- Pages
- 3286
- ISSN
- 1422-0067 (ISSN-L)
- PMC
- PMC9958909
- OpenAlex
- W4319600471
- Cited by
- 4
- References
- 90
- Citations by year
- 2026: 1 · 2025: 1 · 2024: 2
- FWCI
- 0.35
- Type
- journal article
- Language
- en
- Open access
- gold
- doi.org
- Licence
- Locations
- International Journal of Molecular Sciences (publishedVersion, cc-by)
- bioRxiv (Cold Spring Harbor Laboratory) (acceptedVersion, cc-by-nc)
- PubMed Central (publishedVersion, cc-by)
- PubMed (publishedVersion)
- Publication Server of Goethe University Frankfurt am Main (Goethe University Frankfurt) (submittedVersion, cc-by-nc)
- Publication Server of Goethe University Frankfurt am Main (Goethe University Frankfurt) (submittedVersion, cc-by)
- Funders
- State of Hesse (SCHL2062/2-1, 2019/AS01)
- German Research Council (DFG) (SCHL2062/2-1, 2019/AS01)
- Johanna Quandt Young Academy at Goethe (SCHL2062/2-1, 2019/AS01)
- Goethe University Excellence Initiative “SCALE” (SCHL2062/2-1, 2019/AS01)
- Topics
- Life Sciences › Biochemistry, Genetics and Molecular Biology › Molecular Biology › Protein Structure and Dynamics
- Life Sciences › Biochemistry, Genetics and Molecular Biology › Molecular Biology › Genomics and Chromatin Dynamics
- Life Sciences › Biochemistry, Genetics and Molecular Biology › Molecular Biology › RNA Research and Splicing
- Keywords
- nucleic acid recognition, DNA binding, RNA binding, SAP domain, RRM domain, domain structure, protein dimerization, chromatin, nuclear matrix, RNA processing, DNA repair
- MeSH terms
- Base Sequence, Binding Sites, Chromatin, Magnetic Resonance Spectroscopy, RNA, RNA, Messenger
About these checks
Registry, retraction, Cites and statistics results are computed, not judged, with one exception: a printed reference that no index lists is read once by a model before it counts as a citation error. Claims are extracted by a model and kept only when their quote appears verbatim in the text; each cited source is then checked, with a model’s help, for whether it says what the claim relies on. Those verdicts can be wrong — read the claim’s quote and the cited source before relying on one.
Statistics and arithmetic are recomputed, not judged.
Confidence bands are shown only for fields calibrated on our annotated test set. None is calibrated yet, so no band is shown.
What counts as a claim ›How we measure confidence ›How we check this ›
Are you an author, or do you see a problem with this page? Request a review
Data sources
Bibliographic data: Semantic Scholar, OpenAlex, Crossref.
Contains information from the Semantic Scholar Academic Graph Datasets, made available under the ODC Attribution License (ODC-BY 1.0).
Semantic Scholar’s data is described in: Kinney, R., et al. (2023). The Semantic Scholar Open Data Platform. arXiv:2301.10140.
