

The DOI matches its Crossref record; 1 of the 1 references it cites were found in a registry or an index.
Bioclimatic Modelling Identifies Suitable Habitat for the Establishment of the Invasive European Paper Wasp (Hymenoptera: Vespidae) across the Southern Hemisphere
Abstract
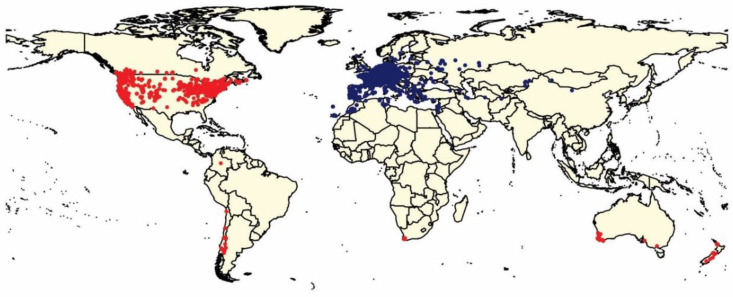
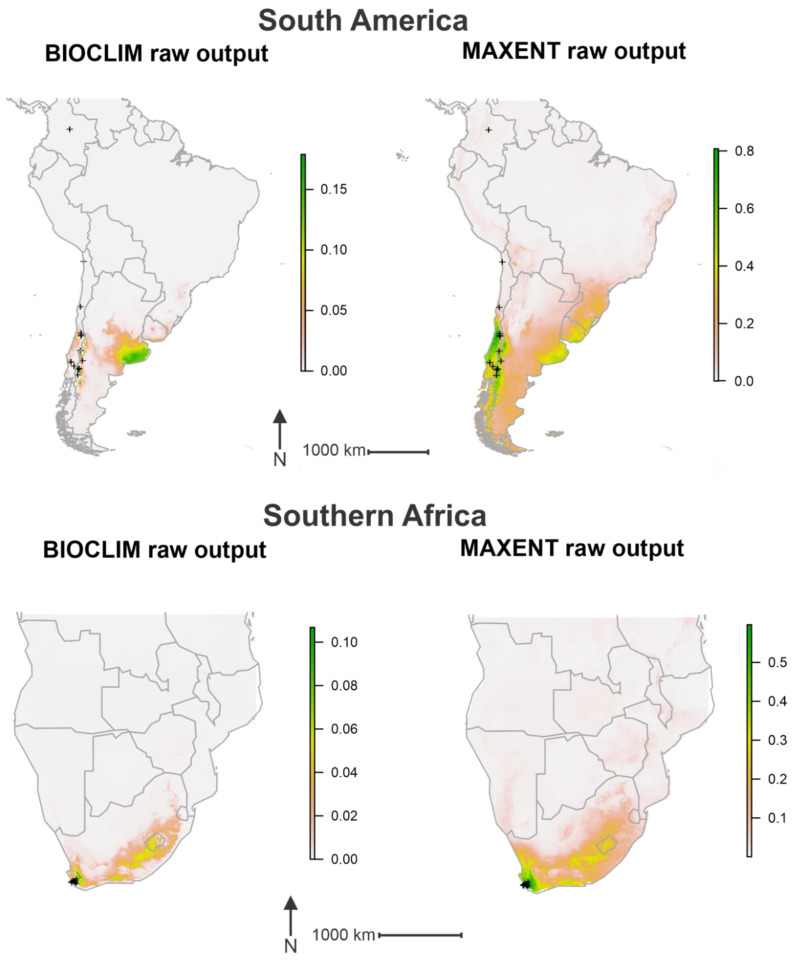
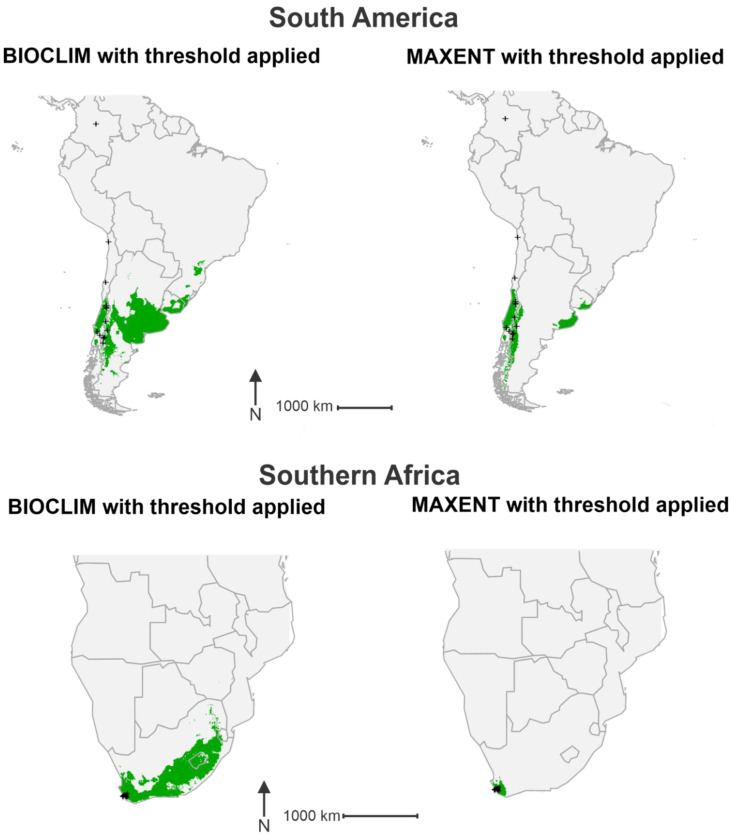
Species distribution models (SDMs) are tools used by ecologists to help predict the spread of invasive species. Information provided by these models can help direct conservation and biosecurity efforts by highlighting areas likely to contain species of interest. In this study, two models were created to investigate the potential range expansion of Polistes dominula Christ (Hymenoptera: Vespidae) in the southern hemisphere. This palearctic species has spread to invade North and South America, South Africa, Australia, and more recently New Zealand. Using the BIOCLIM and MAXENT modelling methods, regions that were suitable for P. dominula were identified based on climate data across four regions in the southern hemisphere. In South America areas of central Chile, eastern Argentina, parts of Uruguay, and southern Brazil were identified as climatically suitable for the establishment of P. dominula. Similarly, southern parts of South Africa and Australia were identified by the model to be suitable as well as much of the North Island and east of the South Island of New Zealand. Based on outputs from both models, significant range expansion by P. dominula is possible across its more southern invaded ranges.
Overview
The claims and statistics of this paper haven’t been checked yet.
Run the check — free, no account needed. It reads the open-access text and checks the sources it cites.
Integrity signals
Registry
Cites
Statistics
Figures
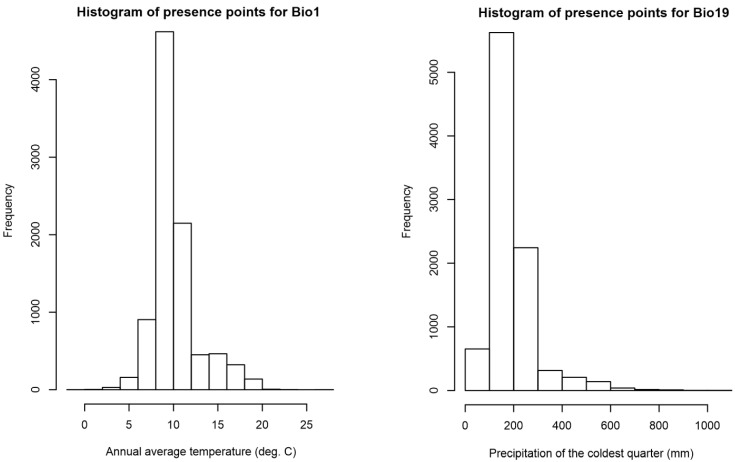
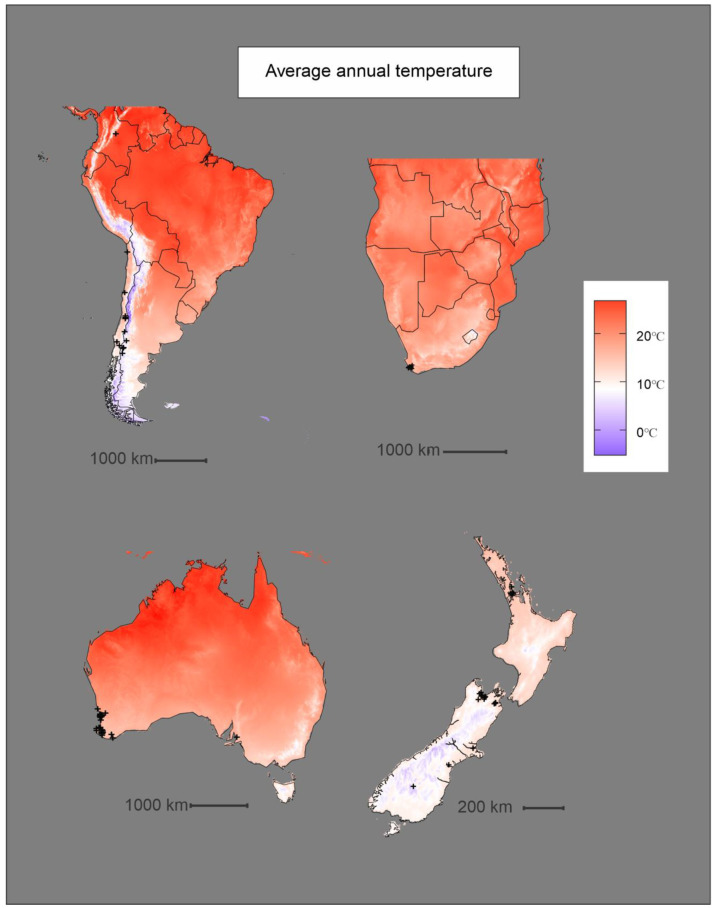
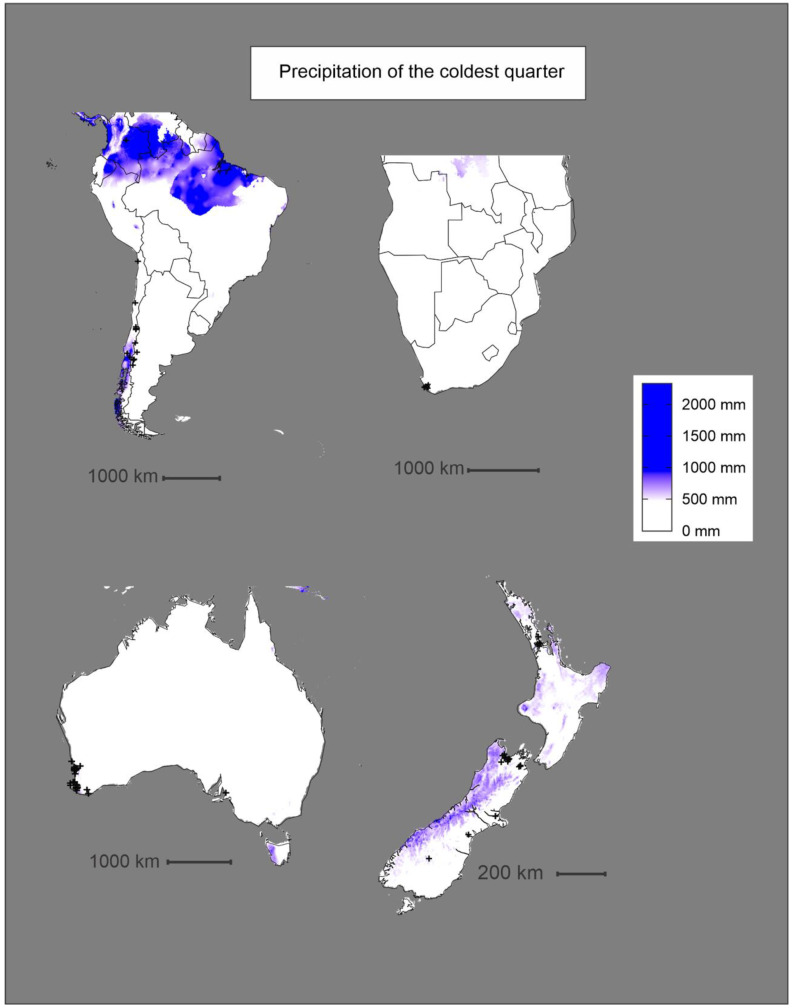
Verification
Claims the paper makes
The claims and statistics of this paper haven’t been checked yet.
Run the check — free, no account needed. It reads the open-access text and checks the sources it cites.
Claims other papers make about this one
Each is checked against this paper’s own text: does it say what the citing paper says it does?
In the citing paper
“Polistes dominula is native to southern Europe, North Africa and western Asia, but the species has been introduced in many territories (North and South America, South Africa, Australia, New Zealand), being considered an invasive species in several countries (Howse et al. (2020) and references therein).”
From Monitoring agroforest plots under the scope of the COMCHA project. 1. Baseline data for the vascular plants and arthropods of "Vale da Fonte Plot" in Pico Island (Azores Archipelago) (2026) · cites this paper as Howse et al. (2020)
Self-check
Percentages, sums and reported differences re-computed from the paper’s own numbers.
The self-check needs the paper’s full text.
Citations
Cites
The Predictive Performance and Stability of Six Species Distribution Models
Duan, R.-Y., Kong, X.-Q., Huang, M.-Y., Fan, W.-Y., & Wang, Z.-G. (2014) · PLoS ONE · doi:10.1371/journal.pone.0112764 · Cited by 259
Research works printed but not linked: 66
- Pearson, 2007, Species’ distribution modeling for conservation educators and practitioners, Lessons Conserv., 3, 54
- Leathwick, 2005, Using multivariate adaptive regression splines to predict the distributions of New Zealand’s freshwater diadromous fish, Freshw. Biol., 50, 2034, 10.1111/j.1365-2427.2005.01448.x · DOI
- Moor, 2015, Predicting climate change effects on wetland ecosystem services using species distribution modeling and plant functional traits, Ambio, 44, 113, 10.1007/s13280-014-0593-9 · DOI
- Curry, 2020, The potential tropical island distribution of a temperate invasive snail, Oxychilus alliarius, modeled on its distribution in Hawaii, Biol. Invasions, 22, 307, 10.1007/s10530-019-02091-w · DOI
- Buck, 2008, Identification atlas of the Vespidae (Hymenoptera, Aculeata) of the northeastern Nearctic region, Can. J. Arthropod Identif., 5, 1
- Carpenter, 1996, Distributional checklist of species of the genus Polistes (Hymenoptera: Vespidae; Polistinae, Polistini), Am. Mus. Novit., 3188, 1
- Brown, 2012, Prey capture and caste-specific payload capacities in the European paper wasp Polistes dominulus, Insectes Sociaux, 59, 519, 10.1007/s00040-012-0246-6 · DOI
- Baker, 2020, Invasive paper wasp turns urban pollinator gardens into ecological traps for monarch butterfly larvae, Sci. Rep., 10, 1, 10.1038/s41598-020-66621-6 · DOI
- Jeon, 2019, Prey diversity of Polistes rothneyi koreanus in different landscapes using DNA barcoding, J. Appl. Entomol., 143, 1052, 10.1111/jen.12681 · DOI
- Ward, 2013, Molecular identification of the prey range of the invasive Asian paper wasp, Ecol. Evol., 3, 4408, 10.1002/ece3.826 · DOI
- Kasper, 2004, Assessment of prey overlap between a native (Polistes humilis) and an introduced (Vespula germanica) social wasp using morphology and phylogenetic analyses of 16S rDNA, Mol. Ecol., 13, 2037, 10.1111/j.1365-294X.2004.02193.x · DOI
- Cervo, 2000, Polistes dominulus (Hymenoptera, Vespidae) invading North America: Some hypotheses for its rapid spread, Insectes Sociaux, 47, 155, 10.1007/PL00001694 · DOI
- Schenk, 2002, Functional response of a generalist insect predator to one of its prey species in the field, J. Anim. Ecol., 71, 524, 10.1046/j.1365-2656.2002.00620.x · DOI
- Roets, 2019, Better colony performance, not natural enemy release, explains numerical dominance of the exotic Polistes dominula wasp over a native congener in South Africa, Biol. Invasions, 21, 925, 10.1007/s10530-018-1870-5 · DOI
- Pickett, 2000, High productivity in haplometrotic colonies of the introduced paper wasp Polistes dominulus (Hymenoptera: Vespidae; Polistinae), J. N. Y. Entomol. Soc., 108, 314, 10.1664/0028-7199(2000)108[0314:HPIHCO]2.0.CO;2 · DOI
- Gamboa, 2002, The comparative biology of two sympatric paper wasps, the native Polistes fuscatus and the invasive Polistes dominulus (Hymenoptera, Vespidae), Insectes Sociaux, 49, 45, 10.1007/s00040-002-8278-y · DOI
- GBIF.org (2020, February 28). GBIF Occurence Download. Available online: https://doi.org/10.15468/dl.jzezgu. · DOI
- Liebert, 2006, Genetics, behavior and ecology of a paper wasp invasion: Polistes dominulus in North America, Ann. Zool. Fenn., 43, 595
- Taylor, R.W., Brown, D.R., and Cardale, J.C. (1985). Hymenoptera: Formicoidea, Vespoidea and Sphecoidea. · DOI
- Elgueta, 1989, Antecedentes sobre especies de reciente introducción a Chile (Diptera: Stratiomyidae; Hymenoptera: Vespidae), Rev. Chil. Entomol., 17, 97
- Sackmann, 2003, Presencia de una nueva avispa social exótica, Polistes dominulus (Hymenoptera: Vespidae) en la Patagonia Argentina, Rev. Soc. Entomológica Argent., 62, 68
- Eardley, 2009, Polistes dominulus (Christ, 1791)(Hymenoptera: Polistinae: Vespidae) newly recorded from South Africa, Afr. Entomol., 17, 226, 10.4001/003.017.0214 · DOI
- Stringer, 2012, Assessing the conservation status of New Zealand’s native terrestrial invertebrates, N. Z. Entomol., 35, 77, 10.1080/00779962.2012.686309 · DOI
- Lester, 2014, Critical issues facing New Zealand entomology, N. Z. Entomol., 37, 1, 10.1080/00779962.2014.861789 · DOI
- Sands, 2018, Important issues facing insect conservation in Australia: Now and into the future, Austral Entomol., 57, 150, 10.1111/aen.12342 · DOI
- Booth, 2014, bioclim: The first species distribution modelling package, its early applications and relevance to most current MaxEnt studies, Divers. Distrib., 20, 1, 10.1111/ddi.12144 · DOI
- Longmore, 1986, A biogeographic analysis of Australian elapid snakes, Atlas of Elapid Snakes of Australia, Volume 7, 16
- Elith, 2011, A statistical explanation of MaxEnt for ecologists, Divers. Distrib., 17, 43, 10.1111/j.1472-4642.2010.00725.x · DOI · Paper page
- Elith, 2006, Novel methods improve prediction of species’ distributions from occurrence data, Ecography, 29, 129, 10.1111/j.2006.0906-7590.04596.x · DOI · Paper page
- Phillips, 2006, Maximum entropy modeling of species geographic distributions, Ecol. Model., 190, 231, 10.1016/j.ecolmodel.2005.03.026 · DOI · Paper page
- Sumner, 2019, Mapping species distributions in 2 weeks using citizen science, Insect Conserv. Divers., 12, 382, 10.1111/icad.12345 · DOI
- Fick, 2017, WorldClim 2: New 1-km spatial resolution climate surfaces for global land areas, Int. J. Climatol., 37, 4302, 10.1002/joc.5086 · DOI · Paper page
- Beckham, 2017, An updated understanding of Texas bumble bee (Hymenoptera: Apidae) species presence and potential distributions in Texas, USA, PeerJ, 5, e3612, 10.7717/peerj.3612 · DOI
- Ward, 2007, Modelling the potential geographic distribution of invasive ant species in New Zealand, Biol. Invasions, 9, 723, 10.1007/s10530-006-9072-y · DOI
- Rodder, D., Schmidtlein, S., Veith, M., and Lotters, S. (2009). Alien invasive slider turtle in unpredicted habitat: A matter of niche shift or of predictors studied?. PLoS ONE, 4. · DOI
- Raghavan, R.K., Peterson, A.T., Cobos, M.E., Ganta, R., and Foley, D. (2019). Current and future distribution of the lone star tick, Amblyomma americanum (L.)(Acari: Ixodidae) in North America. PLoS ONE, 14. · DOI
- Dudaniec, 2018, Signatures of local adaptation along environmental gradients in a range-expanding damselfly (Ischnura elegans), Mol. Ecol., 27, 2576, 10.1111/mec.14709 · DOI
- Jiguet, 2012, Selecting pseudo-absences for species distribution models: How, where and how many?, Methods Ecol. Evol., 3, 327, 10.1111/j.2041-210X.2011.00172.x · DOI · Paper page
- Merow, 2013, A practical guide to MaxEnt for modeling species’ distributions: What it does, and why inputs and settings matter, Ecography, 36, 1058, 10.1111/j.1600-0587.2013.07872.x · DOI · Paper page
- Muscarella, 2014, ENMeval: An R package for conducting spatially independent evaluations and estimating optimal model complexity for ecological niche models, Methods Ecol. Evol., 5, 1198, 10.1111/2041-210X.12261 · DOI · Paper page
- Liu, 2016, On the selection of thresholds for predicting species occurrence with presence-only data, Ecol. Evol., 6, 337, 10.1002/ece3.1878 · DOI
- Liu, 2013, Selecting thresholds for the prediction of species occurrence with presence-only data, J. Biogeogr., 40, 778, 10.1111/jbi.12058 · DOI
- Hosmer, D.W., Lemeshow, S., and Sturdivant, R.X. (2013). Assessing the fit of the model. Applied Logistic Regression, John Wiley & Sons, Inc.. [3rd ed.]. · DOI · Paper page
- Veldtman, 2014, Rapid range expansion of the invasive wasp Polistes dominula (Hymenoptera: Vespidae: Polistinae) and first record of parasitoids on this species and the native Polistes marginalis in the Western Cape province of South Africa, Afr. Entomol., 22, 220, 10.4001/003.022.0104 · DOI
- Beggs, 1999, Restructuring of Lepidoptera communities by introduced Vespula wasps in a New Zealand beech forest, Oecologia, 119, 565, 10.1007/s004420050820 · DOI
- Toft, 1998, Reducing predation of orb-web spiders by controlling common wasps (Vespula vulgaris) in a New Zealand beech forest, Ecol. Entomol., 23, 90, 10.1046/j.1365-2311.1998.00100.x · DOI
- Kirkpatrick, 2018, The effects of introduced vespid wasps (Vespula germanica and V. vulgaris) on threatened native butterfly (Oreixenica ptunarra) populations in Tasmania, J. Insect Conserv., 22, 521, 10.1007/s10841-018-0081-9 · DOI
- Beaumont, 2005, Predicting species distributions: Use of climatic parameters in BIOCLIM and its impact on predictions of species’ current and future distributions, Ecol. Model., 186, 251, 10.1016/j.ecolmodel.2005.01.030 · DOI
- Stamp, 1988, Direct and indirect effects of predatory wasps (Polistes sp.: Vespidae) on gregarious caterpillars (Hemileuca lucina: Saturniidae), Oecologia, 75, 619, 10.1007/BF00776428 · DOI
- Pilowsky, 2018, Displacement and replacement in real time: Polistes dominula’s impact on P. fuscatus in the northeastern U.S, Biol. Invasions, 20, 1161, 10.1007/s10530-017-1617-8 · DOI
- Parent, C.E., Peck, S.B., Causton, C.E., Roque-Albelo, L., Lester, P.J., and Bulgarella, M. (2020). Polistes versicolor (Hymenoptera: Vespidae), an introduced wasp in the Galapagos Islands: Its life cycle and ecological impact. Environ. Entomol. · DOI
- Beggs, 2011, Ecological effects and management of invasive alien Vespidae, BioControl, 56, 505, 10.1007/s10526-011-9389-z · DOI
- Lefort, M.-C., Beggs, J.R., Glare, T.R., Saunders, T.E., Doyle, E.J., and Stephane, B. (2020, August 17). A Molecular Approach to Studying Hymenoptera Diets Using Polistine Wasps. Available online: https://www.biorxiv.org/content/10.1101/2020.04.06.024422v1. · DOI
- Stringer, 2012, The conservation status of New Zealand Lepidoptera, N. Z. Entomol., 35, 120, 10.1080/00779962.2012.686316 · DOI
- Tautz, 2015, Nesting behavior of the paper wasp Polistes dominula in Central Europe-a flexible system for expanding into new areas, Ecosphere, 6, 1
- Schapheer, 2018, Pest Cockroaches May Overcome Environmental Restriction Due to Anthropization, J. Med Entomol., 55, 1357
- Cranshaw, 2011, Notes on fruit damage by the European paper wasp, Polistes dominula (Christ) (Hymenoptera: Vespidae), Southwest. Entomol., 36, 103, 10.3958/059.036.0110 · DOI
- Wisz, 2013, The role of biotic interactions in shaping distributions and realised assemblages of species: Implications for species distribution modelling, Biol. Rev., 88, 15, 10.1111/j.1469-185X.2012.00235.x · DOI · Paper page
- Giannini, 2013, Improving species distribution models using biotic interactions: A case study of parasites, pollinators and plants, Ecography, 36, 649, 10.1111/j.1600-0587.2012.07191.x · DOI
- Godsoe, 2012, How do species interactions affect species distribution models?, Ecography, 35, 811, 10.1111/j.1600-0587.2011.07103.x · DOI
- Bulgarella, 2014, Shifting ranges of two tree weta species (Hemideina spp.): Competitive exclusion and changing climate, J. Biogeogr., 41, 524, 10.1111/jbi.12224 · DOI
- Mpakairi, K.S., Ndaimani, H., Tagwireyi, P., Gara, T.W., Zvidzai, M., and Madhlamoto, D. (2017). Missing in action: Species competition is a neglected predictor variable in species distribution modelling. PLoS ONE, 12. · DOI
- Pellissier, 2010, Species distribution models reveal apparent competitive and facilitative effects of a dominant species on the distribution of tundra plants, Ecography, 33, 1004, 10.1111/j.1600-0587.2010.06386.x · DOI
- Gamboa, 2004, The comparative biology of two sympatric paper wasps in Michigan, the native Polistes fuscatus and the invasive Polistes dominulus (Hymenoptera, Vespidae), Insectes Sociaux, 51, 153, 10.1007/s00040-003-0721-1 · DOI
- Miller, 2013, A ten-year comparative study of the population dynamics and parasitoidism in the native paper wasp Polistes fuscatus and the invasive P. dominulus, Insectes Sociaux, 60, 49, 10.1007/s00040-012-0264-4 · DOI
- Kearney, 2010, Correlative and mechanistic models of species distribution provide congruent forecasts under climate change, Conserv. Lett., 3, 203, 10.1111/j.1755-263X.2010.00097.x · DOI
Cited by
Lago, A., Petrone, A., Soares, A., Boieiro, M., Lopes, D., Freitas, T., Lhoumeau, S., Wallon, S., & Borges, P. (2026) · Biodiversity Data Journal · doi:10.3897/bdj.14.e174244 · Cited by 1
Metadata
- Authors
- Howse, M. W. F., Haywood, J., & Lester, P. J.
- Affiliations
- School of Biological Sciences, Victoria University of Wellington, Wellington 6140, New Zealand
- School of Mathematics and Statistics, Victoria University of Wellington, Wellington 6140, New Zealand
- Venue
- Insects
- Publisher
- MDPI AG
- Published
- 2020-11-11
- Volume
- 11
- Issue
- 11
- Pages
- 784
- ISSN
- 2075-4450
- PMC
- PMC7697767
- Cited by
- 25
- References
- 1
- Language
- en
About these checks
Registry, retraction, Cites and statistics results are computed, not judged, with one exception: a printed reference that no index lists is read once by a model before it counts as a citation error. Claims are extracted by a model and kept only when their quote appears verbatim in the text; each cited source is then checked, with a model’s help, for whether it says what the claim relies on. Those verdicts can be wrong — read the claim’s quote and the cited source before relying on one.
Statistics and arithmetic are recomputed, not judged.
Confidence bands are shown only for fields calibrated on our annotated test set. None is calibrated yet, so no band is shown.
What counts as a claim ›How we measure confidence ›How we check this ›
Are you an author, or do you see a problem with this page? Request a review
How to cite
Cite CoChat for the checks on this page, and the paper for its own findings.
- This page
- CoChat. (2026). Citation check: Bioclimatic Modelling Identifies Suitable Habitat for the Establishment of the Invasive European Paper Wasp (Hymenoptera: Vespidae) across the Southern Hemisphere. https://app.cochat.ai/papers/10.3390/insects11110784
- The paper
- Howse, M. W. F., Haywood, J., & Lester, P. J. (2020). Bioclimatic Modelling Identifies Suitable Habitat for the Establishment of the Invasive European Paper Wasp (Hymenoptera: Vespidae) across the Southern Hemisphere. Insects. https://doi.org/10.3390/insects11110784
Data sources
Bibliographic data: Semantic Scholar, OpenAlex, Crossref.
Contains information from the Semantic Scholar Academic Graph Datasets, made available under the ODC Attribution License (ODC-BY 1.0).
Semantic Scholar’s data is described in: Kinney, R., et al. (2023). The Semantic Scholar Open Data Platform. arXiv:2301.10140.
