

The DOI matches its Crossref record; 48 of the 50 references it cites were found in a registry or an index.
Continuous Fixed Bed CO2 Adsorption: Breakthrough, Column Efficiency, Mass Transfer Zone
Open accessAbstract
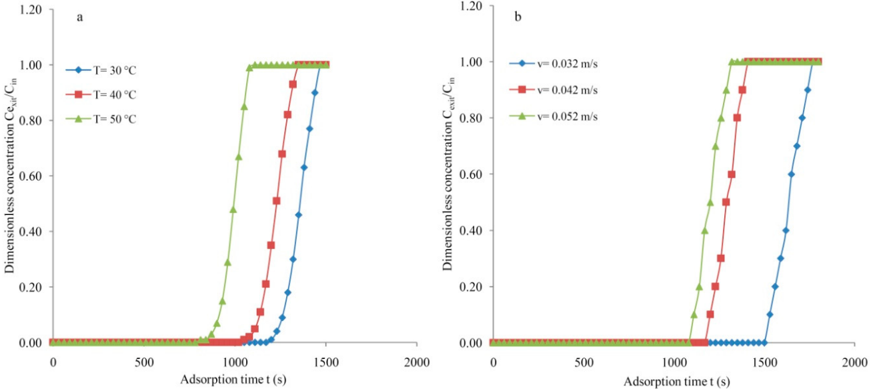
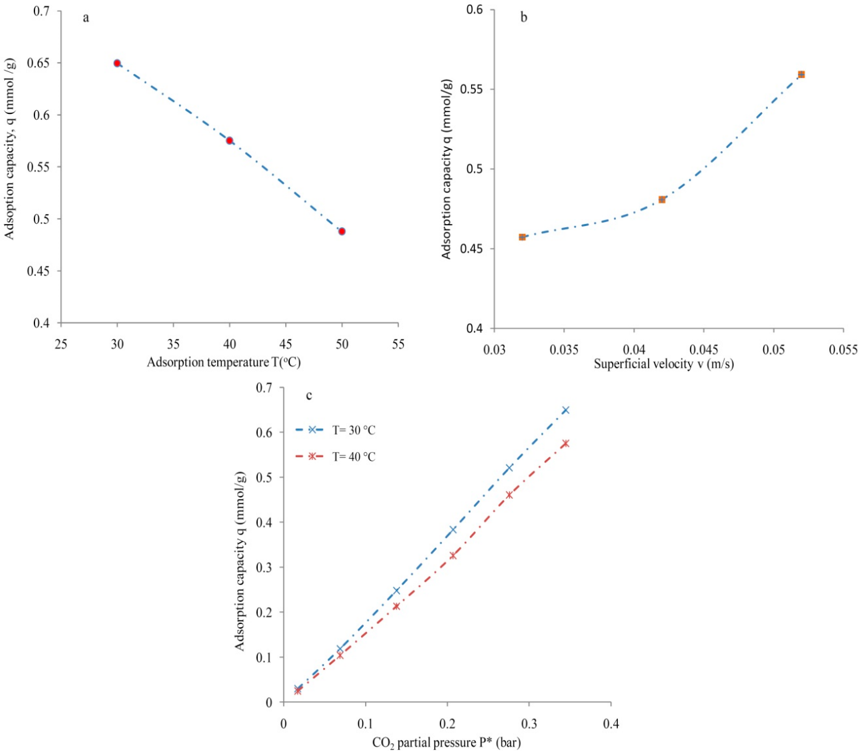
The increased levels of carbon dioxide in the environment have incited the search for breakthrough technologies to lessen its impact on climate. The CO2 capture from a mixture of CO2/N2 was studied using a molecular sieve (MS) and silica gel type-III. The breakthrough behavior was predicted as a function of temperature, superficial velocity, and CO2 partial pressure. The breakpoint time reduced significantly with increased temperature and increased superficial velocity. The CO2 adsorption capacity increased appreciably with decreased temperature and increased CO2 pressure. The saturation CO2 adsorption capacity from the CO2/N2 mixture reduced appreciably with increased temperature. The molecular sieve contributed to higher adsorption capacity, and the highest CO2 uptake of 0.665 mmol/g was realized for MS. The smaller width of the mass transfer zone and higher column efficiency of 87.5% for MS signify the efficient use of the adsorbent; this lowers the regeneration cost. The findings suggest that a molecular sieve is suitable for CO2 capture due to high adsorption performance owing to better adsorption characteristic parameters.
Overview
The claims and statistics of this paper haven’t been checked yet.
Free: it reads the open-access text and checks the first 5 claims that cite a source we can check. Create a free account to check every claim.
Integrity signals
Registry
Cites
Statistics
Figures

Verification
Claims the paper makes
The claims and statistics of this paper haven’t been checked yet.
Free: it reads the open-access text and checks the first 5 claims that cite a source we can check. Create a free account to check every claim.
Self-check
Percentages, sums and reported differences re-computed from the paper’s own numbers.
The self-check needs the paper’s full text.
Citations
Cites
Advances in CO2 capture technology—The U.S. Department of Energy's Carbon Sequestration Program
Figueroa, J. D., Fout, T., Plasynski, S., McIlvried, H., & Srivastava, R. D. (2008) · International Journal of Greenhouse Gas Control · doi:10.1016/s1750-5836(07)00094-1 · Cited by 2,281
Progress in carbon dioxide separation and capture: A review
Yang, H., Xu, Z., Fan, M., Gupta, R., Slimane, R. B., Bland, A. E., & Wright, I. (2008) · Journal of Environmental Sciences · doi:10.1016/s1001-0742(08)60002-9 · Cited by 2,087
Carbon dioxide capture-related gas adsorption and separation in metal-organic frameworks
Li, J.-R., Ma, Y., McCarthy, M. C., Sculley, J., Yu, J., Jeong, H.-K., Balbuena, P. B., & Zhou, H.-C. (2011) · Coordination Chemistry Reviews · doi:10.1016/j.ccr.2011.02.012 · Cited by 2,019
An overview of CO2 capture technologies
MacDowell, N., Florin, N., Buchard, A., Hallett, J., Galindo, A., Jackson, G., Adjiman, C. S., Williams, C. K., Shah, N., & Fennell, P. (2010) · Energy & Environmental Science · doi:10.1039/c004106h · Cited by 1,636
Adsorption Equilibrium of Methane, Carbon Dioxide, and Nitrogen on Zeolite 13X at High Pressures
Cavenati, S., Grande, C. A., & Rodrigues, A. E. (2004) · Journal of Chemical & Engineering Data · doi:10.1021/je0498917 · Cited by 1,147
Gibbins, J., & Chalmers, H. (2008) · Energy Policy · doi:10.1016/j.enpol.2008.09.058 · Cited by 1,088
Membrane technologies for CO2 separation
Brunetti, A., Scura, F., Barbieri, G., & Drioli, E. (2010) · Journal of Membrane Science · doi:10.1016/j.memsci.2009.11.040 · Cited by 999
Adsorption of CO2 on Molecular Sieves and Activated Carbon
Siriwardane, R. V., Shen, M.-S., Fisher, E. P., & Poston, J. A. (2001) · Energy & Fuels · doi:10.1021/ef000241s · Cited by 943
Microporous metal-organic framework with potential for carbon dioxide capture at ambient conditions
Xiang, S., He, Y., Zhang, Z., Wu, H., Zhou, W., Krishna, R., & Chen, B. (2012) · Nature Communications · doi:10.1038/ncomms1956 · Cited by 875
Comparative Study of CO2 Capture by Carbon Nanotubes, Activated Carbons, and Zeolites
Lu, C., Bai, H., Wu, B., Su, F., & Hwang, J. F. (2008) · Energy & Fuels · doi:10.1021/ef8000086 · Cited by 422
Research works printed but not linked: 2
- Spin, 2011, Improving the gas solids contact efficiency in a fluidized bed of carbon dioxide adsorbent fine particles, Phys. Chem. Chem. Phys., 13, 4906
- McCabe, W.L., Smith, J.C., and Harriott, P. (1993). Unit Operation of Chemical Engineering, McGraw-Hill Editions. [5th ed.].
Cited by
Shaping of MIL-53-Al and MIL-101 MOF for CO2/CH4, CO2/N2 and CH4/N2 separation
Singh, N., Dalakoti, S., Sharma, A., Chauhan, R., Murali, R. S., Divekar, S., Dasgupta, S., & Aarti, A. (2024) · Separation and Purification Technology · doi:10.1016/j.seppur.2024.126820 · Cited by 79
Rahman, M. M. (2024) · South African Journal of Chemical Engineering · doi:10.1016/j.sajce.2024.02.006 · Cited by 75
Rahman, M. M., Maniruzzaman, M., ealam, N., Mahmud, P., Khatun, S., Hossain, M. A., Hossain, M. I., Hasanuzzaman, M., Alam, M. A., Al-Amin, M., et al. (2025) · Carbohydrate Polymer Technologies and Applications · doi:10.1016/j.carpta.2025.100698 · Cited by 63
Sharma, S., Balestra, S. R. G., Baur, R., Agarwal, U., Zuidema, E., Rigutto, M. S., Calero, S., Vlugt, T. J. H., & Dubbeldam, D. (2023) · Molecular Simulation · doi:10.1080/08927022.2023.2202757 · Cited by 60
Garg, R., & Sabouni, R. (2023) · Chemosphere · doi:10.1016/j.chemosphere.2023.140163 · Cited by 52
Metadata
- Authors
- Mesfer, M. K. A., Danish, M., Khan, M. I., Ali, I. H., Hasan, M., & Jery, A. E.
- Affiliations
- King Khalid University (SA)
- Chemical Engineering Department, College of Engineering, King Khalid University, Abha 61411, Saudi Arabia
- Corresponding author
- Danish, Mohd
- ORCID
- Venue
- Processes
- Publisher
- MDPI AG
- Published
- 2020-10-01
- Volume
- 8
- Issue
- 10
- Pages
- 1233
- ISSN
- 2227-9717 (ISSN-L)
- OpenAlex
- W3091484225
- Cited by
- 73
- References
- 50
- Citations by year
- 2026: 20 · 2025: 27 · 2024: 12 · 2023: 7 · 2022: 2 · 2021: 5
- FWCI
- 1.72
- Type
- journal article
- Language
- en
- Open access
- gold
- doi.org
- Licence
- Locations
- Processes (publishedVersion, cc-by)
- DOAJ (DOAJ: Directory of Open Access Journals) (submittedVersion, cc-by-sa)
- Funders
- Deanship of Scientific Reserach, King Khalid University (R.G.P1./97/40)
- Topics
- Physical Sciences › Chemical Engineering › Filtration and Separation › Carbon Dioxide Capture Technologies
- Physical Sciences › Environmental Science › Environmental Engineering › CO2 Sequestration and Geologic Interactions
- Physical Sciences › Engineering › Computational Mechanics › Granular flow and fluidized beds
- Keywords
- CO2 capture, CO2 adsorption, fixed-bed adsorption, breakthrough time, column efficiency, mass transfer zone, molecular sieves, CO2-N2 mixtures, adsorption capacity, temperature effects, superficial gas velocity, adsorbent regeneration
About these checks
Registry, retraction, Cites and statistics results are computed, not judged, with one exception: a printed reference that no index lists is read once by a model before it counts as a citation error. Claims are extracted by a model and kept only when their quote appears verbatim in the text; each cited source is then checked, with a model’s help, for whether it says what the claim relies on. Those verdicts can be wrong — read the claim’s quote and the cited source before relying on one.
Statistics and arithmetic are recomputed, not judged.
Confidence bands are shown only for fields calibrated on our annotated test set. None is calibrated yet, so no band is shown.
What counts as a claim ›How we measure confidence ›How we check this ›
Are you an author, or do you see a problem with this page? Request a review
How to cite
Cite CoChat for the checks on this page, and the paper for its own findings.
- This page
- CoChat. (2026). Citation check: Continuous Fixed Bed CO2 Adsorption: Breakthrough, Column Efficiency, Mass Transfer Zone. https://app.cochat.ai/papers/10.3390/pr8101233
- The paper
- Mesfer, M. K. A., Danish, M., Khan, M. I., Ali, I. H., Hasan, M., & Jery, A. E. (2020). Continuous Fixed Bed CO2 Adsorption: Breakthrough, Column Efficiency, Mass Transfer Zone. Processes. https://doi.org/10.3390/pr8101233
Data sources
Bibliographic data: Semantic Scholar, OpenAlex, Crossref.
Contains information from the Semantic Scholar Academic Graph Datasets, made available under the ODC Attribution License (ODC-BY 1.0).
Semantic Scholar’s data is described in: Kinney, R., et al. (2023). The Semantic Scholar Open Data Platform. arXiv:2301.10140.
