

The DOI matches its Crossref record; 4 of the 4 references it cites were found in a registry or an index.
Comparison of Different Label-Free Techniques for the Semi-Absolute Quantification of Protein Abundance
Open accessPublished version of a preprint
Abstract
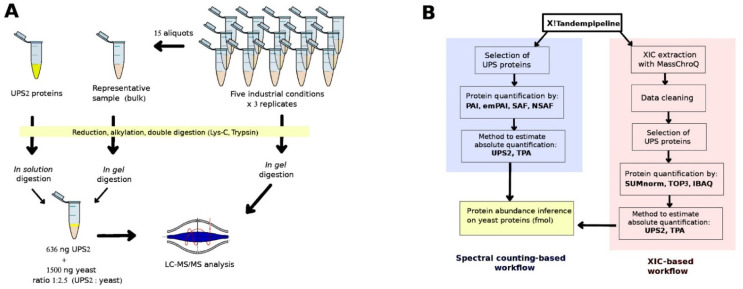
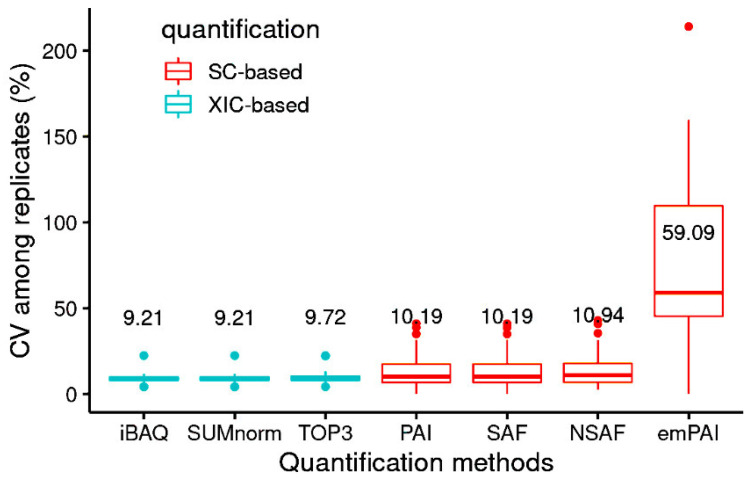
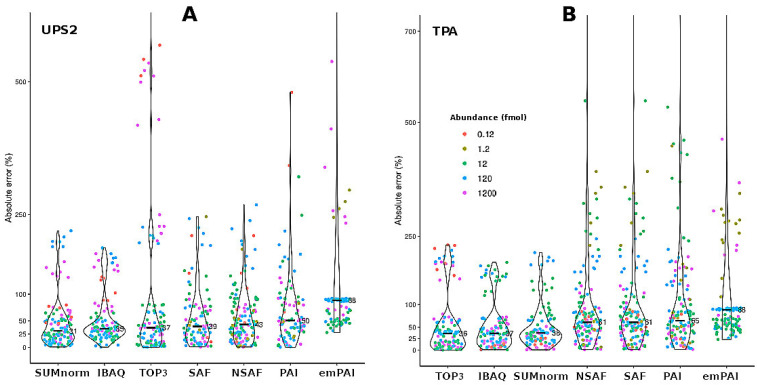
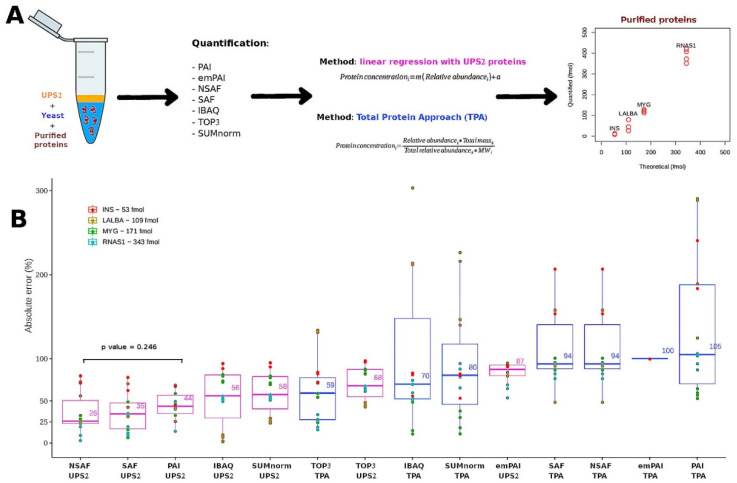
In proteomics, it is essential to quantify proteins in absolute terms if we wish to compare results among studies and integrate high-throughput biological data into genome-scale metabolic models. While labeling target peptides with stable isotopes allow protein abundance to be accurately quantified, the utility of this technique is constrained by the low number of quantifiable proteins that it yields. Recently, label-free shotgun proteomics has become the “gold standard” for carrying out global assessments of biological samples containing thousands of proteins. However, this tool must be further improved if we wish to accurately quantify absolute levels of proteins. Here, we used different label-free quantification techniques to estimate absolute protein abundance in the model yeast Saccharomyces cerevisiae. More specifically, we evaluated the performance of seven different quantification methods, based either on spectral counting (SC) or extracted-ion chromatogram (XIC), which were applied to samples from five different proteome backgrounds. We also compared the accuracy and reproducibility of two strategies for transforming relative abundance into absolute abundance: a UPS2-based strategy and the total protein approach (TPA). This study mentions technical challenges related to UPS2 use and proposes ways of addressing them, including utilizing a smaller, more highly optimized amount of UPS2. Overall, three SC-based methods (PAI, SAF, and NSAF) yielded the best results because they struck a good balance between experimental performance and protein quantification.
Overview
The claims and statistics of this paper haven’t been checked yet.
Run the check — free, no account needed. It reads the open-access text and checks the sources it cites.
Integrity signals
Registry
Cites
Statistics
Figures
Verification
Claims the paper makes
The claims and statistics of this paper haven’t been checked yet.
Run the check — free, no account needed. It reads the open-access text and checks the sources it cites.
Self-check
Percentages, sums and reported differences re-computed from the paper’s own numbers.
The self-check needs the paper’s full text.
Citations
Cites
Global quantification of mammalian gene expression control
Schwanhäusser, B., Busse, D., Li, N., Dittmar, G., Schuchhardt, J., Wolf, J., Chen, W., & Selbach, M. (2011) · Nature · doi:10.1038/nature10098 · Cited by 6,566 · cited 3×
“Another widely used method for comparing proteins within samples is intensity-based absolute quantification (iBAQ) [7], which is equivalent to PAI but uses peptide intensities instead of SC.”
BackgroundMethodAbsolute Quantification of Proteins by LCMSE
Silva, J. C., Gorenstein, M. V., Li, G.-Z., Vissers, J. P. C., & Geromanos, S. J. (2006) · Molecular & Cellular Proteomics · doi:10.1074/mcp.m500230-mcp200 · Cited by 1,529
A “Proteomic Ruler” for Protein Copy Number and Concentration Estimation without Spike-in Standards
Wiśniewski, J. R., Hein, M. Y., Cox, J., & Mann, M. (2014) · Molecular & Cellular Proteomics · doi:10.1074/mcp.m113.037309 · Cited by 690
Genome scale models of yeast: towards standardized evaluation and consistent omic integration
Sánchez, B. J., & Nielsen, J. (2015) · Integrative Biology · doi:10.1039/c5ib00083a · Cited by 75
Research works printed but not linked: 41
- Ankney, 2018, Relative and Absolute Quantitation in Mass Spectrometry–Based Proteomics, Annu. Rev. Anal. Chem., 11, 49, 10.1146/annurev-anchem-061516-045357 · DOI
- Zivy, 2016, Thousand and one ways to quantify and compare protein abundances in label-free bottom-up proteomics, Biochim. Biophys. Acta (BBA)—Proteins Proteom., 1864, 883, 10.1016/j.bbapap.2016.02.019 · DOI
- Rappsilber, 2002, Large-Scale Proteomic Analysis of the Human Spliceosome, Genome Res., 12, 1231, 10.1101/gr.473902 · DOI
- Ishihama, 2005, Exponentially Modified Protein Abundance Index (emPAI) for Estimation of Absolute Protein Amount in Proteomics by the Number of Sequenced Peptides per Protein, Mol. Cell. Proteom., 4, 1265, 10.1074/mcp.M500061-MCP200 · DOI · Paper page
- Bubis, 2017, Comparative evaluation of label-free quantification methods for shotgun proteomics, Rapid Commun. Mass Spectrom., 31, 606, 10.1002/rcm.7829 · DOI
- Dowle, 2016, Comparing the Diagnostic Classification Accuracy of iTRAQ, Peak-Area, Spectral-Counting, and emPAI Methods for Relative Quantification in Expression Proteomics, J. Proteome Res., 15, 3550, 10.1021/acs.jproteome.6b00308 · DOI
- Gerber, 2003, Absolute quantification of proteins and phosphoproteins from cell lysates by tandem MS, Proc. Natl. Acad. Sci. USA, 100, 6940, 10.1073/pnas.0832254100 · DOI · Paper page
- Kirkpatrick, 2005, The absolute quantification strategy: A general procedure for the quantification of proteins and post-translational modifications, Methods, 35, 265, 10.1016/j.ymeth.2004.08.018 · DOI
- Brun, 2007, Isotope-labeled Protein Standards: Toward Absolute Quantitative Proteomics, Mol. Cell. Proteom., 6, 2139, 10.1074/mcp.M700163-MCP200 · DOI
- Mathis, 2019, Protein profile of dairy products: Simultaneous quantification of twenty bovine milk proteins, Int. Dairy J., 97, 167, 10.1016/j.idairyj.2019.01.001 · DOI
- Monk, 2014, Optimizing genome-scale network reconstructions, Nat. Biotechnol., 32, 447, 10.1038/nbt.2870 · DOI
- Ross, 2004, Multiplexed Protein Quantitation in Saccharomyces cerevisiae Using Amine-reactive Isobaric Tagging Reagents, Mol. Cell. Proteom., 3, 1154, 10.1074/mcp.M400129-MCP200 · DOI · Paper page
- Choe, 2007, 8-Plex quantitation of changes in cerebrospinal fluid protein expression in subjects undergoing intravenous immunoglobulin treatment for Alzheimer’s disease, Proteomics, 7, 3651, 10.1002/pmic.200700316 · DOI
- Werner, 2012, High-Resolution Enabled TMT 8-plexing, Anal. Chem., 84, 7188, 10.1021/ac301553x · DOI
- Ostasiewicz, 2012, Extensive quantitative remodeling of the proteome between normal colon tissue and adenocarcinoma, Mol. Syst. Biol., 8, 611, 10.1038/msb.2012.44 · DOI · Paper page
- Lahtvee, 2020, Benchmarking Accuracy and Precision of Intensity-Based Absolute Quantification of Protein Abundances in Saccharomyces cerevisiae, Proteomics, 21, 2000093
- Vildhede, 2015, Comparative Proteomic Analysis of Human Liver Tissue and Isolated Hepatocytes with a Focus on Proteins Determining Drug Exposure, J. Proteome Res., 14, 3305, 10.1021/acs.jproteome.5b00334 · DOI
- Belouah, 2019, Modeling Protein Destiny in Developing Fruit, Plant Physiol., 180, 1709, 10.1104/pp.19.00086 · DOI
- Belouah, 2020, Transcriptomic and proteomic data in developing tomato fruit, Data Brief, 28, 105015, 10.1016/j.dib.2019.105015 · DOI
- Sabatier, 2018, Dynamic Proteomics Reveals High Plasticity of Cellular Proteome: Growth-Related and Drug-Induced Changes in Cancer Cells are comparable, Proteomics, 18, e1800118, 10.1002/pmic.201800118 · DOI
- Esoufi, 2015, Characterization of the E. coli proteome and its modifications during growth and ethanol stress, Front. Microbiol., 6, 103
- Carpy, 2014, Absolute Proteome and Phosphoproteome Dynamics during the Cell Cycle of Schizosaccharomyces pombe (Fission Yeast), Mol. Cell. Proteom., 13, 1925, 10.1074/mcp.M113.035824 · DOI
- Molzahn, 2013, Critical assessment of proteome-wide label-free absolute abundance estimation strategies, Proteomics, 13, 2567, 10.1002/pmic.201300135 · DOI · Paper page
- Trudgian, 2011, Comparative evaluation of label-free SINQ normalized spectral index quantitation in the central proteomics facilities pipeline, Proteomics, 11, 2790, 10.1002/pmic.201000800 · DOI
- Krey, 2014, Accurate Label-Free Protein Quantitation with High- and Low-Resolution Mass Spectrometers, J. Proteome Res., 13, 1034, 10.1021/pr401017h · DOI
- Wu, 2014, Improved accuracy for label-free absolute quantification of proteome by combining the absolute protein expression profiling algorithm and summed tandem mass spectrometric total ion current, Analyst, 139, 138, 10.1039/C3AN01738A · DOI
- Smits, 2014, Global absolute quantification reveals tight regulation of protein expression in single Xenopus eggs, Nucleic Acids Res., 42, 9880, 10.1093/nar/gku661 · DOI
- Kilani, 2020, Comparative quantitative proteomics of osmotic signal transduction mutants in Botrytis cinerea explain mutant phenotypes and highlight interaction with cAMP and Ca2+ signalling pathways, J. Proteom., 212, 103580, 10.1016/j.jprot.2019.103580 · DOI
- Doughty, 2020, Stress-induced expression is enriched for evolutionarily young genes in diverse budding yeasts, Nat. Commun., 11, 2144, 10.1038/s41467-020-16073-3 · DOI
- Langella, 2017, X!TandemPipeline: A Tool to Manage Sequence Redundancy for Protein Inference and Phosphosite Identification, J. Proteome Res., 16, 494, 10.1021/acs.jproteome.6b00632 · DOI
- Houel, 2005, PROTICdb: A web-based application to store, track, query, and compare plant proteome data, Proteomics, 5, 2069, 10.1002/pmic.200401111 · DOI
- Langella, 2013, Management and dissemination of MS proteomic data with PROTICdb: Example of a quantitative comparison between methods of protein extraction, Proteomics, 13, 1457, 10.1002/pmic.201200564 · DOI
- Langella, 2007, The PROTICdb Database for 2-DE Proteomics, Methods Mol. Bio., 355, 279
- Vizcaino, 2014, ProteomeXchange provides globally coordinated proteomics data submission and dissemination, Nat. Biotechnol., 32, 223, 10.1038/nbt.2839 · DOI
- Zybailov, 2006, Statistical Analysis of Membrane Proteome Expression Changes in Saccharomyces cerevisiae, J. Proteome Res., 5, 2339, 10.1021/pr060161n · DOI
- Valot, 2011, MassChroQ: A versatile tool for mass spectrometry quantification, Proteomics, 11, 3572, 10.1002/pmic.201100120 · DOI
- Henry, 2017, Quantitative Proteomics Analysis Confirmed Oxidative Metabolism Predominates in Streptomyces coelicolor versus Glycolytic Metabolism in Streptomyces lividans, J. Proteome Res., 16, 2597, 10.1021/acs.jproteome.7b00163 · DOI
- Ning, 2012, Comparative Analysis of Different Label-Free Mass Spectrometry Based Protein Abundance Estimates and Their Correlation with RNA-Seq Gene Expression Data, J. Proteome Res., 11, 2261, 10.1021/pr201052x · DOI
- Tsou, 2015, DIA-Umpire: Comprehensive computational framework for data-independent acquisition proteomics, Nat. Methods, 12, 258, 10.1038/nmeth.3255 · DOI
- Cook, 2000, Detection of Influential Observation in Linear Regression, Technometrics, 42, 65, 10.1080/00401706.2000.10485981 · DOI
- Muntel, 2014, Comprehensive Absolute Quantification of the Cytosolic Proteome of Bacillus subtilis by Data Independent, Parallel Fragmentation in Liquid Chromatography/Mass Spectrometry (LC/MSE), Mol. Cell. Proteom., 13, 1008, 10.1074/mcp.M113.032631 · DOI
Metadata
- Authors
- Millán-Oropeza, A., Blein-Nicolas, M., Monnet, V., Zivy, M., & Henry, C.
- Affiliations
- AgroParisTech (FR)
- PAPPSO, INRAE, CNRS, AgroParisTech, GQE-Le Moulon, Université Paris-Saclay, 91190 Gif-sur-Yvette, France
- Centre National de la Recherche Scientifique (FR)
- Corresponding author
- Millán-Oropeza, Aarón
- Venue
- Proteomes
- Publisher
- MDPI AG
- Published
- 2022-01-07
- Volume
- 10
- Issue
- 1
- Pages
- 2
- ISSN
- 2227-7382 (ISSN-L)
- PMC
- PMC8788469
- OpenAlex
- W4226251097
- Cited by
- 28
- References
- 4
- Citations by year
- 2026: 5 · 2025: 7 · 2024: 8 · 2023: 6 · 2022: 2
- FWCI
- 2.07
- Type
- journal article
- Language
- en
- Open access
- gold
- doi.org
- Licence
- Locations
- Proteomes (publishedVersion, cc-by)
- Preprints.org (acceptedVersion, cc-by)
- PubMed Central (publishedVersion, cc-by)
- PubMed (publishedVersion)
- HAL (submittedVersion, other-oa)
- DOAJ (DOAJ: Directory of Open Access Journals) (submittedVersion, cc-by-sa)
- Funders
- European Union’s Horizon 2020 research programme and the CHASSY innovation program (720824)
- Topics
- Physical Sciences › Chemistry › Spectroscopy › Advanced Proteomics Techniques and Applications
- Life Sciences › Biochemistry, Genetics and Molecular Biology › Molecular Biology › Bioinformatics and Genomic Networks
- Life Sciences › Biochemistry, Genetics and Molecular Biology › Molecular Biology › Advanced Biosensing Techniques and Applications
- Keywords
- absolute protein quantification, label-free quantification, spectral counting, extracted ion chromatograms, protein abundance, Saccharomyces cerevisiae, proteomics, genome-scale metabolic models
About these checks
Registry, retraction, Cites and statistics results are computed, not judged, with one exception: a printed reference that no index lists is read once by a model before it counts as a citation error. Claims are extracted by a model and kept only when their quote appears verbatim in the text; each cited source is then checked, with a model’s help, for whether it says what the claim relies on. Those verdicts can be wrong — read the claim’s quote and the cited source before relying on one.
Statistics and arithmetic are recomputed, not judged.
Confidence bands are shown only for fields calibrated on our annotated test set. None is calibrated yet, so no band is shown.
What counts as a claim ›How we measure confidence ›How we check this ›
Are you an author, or do you see a problem with this page? Request a review
