

A Machine Learning-Based Quality Control Algorithm for Heavy Rainfall Using Multi-Source Data
Open accessThe DOI matches its Crossref record; 39 of the 85 references it cites were found in a registry or an index, and 6 are not checked yet; 8 of the 62 sources its claims cite were checked for support.
Abstract
In this study, a machine learning-based quality control algorithm for heavy rainfall was developed by integrating automatic weather station observations with remote sensing data, minute-level data, and metadata.
Verified 2026-11-22 · 6 references not checked yet
Overview
CoChat Summary
TL;DR
This study develops a machine-learning quality-control algorithm for heavy rainfall by fusing automatic weather station observations with radar, satellite, minute-level, and metadata inputs. Gradient-boosting models outperformed conventional MDOS threshold checks, with XGBoost achieving the best test-set precision, recall, and F1-score.
Key findings
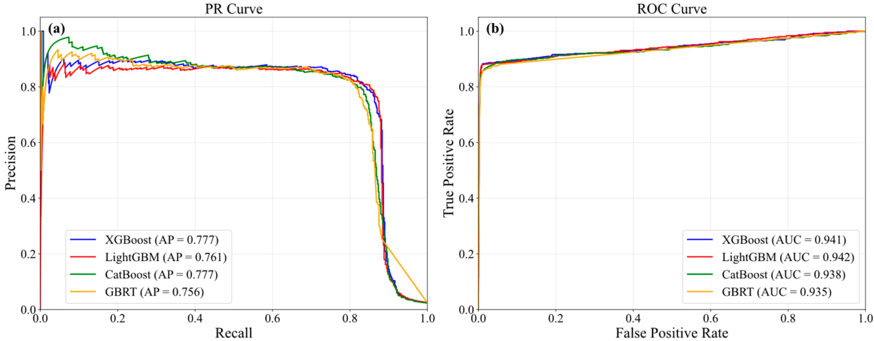
- All four gradient-boosting models (XGBoost, LightGBM, CatBoost, GBRT) outperformed the conventional MDOS QC method on the testing set. XGBoost achieved precision 0.844, recall 0.789, and F1-score 0.816, corresponding to increases over MDOS of 0.110 in precision, 0.162 in recall, and 0.140 in F1-score.
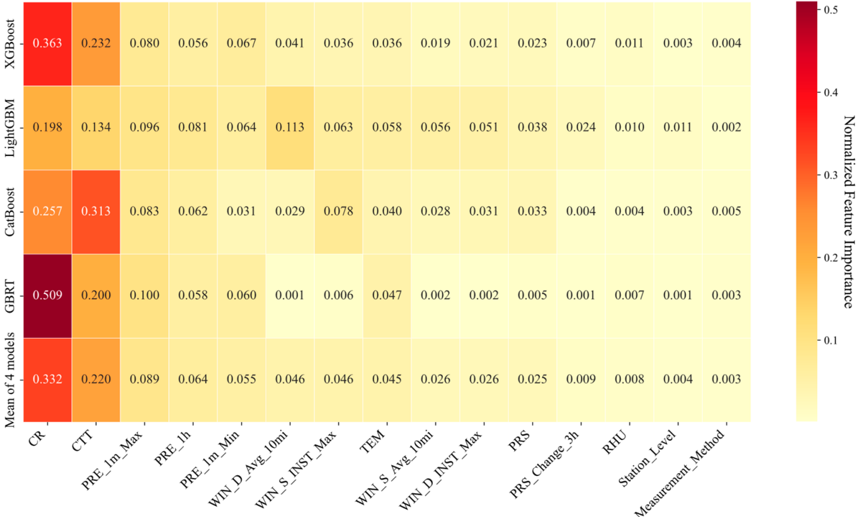
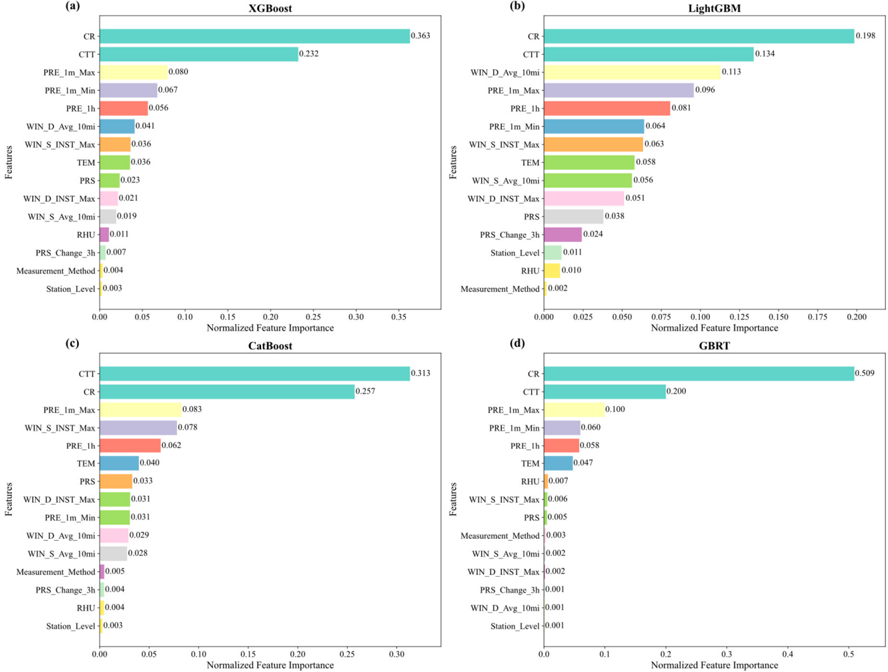
- Remote sensing and minute-level precipitation features dominated model predictions. Mean normalized feature importance was 0.332 for composite reflectivity (CR) and 0.220 for cloud-top temperature (CTT); among precipitation features, PRE_1m_Max, PRE_1h, and PRE_1m_Min had mean importance values of 0.089, 0.064, and 0.055.
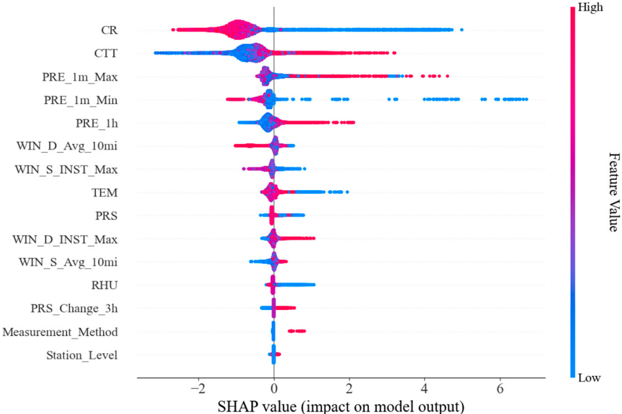
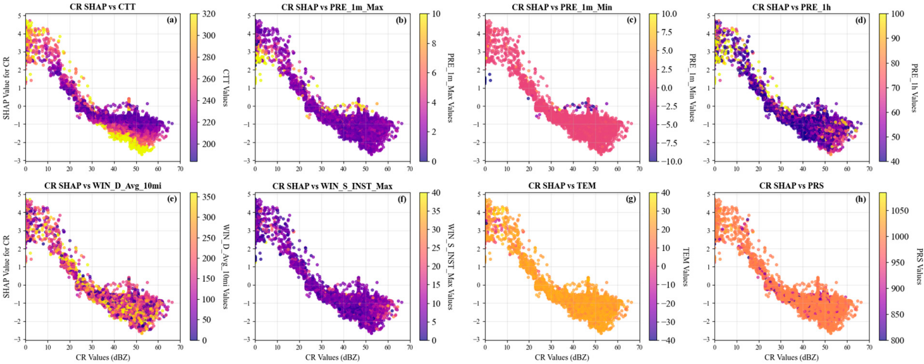
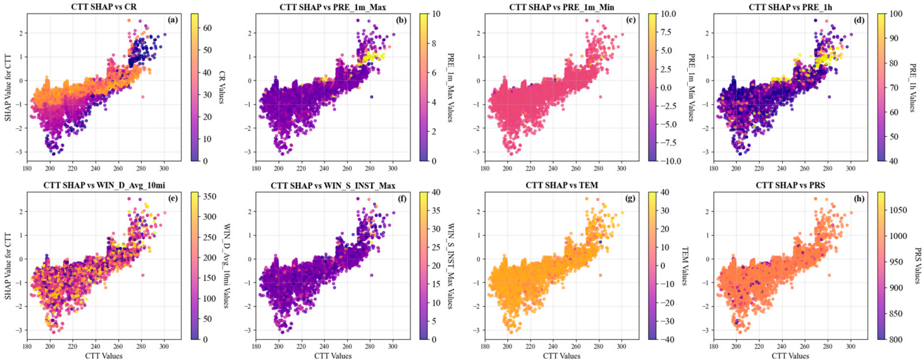
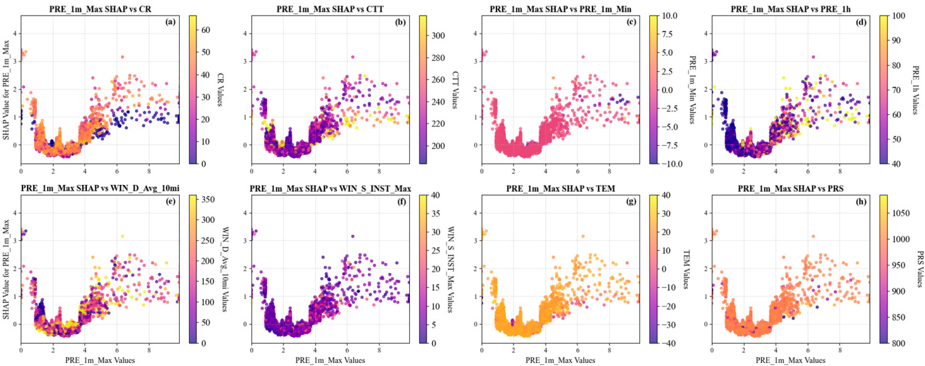
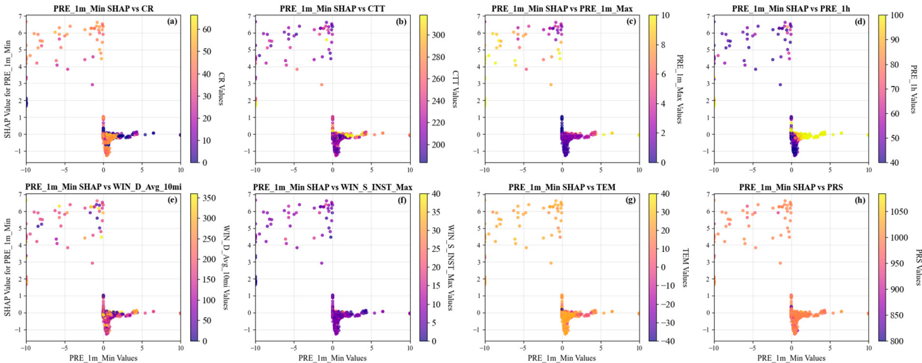
- SHAP analysis showed physically consistent decision logic: low CR (<20 dBZ) combined with hourly precipitation >70 mm or CTT >260 K, high CTT with low CR or high precipitation, PRE_1m_Max <0.5 mm or >3.5 mm, and negative PRE_1m_Min were flagged as anomalous.
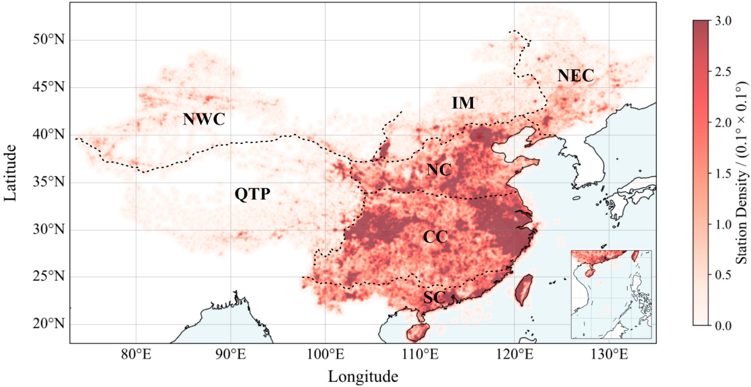
- Performance varied seasonally and spatially: monthly accuracy ranged 0.990–0.997 and precision 0.839–0.866; summer recall/F1 were lower (0.763–0.772 and 0.802–0.807) than winter (0.932–0.947 and 0.886–0.901). Northwestern and high-latitude regions had F1-scores above 0.93, while South China had the lowest recall (0.737) and F1-score (0.786).
Methods
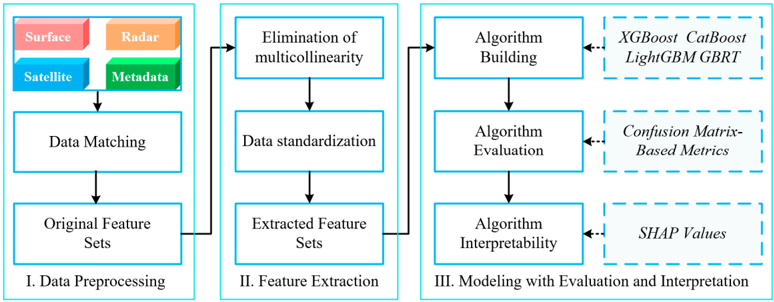
- Data covered 1 June 2022 to 31 December 2024 across China, focusing on hourly precipitation >40 mm. The total dataset contained 127,889 samples, split into 74,176 training, 21,741 validation, and 31,972 testing samples (ratio 5.8:1.7:2.5). Inputs included AWS hour-level and minute-level observations, radar CR, FY-4B CTT, and metadata.
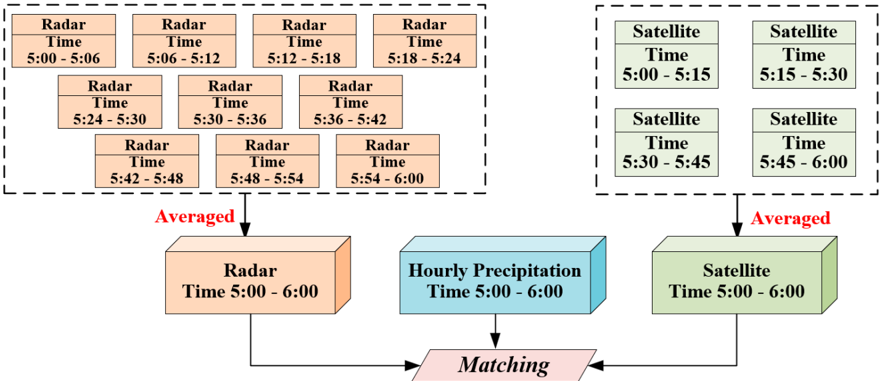
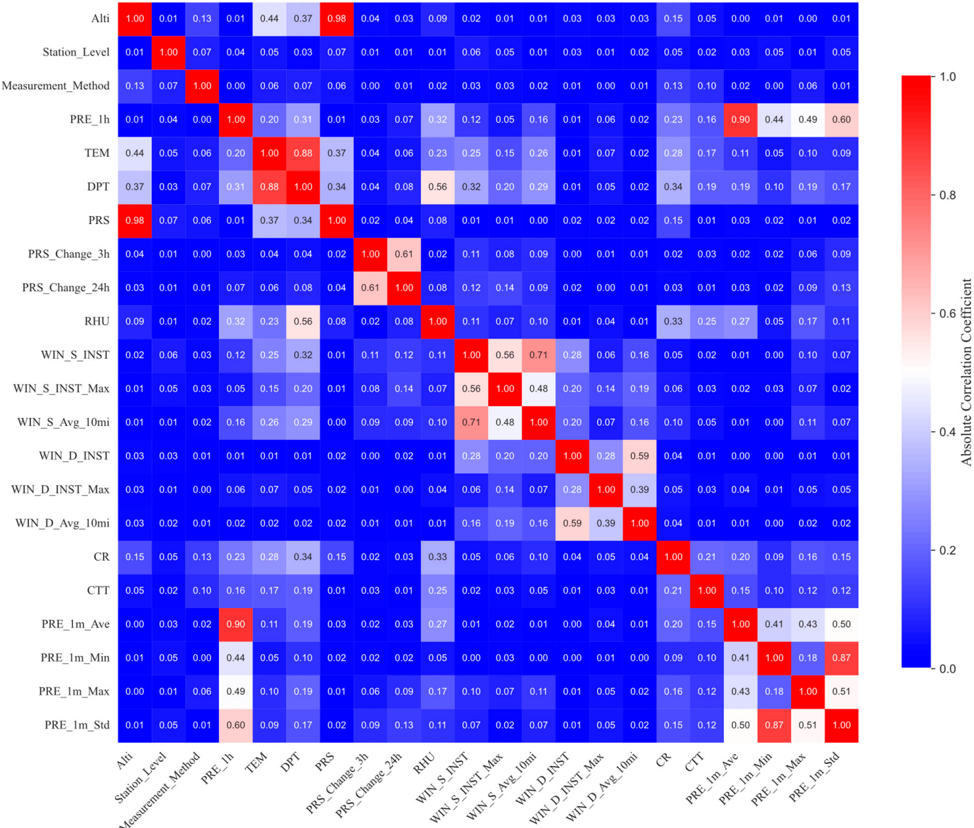
- Feature engineering used a sliding average temporal window for remote sensing matching and spatial nearest-neighbor averaging of five grid points. Pearson correlation with |r| > 0.5 removed 7 of 22 features, retaining 15; Z-score normalization was applied. Four gradient-boosting models were trained with Optuna hyperparameter optimization using 5-fold cross-validation.
- Evaluation used confusion-matrix metrics (accuracy, precision, recall, F1-score), PR and ROC curves, comparison against MDOS QC, independent validation, monthly and seven-region performance assessment, and Tree SHAP interpretability.
Limitations
- The paper states that surface observational data, radar data, and metadata are not publicly available due to Chinese national security and confidentiality policies; only satellite data are available. It also states future work is needed for spatiotemporally adaptive algorithms, expanded multi-year data, a unified multi-class QC system for all precipitation types, and systematic false-alarm analysis.
- The paper notes that significant class imbalance inflated accuracy (>0.99) because normal samples greatly outnumbered anomalous ones, making precision, recall, and F1-score more diagnostic. It also notes that the manually corrected hourly precipitation QC benchmark, while treated as most accurate, has relatively poor timeliness.
- Evident from the text: performance degraded in warm-season and complex-terrain regions with heterogeneous precipitation mechanisms, especially South China, indicating limited current generalization across seasons and climatic regions.
Model-written summary. Check it against the paper before relying on it.
Integrity signals
Registry
Cites
Statistics
Figures

Verification
Claims the paper makes
5 Valid · 1 Not valid · 23 Not checked · 86 Own results and interpretations
The cited sources support only part of this claim — read each source’s verdict below.
In the paper
“With the advancement of ground-and satellite-based observation technologies and the explosive growth of meteorological data, multi-source data collaborative QC for precipitation has demonstrated significant advantages [27][28][29][30][31].”
§ A Machine Learning-Based Quality Control Algorithm for Heavy Rainfall Using Multi-Source Data > 1. Introduction
What the sources say
- Partly supportedcites [27] 28. Zhong, L.; Zhang, Z.; Chen, L.; Yang, J.; Zou, F. Application of the Doppler weather radar in real-time quality control of hourly gauge precipitation in eastern China. Atmos. Res. 2016, 172, 109-118. [CrossRef] sourceExperimental — accuracy not yet measured
Our copy of Zhong et al. (2016) does demonstrate an advantage from coupling two observation sources: the Introduction states they 'establish a link between radar QPE products and hourly rain gauge records' to 'enhance the current real-time operational quality control technique', and the Abstract reports the radar-supported RS_ORQC correct rate of ~99.95% below 10 mm h-1 and 96.21% above 10 mm h-1, improving on the gauge-only ORQC method that 'might make erroneous judgments for heavy precipitation'. However, the claim's framing is broader than this source: it is about multi-source collaborative QC driven by ground- AND satellite-based observation advances and the explosive growth of meteorological data, whereas the paper uses only S-band Doppler radar plus the automatic gauge network over eastern China in JJA 2010-2011, and its Discussion explicitly limits itself ('we merely use SA weather radar data ... consider liquid precipitation ... not suitable for hail'), mentioning space-borne radar (PR, DPR) only as a future possibility for mountainous areas rather than a demonstrated benefit. So the satellite/multi-source and 'explosive data growth' elements of what is attributed here are not supported by this paper. (LLM, conf=0.72)
- Partly supportedcites [28] 29. Ośródka, K.; Otop, I.; Szturc, J. Automatic quality control of telemetric rain gauge data providing quantitative quality information (Rain Gauge QC). Atmos. Meas. Tech. 2022, 15, 5581-5597. [CrossRef] sourceExperimental — accuracy not yet measured
Our copy does show a benefit of bringing other data sources into precipitation QC: the Radar Conformity Check (§3.5) uses radar, 'which quite reliably indicate the spatial distribution of precipitation', and the conclusions (§4.4, point 4) state that 'the case study proved that the RainGaugeQC system can identify regionally inconsistent data thanks to the use of radar data as well as neighbouring rain gauge data'. However, the paper frames multi-source checks only as 'more complex ones' (§1.2) rather than demonstrating 'significant advantages', it cautions in §1.2 that 'the use of data from other measurement systems is not a satisfactory solution, as these data are generally inconsistent with each other due to their different spatial distributions', and it ties effectiveness to locally available reference data (§4.4, point 5). Satellite-based collaborative QC and the 'explosive growth of meteorological data' invoked by the citing sentence are not addressed; satellite fields appear only as case-study comparison data (§2.3, §4.2). (LLM, conf=0.70)
- Supportedcites [29] 30. Yan, Q.; Zhang, B.; Jiang, Y.; Liu, Y.; Yang, B.; Wang, H. Quality control of hourly rain gauge data based on radar and satellite multi-source data. J. Hydroinform. 2024, 26, 1042-1058. [CrossRef] source
The Introduction (Section 1) frames multi-source QCs as having been 'developed to increase the efficiency of gauge precipitation QC by introducing data from different observation systems', in contrast to single-source procedures that are 'resource-intensive and can cause delays'. The Discussion (Section 4) demonstrates the advantage quantitatively: NMQC, a multi-source method using radar and satellite data, achieved a higher anomaly detection ratio (1.73‰ vs 0.62‰) and only 1.73% suspicious data versus 70.97% for the operationally used single-source QC, and the Abstract adds that it 'can greatly reduce manual intervention and shorten the impact time of anomaly data'. As a broad background statement backed by several citations, our copy clearly treats multi-source collaborative QC as advantageous. (LLM, conf=0.85)
boostedstates a cause- Asserted: passes — The authors put it forward as true.
- Checkable: passes — It can be checked against evidence.
- Load-bearing: passes — The paper’s conclusions depend on it.
- Based: passes — The paper gives a reason why it holds.
- Partly supported
The cited sources support only part of this claim — read each source’s verdict below.
In the paper
“The machine learning-based QC algorithm enables the establishment of non-linear relationships between multi-source data and QC outcomes, facilitating the identification of potentially effective features [24,32,33].”
§ A Machine Learning-Based Quality Control Algorithm for Heavy Rainfall Using Multi-Source Data > 1. Introduction
What the sources say
- Partly supportedcites [24] 25. Yeung, H.Y.; Man, C.; Chan, S.T.; Seed, A. Development of an operational rainfall data quality-control scheme based on radar-raingauge co-kriging analysis. Hydrol. Sci. J. 2014, 59, 1293-1307. [CrossRef] sourceExperimental — accuracy not yet measured
The Introduction describes a QC scheme that combines raingauge and radar information to estimate reference rainfall and assess gauge reports. The copy does not describe it as a machine-learning algorithm or say that it learns non-linear relationships or identifies effective features; the Probability Distributions of Rainfall Residuals section instead describes residual-based thresholds. The supplied passages have no page numbers. (LLM, conf=0.83)
- Not checked — no full text of the sourcecites [32] 33. Jordan, M.I.; Mitchell, T.M. Machine learning: Trends, perspectives, and prospects. Science 2015, 349, 255-260. [CrossRef] source
- Not checked — no full text of the sourcecites [33] 34. Zhang, S.; Li, X.; Zong, M.; Zhu, X.; Wang, R. Efficient kNN classification with different numbers of nearest neighbors. IEEE Trans. Neural Netw. Learn. Syst. 2017, 29, 1774-1785. [CrossRef] source
plainstates a cause- Asserted: passes — The authors put it forward as true.
- Checkable: passes — It can be checked against evidence.
- Load-bearing: passes — The paper’s conclusions depend on it.
- Based: passes — The paper gives a reason why it holds.
- Partly supported
The cited sources support only part of this claim — read each source’s verdict below.
In the paper
“The Gradient boosting machine (GBM) was adopted in this study due to its strong capability in modeling complex non-linear relationships and handling heterogeneous, multi-source datasets commonly found in meteorological applications [54,55].”
§ A Machine Learning-Based Quality Control Algorithm for Heavy Rainfall Using Multi-Source Data > 2.3. Machine Learning Models
What the sources say
- Partly supportedcites [54] 55. Natekin, A.; Knoll, A. Gradient boosting machines, a tutorial. Front. Neurorobot. 2013, 7, 21. [CrossRef] sourceExperimental — accuracy not yet measured
Section 7.2 (page unavailable) says GBMs can capture complex non-linear dependencies, supporting that part of the claim. The passages on applications and model flexibility do not establish a capability for handling heterogeneous, multi-source datasets in meteorological applications. (LLM, conf=0.87)
- Not matchedcites [55] 56. Ayyadevara, V.K. Gradient Boosting Machine. In Pro Machine Learning Algorithms: A Hands-on Approach to Implementing Algorithms in Python and R; Apress: Berkeley, CA, USA; pp. 117-134.
Its entry has no title and year that we can search by.
boostedstates a cause- Asserted: passes — The authors put it forward as true.
- Checkable: passes — It can be checked against evidence.
- Load-bearing: passes — The paper’s conclusions depend on it.
- Based: passes — The paper gives a reason why it holds.
- Partly supported
Every source the paper cites for this claim was checked and supports it.
In the paper
“By incorporating topographic elevation data through deep neural networks and multi-scale ensemble learning techniques, the capability to detect precipitation quality anomalies in data-sparse regions such as coastal and mountainous areas has been enhanced [42].”
§ A Machine Learning-Based Quality Control Algorithm for Heavy Rainfall Using Multi-Source Data > 1. Introduction
What the sources say
- Supportedcites [42] 43. Sha, Y.; Gagne, I.I.D.J.; West, G.; Stull, R. Deep-learning-based precipitation observation quality control. J. Atmos. Ocean. Technol. 2021, 38, 1075-1091. [CrossRef] source
Split into 2 atoms — 2 confirmed, 0 partially supported, 0 disputed, 0 misattributed, 0 unverifiable. Expand the claim to see per-atom verdicts.
plainstates a cause- Asserted: passes — The authors put it forward as true.
- Checkable: passes — It can be checked against evidence.
- Load-bearing: unclear — It is unclear whether the paper’s conclusions depend on it.
- Based: passes — The paper gives a reason why it holds.
- Supported
A result the paper reports from its own data — it cites no other source for it, so there is none to check. The quote shows it is in the paper.
In the paper
“Specifically, the XGBoost in particular achieves an increase in precision by 0.110 and recall by 0.162.”
- Also stated in: § 3.2. Comparison of Performance in Different Models · plain
“Compared to the MDOS, the XGBoost model achieved an increase in precision by 0.110, recall by 0.162, and F1-score by 0.140 in the heavy rainfall QC.”
§ A Machine Learning-Based Quality Control Algorithm for Heavy Rainfall Using Multi-Source Data > Abstract
plainstates a cause- Asserted: passes — The authors put it forward as true.
- Checkable: passes — It can be checked against evidence.
- Load-bearing: passes — The paper’s conclusions depend on it.
- Based: passes — The paper gives a reason why it holds.
- Also stated in: § 3.2. Comparison of Performance in Different Models · plain
76 more claims
Create a free account to see all 115 claims and to verify the 22 references still open.
- Probably not a substantial claim. 5
- It may state two separate claims as one. 31
Self-check
Percentages, sums and reported differences re-computed from the paper’s own numbers.
Each contradiction between two passages listed here was confirmed by an independent check.
Rated major: it would touch a result — a value a result rests on, reported and recomputed p-values on opposite sides of the significance level, two passages that conflict with no sign which is right, or a cited work retracted before this paper was published.
In the paper
§ A Machine Learning-Based Quality Control Algorithm for Heavy Rainfall Using Multi-Source Data > 5. Summary and Conclusions
“| June | 0.996 | 0.842 | 0.772 | 0.805 | 6396 | | July | 0.997 | 0.856 | 0.763 | 0.807 | 8594 | | August | 0.997 | 0.839 | 0.769 | 0.802 | 6871 |”
§ A Machine Learning-Based Quality Control Algorithm for Heavy Rainfall Using Multi-Source Data > 5. Summary and Conclusions
“| XGBoost | 0.992 | 0.844 | 0.789 | 0.816 |”
Rated minor: it would not touch a result — a value no result rests on, a p-value that stays on the same side of the significance level, or a conflict that is clerical, resolved elsewhere in the paper, or outside its own findings.
In the paper
§ A Machine Learning-Based Quality Control Algorithm for Heavy Rainfall Using Multi-Source Data > 3.1. Importance Analysis
“wind direction (WIN_S_Avg_10mi, 0.113; WIN_D_INST_Max, 0.051)”
§ A Machine Learning-Based Quality Control Algorithm for Heavy Rainfall Using Multi-Source Data > 3.1. Importance Analysis
“wind speed (WIN_S_INST_Max, 0.063; WIN_S_Avg_10mi, 0.056)”
Rated minor: it would not touch a result — a value no result rests on, a p-value that stays on the same side of the significance level, or a conflict that is clerical, resolved elsewhere in the paper, or outside its own findings.
In the paper
§ A Machine Learning-Based Quality Control Algorithm for Heavy Rainfall Using Multi-Source Data > 3.2. Comparison of Performance in Different Models
“resulting in the TN value in Equation ( 2) being considerably larger than TP, FP, and FN.”
§ A Machine Learning-Based Quality Control Algorithm for Heavy Rainfall Using Multi-Source Data > PRE_1m_Ave =
“PRE_1m_Std = 1 N ∑ N i=1 (PRE i -PRE_1m_Ave) 2(2)”
Rated minor: it would not touch a result — a value no result rests on, a p-value that stays on the same side of the significance level, or a conflict that is clerical, resolved elsewhere in the paper, or outside its own findings.
In the paper
§ A Machine Learning-Based Quality Control Algorithm for Heavy Rainfall Using Multi-Source Data > 2.1. Data and Workflow
“surface observational data where the hourly precipitation exceeded 40 mm.”
§ A Machine Learning-Based Quality Control Algorithm for Heavy Rainfall Using Multi-Source Data > 4.2. Spatial Variations in Algorithm Performance
“the current specialization in heavy rainfall events (≥40 mm/h)”
Citations
Cites
Machine learning: Trends, perspectives, and prospects
Jordan, M. I., & Mitchell, T. M. (2015) · Science · doi:10.1126/science.aaa8415 · Cited by 9,955
Gradient boosting machines, a tutorial
Natekin, A., & Knoll, A. (2013) · Frontiers in Neurorobotics · doi:10.3389/fnbot.2013.00021 · Cited by 3,887
Changes in precipitation with climate change
Trenberth, K. (2011) · Climate Research · doi:10.3354/cr00953 · Cited by 3,803
CatBoost for big data: an interdisciplinary review
Hancock, J. T., & Khoshgoftaar, T. M. (2020) · Journal of Big Data · doi:10.1186/s40537-020-00369-8 · Cited by 1,814
Schneider, U., Becker, A., Finger, P., Meyer-Christoffer, A., Ziese, M., & Rudolf, B. (2014) · Theoretical and Applied Climatology · doi:10.1007/s00704-013-0860-x · Cited by 1,385
Efficient kNN classification with different numbers of nearest neighbors
Zhang, S., Li, X., Zong, M., Zhu, X., & Wang, R. (2018) · IEEE Transactions on Neural Networks and Learning Systems · doi:10.1109/tnnls.2017.2673241 · Cited by 1,378
Ensemble Forecasting at NMC: The Generation of Perturbations
Tóth, Z., & Kalnay, E. (1993) · Bulletin of the American Meteorological Society · doi:10.1175/1520-0477(1993)074<0387:tgcss>2.0.co;2 · Cited by 1,233
Nohara, Y., Matsumoto, K., Soejima, H., & Nakashima, N. (2022) · Computer Methods and Programs in Biomedicine · doi:10.1016/j.cmpb.2021.106584 · Cited by 1,091
Introducing the New Generation of Chinese Geostationary Weather Satellites, Fengyun-4
Yang, J., Zhang, Z., Wei, C., Lu, F., & Guo, Q. (2017) · Bulletin of the American Meteorological Society · doi:10.1175/bams-d-16-0065.1 · Cited by 815
Mitigating the Multicollinearity Problem and Its Machine Learning Approach: A Review
Chan, J. Y.-L., Leow, S. M. H., Bea, K. T., Cheng, W. K., Phoong, S. W., Hong, Z.-W., & Chen, Y.-L. (2022) · Mathematics · doi:10.3390/math10081283 · Cited by 617
Research works printed but not linked: 2
- 2. Remote Sens. 2025, 17, 3976
- 79. J. Meteorol. Soc. Jpn. Ser. II 2020, 98, 19-42. [CrossRef]
Cited by
Error-Decomposition Machine Learning for IMERG Precipitation Correction in Karst Regions
Gan, F., Zhang, X., Diao, X., et al. (2026) · Water Resources Management · doi:10.1007/s11269-026-04586-3
Research Progress and Directions in Meteorological Data Storage Technologies
Zhang, P. (2026) · Hans Journal of Data Mining · doi:10.12677/hjdm.2026.162007
Wu, Y., Zhou, R., Li, Z., Hua, W., & Feng, F. (2026) · Meteorological Applications · doi:10.1002/met.70213
Metadata
- Authors
- Sun, H., Zhou, Q., Shi, L., Li, C., Qin, S., Yao, D., Xu, M., Huang, Y., Hu, Q., & Guan, Y.
- Affiliations
- China Meteorological Administration (CN)
- Anqing Meteorological Bureau, Anqing 246001, China
- Jiangxi Meteorological Observation Centre, Nanchang 330096, China
- Shanghai Meteorological Bureau (CN)
- Corresponding author
- Sun, Hao
- Venue
- Remote Sensing
- Publisher
- MDPI AG
- Published
- 2025-12-09
- Volume
- 17
- Issue
- 24
- Pages
- 3976
- ISSN
- 2072-4292 (ISSN-L)
- OpenAlex
- W4417159468
- Cited by
- 4
- References
- 78
- Citations by year
- 2026: 4
- FWCI
- 1.73
- Type
- journal article
- Language
- en
- Open access
- gold
- doi.org
- Licence
- Locations
- Remote Sensing (publishedVersion, cc-by)
- Preprints.org (acceptedVersion, cc-by)
- DOAJ (DOAJ: Directory of Open Access Journals) (submittedVersion, cc-by-sa)
- Funders
- National Natural Science Foundation of China (U2342216)
- Topics
- Physical Sciences › Earth and Planetary Sciences › Atmospheric Science › Precipitation Measurement and Analysis
- Physical Sciences › Earth and Planetary Sciences › Atmospheric Science › Meteorological Phenomena and Simulations
- Physical Sciences › Environmental Science › Management, Monitoring, Policy and Law › Environmental Monitoring and Data Management
- Keywords
- heavy rainfall, quality control, automatic weather station, gradient boosting, XGBoost, LightGBM, CatBoost, cloud top temperature, SHAP, false alarm reduction, multi-source data fusion
About these checks
Registry, retraction, Cites and statistics results are computed, not judged, with one exception: a printed reference that no index lists is read once by a model before it counts as a citation error. Claims are extracted by a model and kept only when their quote appears verbatim in the text; each cited source is then checked, with a model’s help, for whether it says what the claim relies on. Those verdicts can be wrong — read the claim’s quote and the cited source before relying on one.
The claim verdicts this report counts are experimental: their accuracy is not yet measured.
A language model drew the claims from the paper on 2026-10-10, under version 3 of the claim definition (model deepseek-v4.1-flash, prompt extract-v3).
A second model labelled each claim on 2026-10-10 (model jev-1.13-20260917, definition revision gold-guideline-v0.2).
Cited sources are checked with a language model’s help (qwen3.8-omni-flash and gpt-6-sol).
Statistics and arithmetic are recomputed, not judged.
Confidence bands are shown only for fields calibrated on our annotated test set. None is calibrated yet, so no band is shown.
What counts as a claim ›How we measure confidence ›How we check this ›
Are you an author, or do you see a problem with this page? Request a review
Data sources
Bibliographic data: Semantic Scholar, OpenAlex, Crossref.
Contains information from the Semantic Scholar Academic Graph Datasets, made available under the ODC Attribution License (ODC-BY 1.0).
Semantic Scholar’s data is described in: Kinney, R., et al. (2023). The Semantic Scholar Open Data Platform. arXiv:2301.10140.
