Cited by 15Cryptographic Implementations and SecurityPhysical Unclonable Functions (PUFs) and Hardware SecurityArduino and IoT Applications

The DOI matches its Crossref record; 28 of the 28 references it cites were found in a registry or an index.

Harvesting Entropy for Random Number Generation for Internet of Things Constrained Devices Using On-Board Sensors

Open access
Pawlowski, Marcin, Jara, Antonio, Ogorzalek, Maciej·2015·Sensors

Abstract

Entropy in computer security is associated with the unpredictability of a source of randomness. The random source with high entropy tends to achieve a uniform distribution of random values. Random number generators are one of the most important building blocks of cryptosystems. In constrained devices of the Internet of Things ecosystem, high entropy random number generators are hard to achieve due to hardware limitations. For the purpose of the random number generation in constrained devices, this work proposes a solution based on the least-significant bits concatenation entropy harvesting method. As a potential source of entropy, on-board integrated sensors (i.e., temperature, humidity and two different light sensors) have been analyzed. Additionally, the costs (i.e., time and memory consumption) of the presented approach have been measured. The results obtained from the proposed method with statistical fine tuning achieved a Shannon entropy of around 7.9 bits per byte of data for temperature and humidity sensors. The results showed that sensor-based random number generators are a valuable source of entropy with very small RAM and Flash memory requirements for constrained devices of the Internet of Things.

Overview

The claims and statistics of this paper haven’t been checked yet.

Run the check — free, no account needed. It reads the open-access text and checks the sources it cites.

A few free checks a day · papers already verified open instantly · results are public

Integrity signals

Registry

Crossref · 10.3390/s151026838

Cites

28 of 28 references verified0 citation errors · 0 not checkable

Statistics

Figures

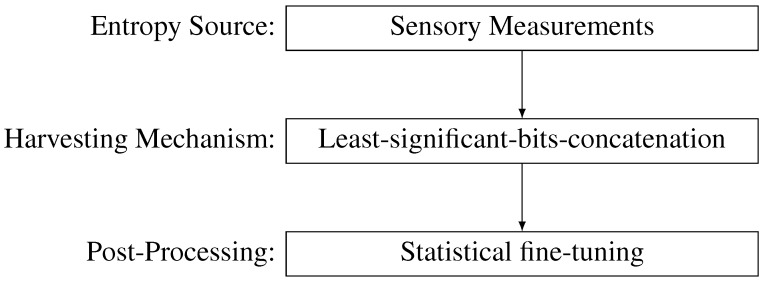
Figure 1 Simplified random number generation process with the particular building blocks proposed in this paper.
Figure 1 Simplified random number generation process with the particular building blocks proposed in this paper.CC BY · PubMed Central
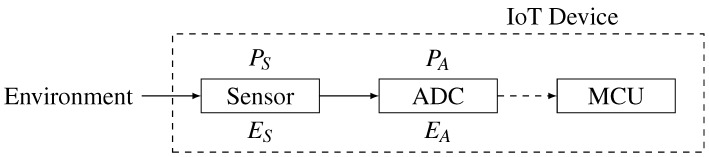
Figure 2 The simplified sensory measurement communication path. The PS and PA represent the precision of the sensor and ADC devices, respectively. The ES and EA represent the error measurement factor of the sensor and ADC devices, respectively. The straight line represents the analogue signal, and the dashed line represents the digital signal.
Figure 2 The simplified sensory measurement communication path. The PS and PA represent the precision of the sensor and ADC devices, respectively. The ES and EA represent the error measurement factor of the sensor and ADC devices, respectively. The straight line represents the analogue signal, and the dashed line represents the digital signal.CC BY · PubMed Central
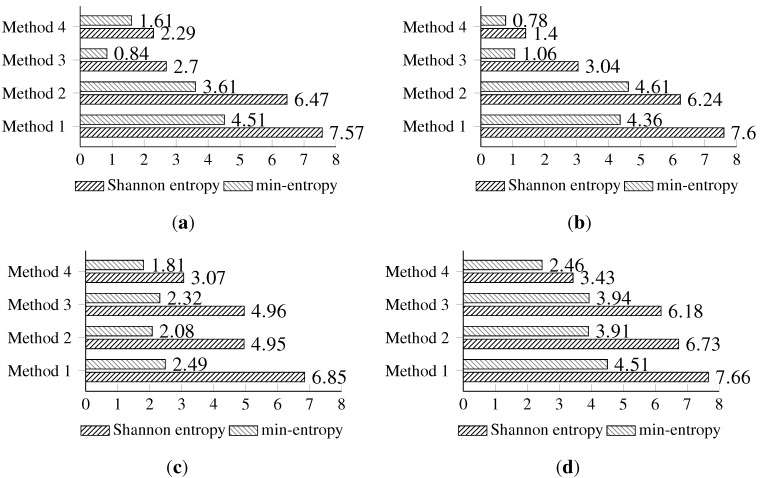
Figure 3 The comparison of the measured Shannon and min-entropy of the initial experimental results. (a) Light (1); (b) Light (2); (c) humidity; (d) temperature.
Figure 3 The comparison of the measured Shannon and min-entropy of the initial experimental results. (a) Light (1); (b) Light (2); (c) humidity; (d) temperature.CC BY · PubMed Central
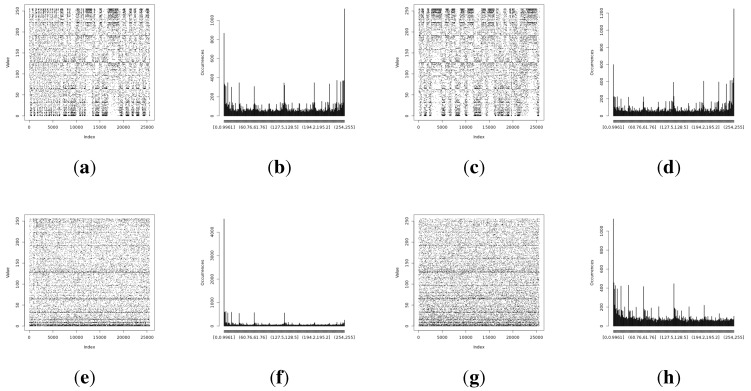
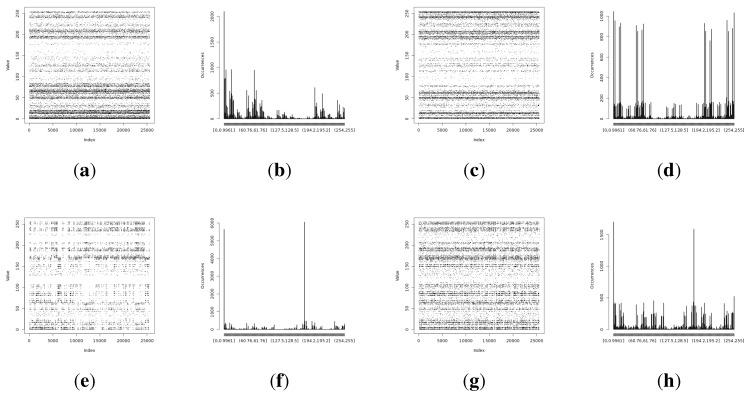
Figure 4 Initial experimental results of the harvested entropy by the first method in conjunction with the particular on-board sensor. (a) Light (1) sensor entropy; (b) distribution from the Light (1) sensor; (c) Light (2) sensor entropy; (d) distribution from the Light (2) sensor; (e) humidity sensor entropy; (f) distribution from the humidity sensor; (g) temperature sensor entropy; (h) distribution from the temperature sensor.
Figure 4 Initial experimental results of the harvested entropy by the first method in conjunction with the particular on-board sensor. (a) Light (1) sensor entropy; (b) distribution from the Light (1) sensor; (c) Light (2) sensor entropy; (d) distribution from the Light (2) sensor; (e) humidity sensor entropy; (f) distribution from the humidity sensor; (g) temperature sensor entropy; (h) distribution from the temperature sensor.CC BY · PubMed Central
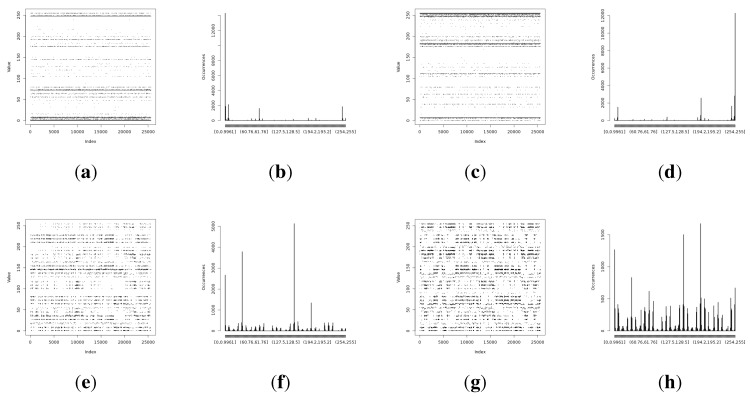
Figure 5 Initial experimental results of the harvested entropy by the second method in conjunction with the particular on-board sensor. (a) Light (1) sensor entropy; (b) distribution from the Light (1) sensor; (c) the Light (2) sensor entropy; (d) distribution from the Light (2) sensor; (e) humidity sensor entropy; (f) distribution from the humidity sensor; (g) temperature sensor entropy; (h) the distribution from the temperature sensor.
Figure 5 Initial experimental results of the harvested entropy by the second method in conjunction with the particular on-board sensor. (a) Light (1) sensor entropy; (b) distribution from the Light (1) sensor; (c) the Light (2) sensor entropy; (d) distribution from the Light (2) sensor; (e) humidity sensor entropy; (f) distribution from the humidity sensor; (g) temperature sensor entropy; (h) the distribution from the temperature sensor.CC BY · PubMed Central
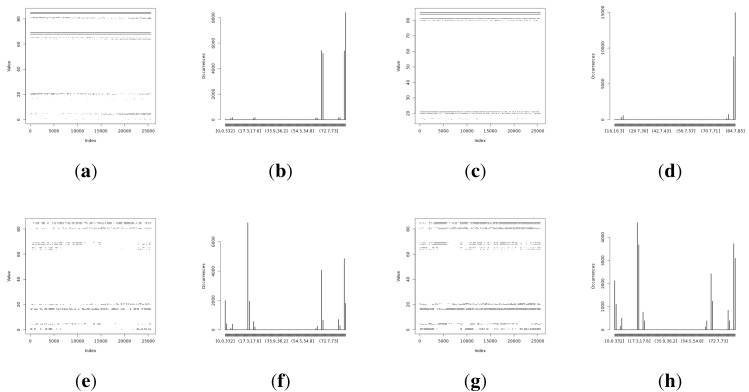
Figure 6 Initial experimental results of the harvested entropy by the third method in conjunction with the particular on-board sensor. (a) Light (1) sensor entropy; (b) distribution from the Light (1) sensor; (c) the Light (2) sensor entropy; (d) distribution from the Light (2) sensor; (e) humidity sensor entropy; (f) distribution from the humidity sensor; (g) temperature sensor entropy; (h) the distribution from the temperature sensor.
Figure 6 Initial experimental results of the harvested entropy by the third method in conjunction with the particular on-board sensor. (a) Light (1) sensor entropy; (b) distribution from the Light (1) sensor; (c) the Light (2) sensor entropy; (d) distribution from the Light (2) sensor; (e) humidity sensor entropy; (f) distribution from the humidity sensor; (g) temperature sensor entropy; (h) the distribution from the temperature sensor.CC BY · PubMed Central
Figure 7 Initial experimental results of the harvested entropy by the fourth method in conjunction with the particular on-board sensor. (a) Light (1) sensor entropy; (b) distribution from the Light (1) sensor; (c) the Light (2) sensor entropy; (d) distribution from the Light (2) sensor; (e) humidity sensor entropy; (f) distribution from the humidity sensor; (g) temperature sensor entropy; (h) the distribution from the temperature sensor.
Figure 7 Initial experimental results of the harvested entropy by the fourth method in conjunction with the particular on-board sensor. (a) Light (1) sensor entropy; (b) distribution from the Light (1) sensor; (c) the Light (2) sensor entropy; (d) distribution from the Light (2) sensor; (e) humidity sensor entropy; (f) distribution from the humidity sensor; (g) temperature sensor entropy; (h) the distribution from the temperature sensor.CC BY · PubMed Central
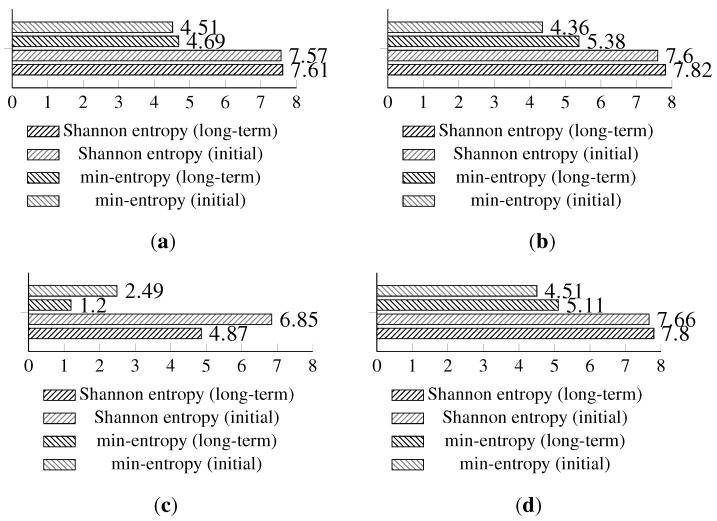
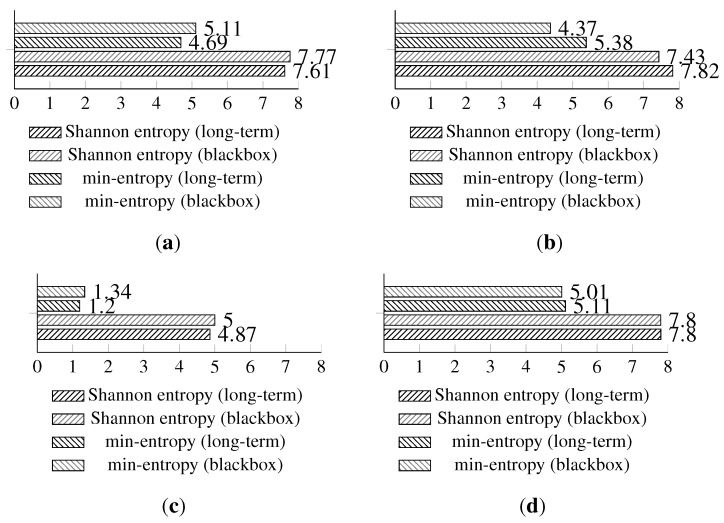
Figure 8 Comparison of Shannon entropy and min-entropy estimations of random bytes of the long-term experiment and the initial results of the analyzed sensors by particular entropy harvesting methods. (a) Light (1); (b) Light (2); (c) humidity; (d) temperature.
Figure 8 Comparison of Shannon entropy and min-entropy estimations of random bytes of the long-term experiment and the initial results of the analyzed sensors by particular entropy harvesting methods. (a) Light (1); (b) Light (2); (c) humidity; (d) temperature.CC BY · PubMed Central
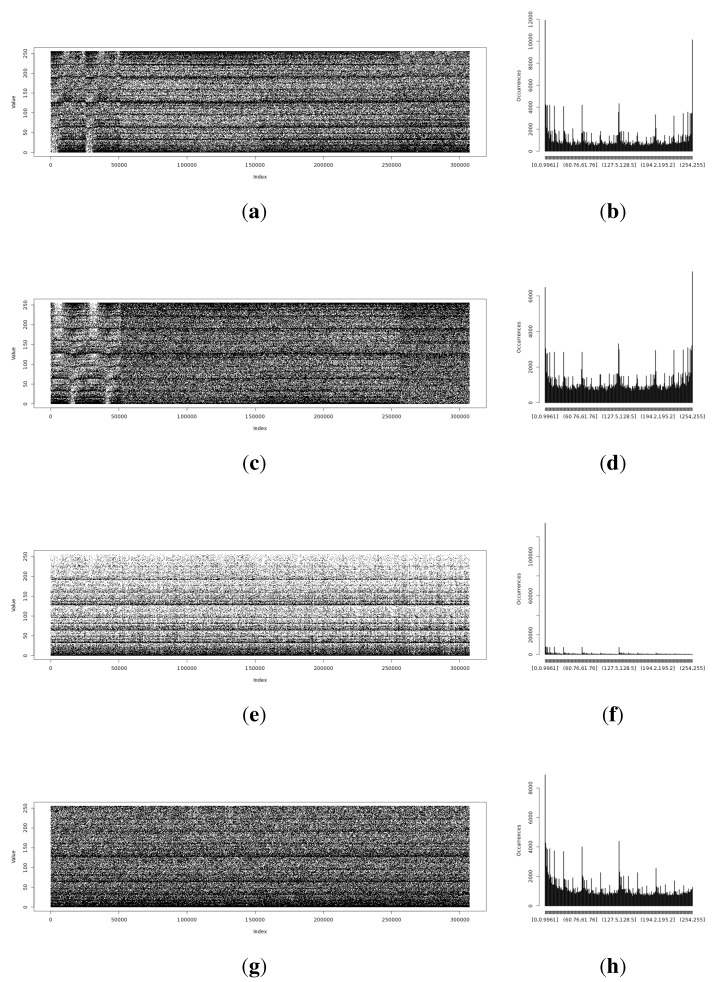
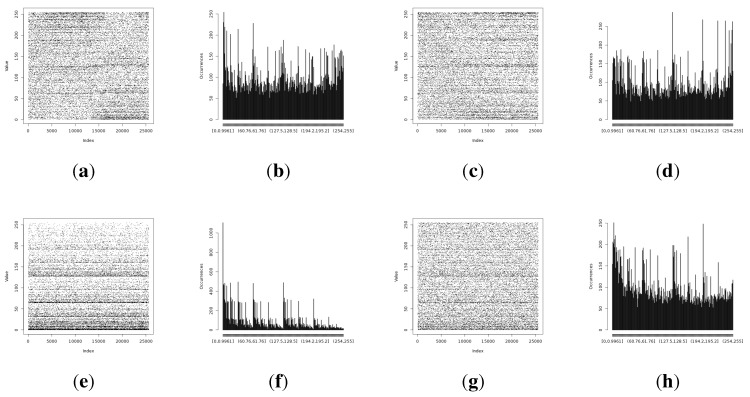
Figure 9 Entropy harvested by the first method from the particular on-board sensor. (a) Representation of the harvested entropy collected from the Light (1) sensor; (b) occurrence distribution for the Light (1) sensor; (c) representation of the harvested entropy collected from the Light (2) sensor; (d) occurrence distribution for the Light (2) sensor; (e) representation of the harvested entropy collected from the humidity sensor; (f) occurrence distribution for the humidity sensor; (g) representation of the harvested entropy collected from the temperature sensor; (h) occurrence distribution for the temperature sensor.
Figure 9 Entropy harvested by the first method from the particular on-board sensor. (a) Representation of the harvested entropy collected from the Light (1) sensor; (b) occurrence distribution for the Light (1) sensor; (c) representation of the harvested entropy collected from the Light (2) sensor; (d) occurrence distribution for the Light (2) sensor; (e) representation of the harvested entropy collected from the humidity sensor; (f) occurrence distribution for the humidity sensor; (g) representation of the harvested entropy collected from the temperature sensor; (h) occurrence distribution for the temperature sensor.CC BY · PubMed Central
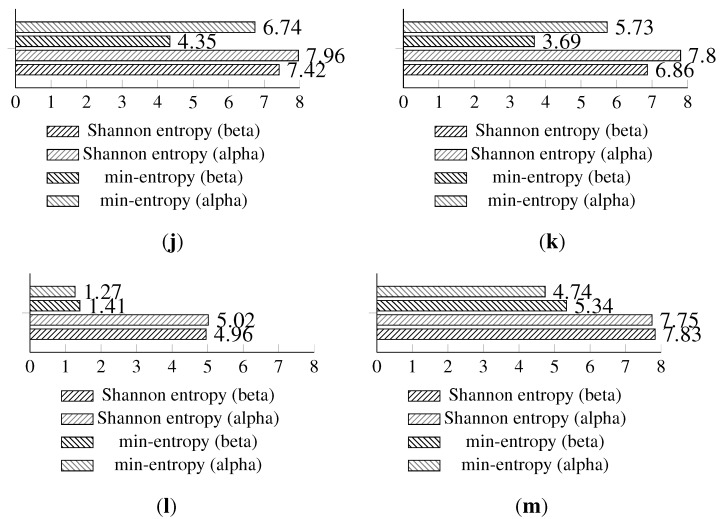
Figure 10 Shannon entropy and min-entropy estimations of the results gathered from the isolation (concatenated results from the alpha and beta devices) and long-term experiments. (a) Light (1); (b) Light (2); (c) humidity; (d) temperature.
Figure 10 Shannon entropy and min-entropy estimations of the results gathered from the isolation (concatenated results from the alpha and beta devices) and long-term experiments. (a) Light (1); (b) Light (2); (c) humidity; (d) temperature.CC BY · PubMed Central
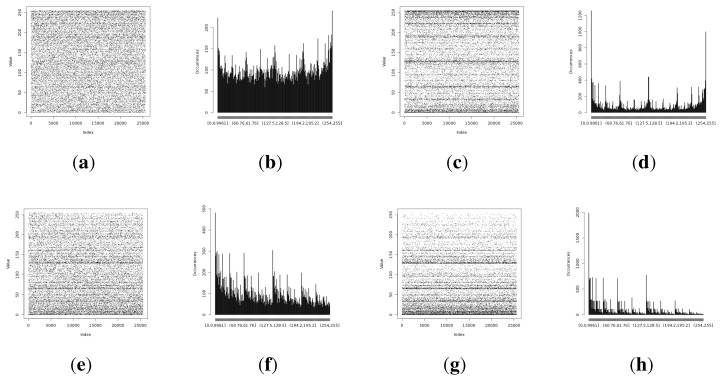
Figure 11 Experiment results representing random values harvested during the isolation experiment. (a) Entropy from Light (1) sensor with the original method; (b) distribution for the Light (1) sensor with the original method; (c) entropy from the Light (1) sensor with the statistically fine-tuned method; (d) distribution from the Light (1) sensor with the statistically fine-tuned method; (e) entropy from the Light (2) sensor with the original method; (f) distribution from the Light (2) sensor with the original method; (g) entropy from the Light (2) sensor with the statistically fine-tuned method; (h) distribution from the Light (2) sensor with the statistically fine-tuned method; (i) entropy from the humidity sensor with the original method; (j) distribution from the humidity sensor with the original method; (k) entropy from the humidity sensor with the statistically fine-tuned method; (l) distribution from the humidity sensor with the statistically fine-tuned method; (m) entropy from the temperature sensor with the original method; (n) distribution of the harvested entropy collected from the temperature sensor with the original method; (o) entropy from the temperature sensor with the statistically fine-tuned method; (p) distribution from the temperature sensor with the statistically fine-tuned method.
Figure 11 Experiment results representing random values harvested during the isolation experiment. (a) Entropy from Light (1) sensor with the original method; (b) distribution for the Light (1) sensor with the original method; (c) entropy from the Light (1) sensor with the statistically fine-tuned method; (d) distribution from the Light (1) sensor with the statistically fine-tuned method; (e) entropy from the Light (2) sensor with the original method; (f) distribution from the Light (2) sensor with the original method; (g) entropy from the Light (2) sensor with the statistically fine-tuned method; (h) distribution from the Light (2) sensor with the statistically fine-tuned method; (i) entropy from the humidity sensor with the original method; (j) distribution from the humidity sensor with the original method; (k) entropy from the humidity sensor with the statistically fine-tuned method; (l) distribution from the humidity sensor with the statistically fine-tuned method; (m) entropy from the temperature sensor with the original method; (n) distribution of the harvested entropy collected from the temperature sensor with the original method; (o) entropy from the temperature sensor with the statistically fine-tuned method; (p) distribution from the temperature sensor with the statistically fine-tuned method.CC BY · PubMed Central
Figure 12 Shannon entropy and min-entropy estimations of the results gathered from the alpha and beta devices during the isolation experiment. (a) Light (1); (b) Light (2); (c) humidity; (d) temperature.
Figure 12 Shannon entropy and min-entropy estimations of the results gathered from the alpha and beta devices during the isolation experiment. (a) Light (1); (b) Light (2); (c) humidity; (d) temperature.CC BY · PubMed Central
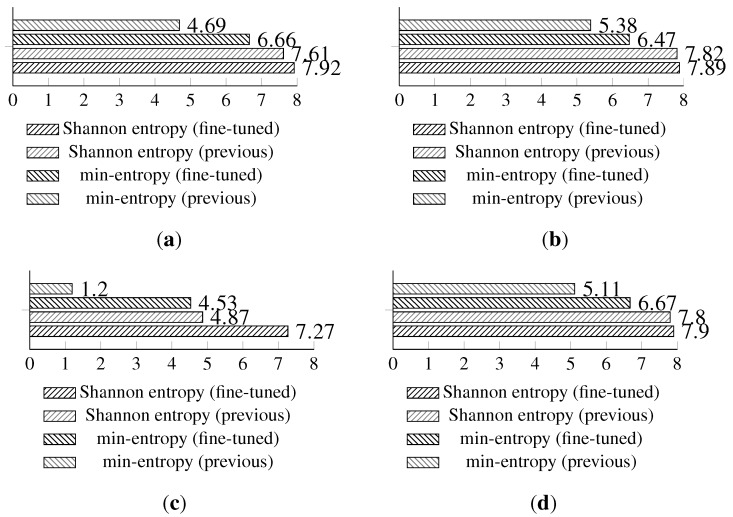
Figure 13 Shannon entropy and min-entropy estimations of previous (long-term results) and statistically fine-tuned versions of the entropy-harvesting method for the particular on-board sensors. (a) Light (1); (b) Light (2); (c) humidity; (d) temperature.
Figure 13 Shannon entropy and min-entropy estimations of previous (long-term results) and statistically fine-tuned versions of the entropy-harvesting method for the particular on-board sensors. (a) Light (1); (b) Light (2); (c) humidity; (d) temperature.CC BY · PubMed Central
Figure 14 Statistical fine-tuning experiment results for the entropy harvested. (a) Light (1) sensor entropy; (b) distribution from the Light (1) sensor; (c) Light (2) sensor entropy; (d) distribution from the Light (2) sensor; (e) humidity sensor entropy; (f) distribution from the humidity sensor; (g) temperature sensor entropy; (h) distribution from the temperature sensor.
Figure 14 Statistical fine-tuning experiment results for the entropy harvested. (a) Light (1) sensor entropy; (b) distribution from the Light (1) sensor; (c) Light (2) sensor entropy; (d) distribution from the Light (2) sensor; (e) humidity sensor entropy; (f) distribution from the humidity sensor; (g) temperature sensor entropy; (h) distribution from the temperature sensor.CC BY · PubMed Central

Verification

Claims the paper makes

The claims and statistics of this paper haven’t been checked yet.

Run the check — free, no account needed. It reads the open-access text and checks the sources it cites.

A few free checks a day · papers already verified open instantly · results are public

Claims other papers make about this one

Each is checked against this paper’s own text: does it say what the citing paper says it does?

Self-check

Percentages, sums and reported differences re-computed from the paper’s own numbers.

The self-check needs the paper’s full text.

Citations

Cites

1 retracted

Show all 28 references

Research works printed but not linked: 4

  1. Yang, 2013, Editorial on Internet of Things: Standards, Technology and Applications, Int. J. Ad Hoc Ubiquitous Comput., 13, 155
  2. Kocher, P., Jaffe, J., and Jun, B. (1999). Advances in Cryptology—CRYPTO’99, Springer.
  3. Agrawal, D., Archambeault, B., Rao, J.R., and Rohatgi, P. (2003). Cryptographic Hardware and Embedded Systems-CHES 2002, Springer.
  4. Genkin, D., Pipman, I., and Tromer, E. (2014). Cryptographic Hardware and Embedded Systems—CHES 2014, Springer.

Cited by

Sorted by citations

See all 15

Metadata

Authors
Pawlowski, M., Jara, A., & Ogorzalek, M.
Affiliations
  • Jagiellonian University (PL)
  • HES-SO University of Applied Sciences and Arts Western Switzerland (CH)
  • Department of Information Technologies, Faculty of Physics, Astronomy and Applied Computer Science, Jagiellonian University, Krakow 30-348, Poland
Corresponding author
Pawlowski, Marcin
Venue
Sensors
Publisher
MDPI AG
Published
2015-10-22
Volume
15
Issue
10
Pages
26838-26865
ISSN
1424-8220 (ISSN-L)
OpenAlex
W1753039820
Cited by
15
References
28
Citations by year
2026: 2 · 2025: 3 · 2023: 1 · 2022: 1 · 2021: 2 · 2020: 3 · 2019: 1 · 2018: 1 · 2015: 1
FWCI
0.65
Type
journal article
Language
en
Open access
Locations
  • Sensors (publishedVersion, cc-by)
  • PubMed Central (publishedVersion, cc-by)
  • PubMed (publishedVersion)
  • DOAJ (DOAJ: Directory of Open Access Journals) (submittedVersion, cc-by-sa)
Funders
  • Sciex-NMSch (13.121)
  • SAFESENS ENIAC (621272)
  • EU Horizon 2020 (649849, 644672)
Topics
  • Physical Sciences › Computer Science › Artificial Intelligence › Cryptographic Implementations and Security
  • Physical Sciences › Computer Science › Hardware and Architecture › Physical Unclonable Functions (PUFs) and Hardware Security
  • Physical Sciences › Engineering › Electrical and Electronic Engineering › Arduino and IoT Applications
Keywords
random number generation, resource-constrained devices, Internet of Things, onboard sensors, temperature sensors, humidity sensor, photodetectors, Shannon entropy, hardware randomness

About these checks

Registry, retraction, Cites and statistics results are computed, not judged, with one exception: a printed reference that no index lists is read once by a model before it counts as a citation error. Claims are extracted by a model and kept only when their quote appears verbatim in the text; each cited source is then checked, with a model’s help, for whether it says what the claim relies on. Those verdicts can be wrong — read the claim’s quote and the cited source before relying on one.

Statistics and arithmetic are recomputed, not judged.

Confidence bands are shown only for fields calibrated on our annotated test set. None is calibrated yet, so no band is shown.

What counts as a claim ›How we measure confidence ›How we check this ›

Are you an author, or do you see a problem with this page? Request a review