

The DOI matches its Crossref record; 41 of the 42 references it cites were found in a registry or an index, and 1 are not checked yet; 6 of the 43 sources its claims cite were checked for support.
Comparison of Feature Learning Methods for Human Activity Recognition Using Wearable Sensors
Open accessAbstract
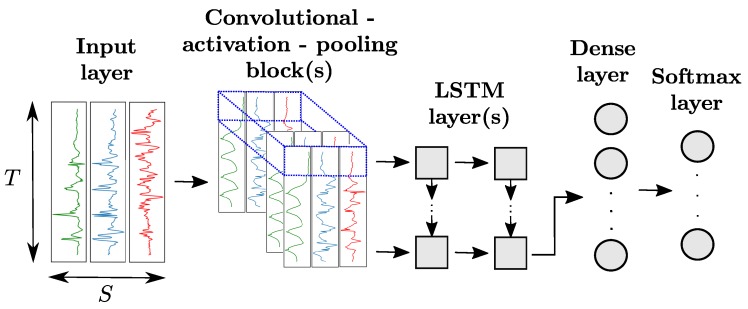
Getting a good feature representation of data is paramount for Human Activity Recognition (HAR) using wearable sensors. An increasing number of feature learning approaches—in particular deep-learning based—have been proposed to extract an effective feature representation by analyzing large amounts of data. However, getting an objective interpretation of their performances faces two problems: the lack of a baseline evaluation setup, which makes a strict comparison between them impossible, and the insufficiency of implementation details, which can hinder their use. In this paper, we attempt to address both issues: we firstly propose an evaluation framework allowing a rigorous comparison of features extracted by different methods, and use it to carry out extensive experiments with state-of-the-art feature learning approaches. We then provide all the codes and implementation details to make both the reproduction of the results reported in this paper and the re-use of our framework easier for other researchers. Our studies carried out on the OPPORTUNITY and UniMiB-SHAR datasets highlight the effectiveness of hybrid deep-learning architectures involving convolutional and Long-Short-Term-Memory (LSTM) to obtain features characterising both short- and long-term time dependencies in the data.
Verified 2026-10-05 · 1 reference not checked yet
Overview
CoChat Summary
TL;DR
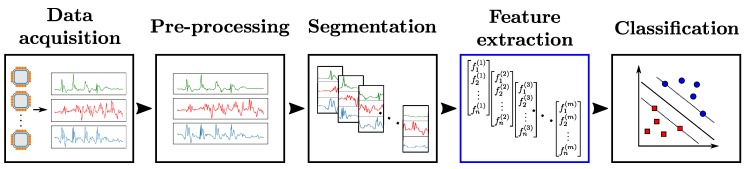
The paper proposes an evaluation framework that fixes all stages of the Activity Recognition Chain except feature extraction, then compares seven feature learning methods on OPPORTUNITY and UniMiB-SHAR. Hybrid CNN-LSTM architectures are the most robust across datasets, while codebook soft assignment is especially effective on UniMiB-SHAR and feature fusion improves results.
Key findings
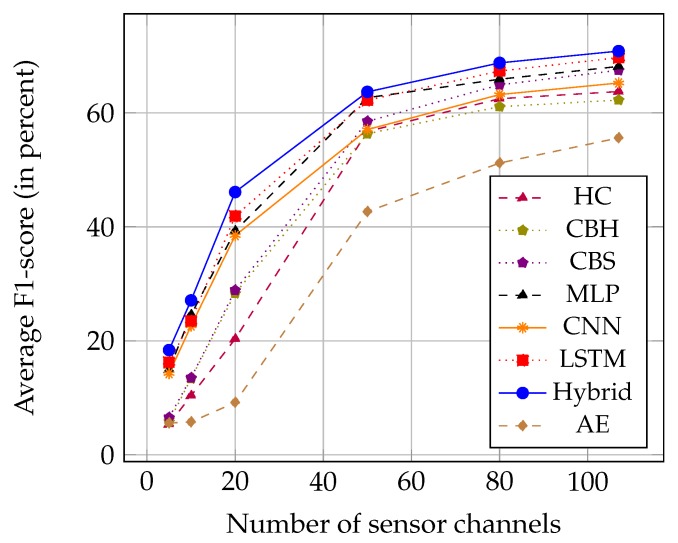
- On OPPORTUNITY, the hybrid CNN-LSTM model was best, with a reported weighted F1-score of 70.86%; LSTM’s average F1-score exceeded CNN’s by 4.45 percentage points.
- On UniMiB-SHAR, codebook soft assignment (CBS) achieved the highest accuracy and weighted F1-score at 77.03% and 75.93%, respectively, while CNN obtained the best average F1-score at 64.65%.
- Hand-crafted features underperformed the best methods by 7.39% average F1-score on OPPORTUNITY and 49.93% on UniMiB-SHAR.
- Fusing codebook and hybrid CNN-LSTM features improved performance on both datasets; changing the number of sensor channels or sliding-window size did not change the overall ranking of methods, with T=64 best in the reference OPPORTUNITY setup.
Methods
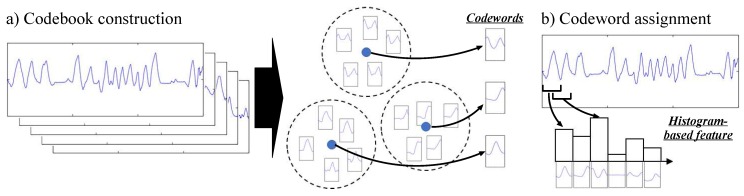
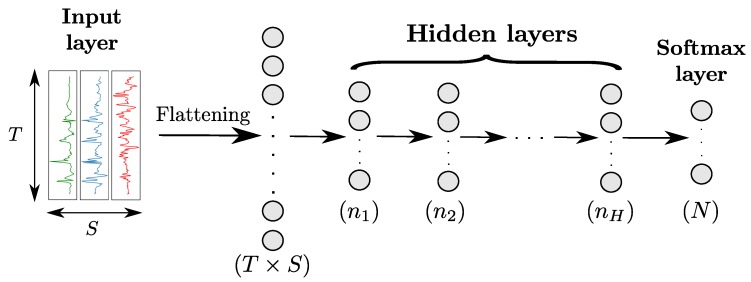
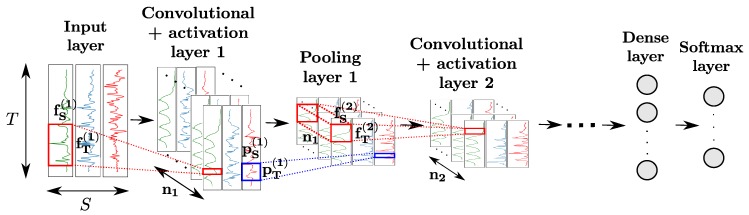
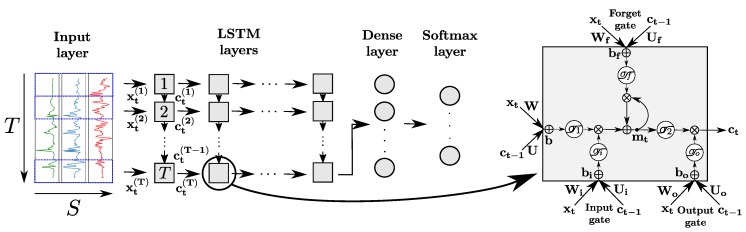
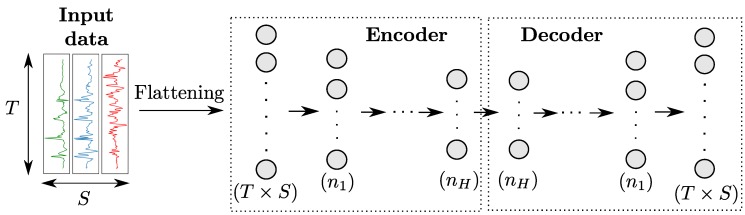
- The evaluation framework fixes all ARC stages except feature extraction and compares seven approaches: hand-crafted features, MLP, CNN, LSTM, hybrid CNN-LSTM, autoencoder, and codebook (hard and soft assignment), using a linear soft-margin SVM classifier and metrics including accuracy, weighted F1-score, and average F1-score.
- OPPORTUNITY: 4 subjects, 18 classes including NULL, 30 Hz, 145 sensor channels reduced to 107, sliding window T=64 (2 s) with stride 3; training used ADL1–ADL3 and Drill (211,265 frames), testing used ADL4–ADL5 (78,029 frames). UniMiB-SHAR: 30 subjects, 17 classes, 3D accelerometer at 50 Hz, T=151 (about 3 s), 11,771 windows, evaluated with 30-fold leave-one-subject-out cross-validation.
- Deep models were implemented in Keras/TensorFlow, trained with ADADELTA for 50 epochs, and fine-tuned by removing the softmax layer and using pre-trained models to compute features for SVM training; hyper-parameters were selected by manual search.
Limitations
- Stated: strict comparison with previous works is not possible because of differing evaluation frameworks; hyper-parameters were manually searched rather than optimized; on UniMiB-SHAR, the codebook was constructed using subsequences from all 30 subjects, including test subjects, which might slightly skew CB performances; larger time windows may contain multiple activities, making majority labeling less accurate; UniMiB-SHAR’s energy-based segmentation lacks temporal consistency and transition frames, possibly explaining LSTM’s relatively poor performance.
- Evident from the text: the comparison covers only two benchmark datasets, and the reported rankings depend on the specific segmentation type and dataset characteristics.
Model-written summary. Check it against the paper before relying on it.
Integrity signals
Registry
Cites
Statistics
Figures
Verification
Claims the paper makes
6 Valid · 2 Not valid · 25 Not checked · 75 Own results and interpretations
The cited sources support only part of this claim — read each source’s verdict below.
In the paper
“This makes the generalization error of the SVM independent of the number of dimensions.”
§ Comparison of Feature Learning Methods for Human Activity Recognition Using Wearable Sensors > 2. Methods
What the sources say
- Partly supportedcites [4] Cortes, 1995, Support-vector Networks, Mach. Learn. sourceExperimental — accuracy not yet measured
The Introduction (page unavailable) says that, for an optimal hyperplane separating the training data without errors, a bound on expected test error does not explicitly contain the dimensionality of the feature space. That conditional bound does not establish that an SVM’s generalization error is independent of dimensionality in general; it also depends on the number of support vectors. (LLM, conf=0.88)
plain- Asserted: passes — The authors put it forward as true.
- Checkable: passes — It can be checked against evidence.
- Load-bearing: passes — The paper’s conclusions depend on it.
- Based: passes — The paper gives a reason why it holds.
- Partly supported
The cited sources support only part of this claim — read each source’s verdict below.
In the paper
“As we found out that the codebook and deep-learning-based approaches produce different features which yield significantly different results, we expect their fusion to take advantage of this “diversity” and lead to performance improvements [42].”
§ Comparison of Feature Learning Methods for Human Activity Recognition Using Wearable Sensors > 6. Analysis
What the sources say
- Partly supportedcites [42] Kuncheva, 2003, Measure of Diversity in Classifier Ensembles and their Relationship with the Ensemble Accuracy, Mach. Learn. sourceExperimental — accuracy not yet measured
Our copy supports only the general premise behind the expectation: the Introduction (p. 1) states that bagging/boosting succeed because 'intuitively at least, they build a set of diverse classifiers' and that 'it is assumed that diversity is a key factor', and the Abstract (p. 1) says diversity 'is deemed to be a key issue in classifier combination'. However, the paper's own findings do not confirm that diversity delivers improvement: the Conclusions (p. 23) report 'no clear relationship between diversity and the averaged individual accuracy' and 'the possible inadequacy of the diversity measures for predicting the improvement on the best individual accuracy', with 'low absolute values of the correlation coefficients' (§6.4, p. 18), and the Abstract says the results 'raise some doubts about the usefulness of diversity measures'. The part of the claim it does not support is the assurance that exploiting diversity leads to performance gains — the cited work treats that as an unverified assumption and largely questions it. Nothing in our copy concerns codebook versus deep-learning feature fusion, which is the citing authors' own result. (LLM, conf=0.72)
hedgedstates a possible cause- Asserted: passes — The authors put it forward as true.
- Checkable: passes — It can be checked against evidence.
- Load-bearing: passes — The paper’s conclusions depend on it.
- Based: passes — The paper gives a reason why it holds.
- Partly supported
A result the paper reports from its own data — it cites no other source for it, so there is none to check. The quote shows it is in the paper.
In the paper
“Our studies carried out on the OPPORTUNITY and UniMiB-SHAR datasets highlight the effectiveness of hybrid deep-learning architectures involving convolutional and Long-Short-Term-Memory (LSTM) to obtain features characterising both short- and long-term time dependencies in the data.”
§ Comparison of Feature Learning Methods for Human Activity Recognition Using Wearable Sensors > Abstract
plainstates a cause- Asserted: passes — The authors put it forward as true.
- Checkable: passes — It can be checked against evidence.
- Load-bearing: passes — The paper’s conclusions depend on it.
- Based: passes — The paper gives a reason why it holds.
- Rests on an assumption not shown here.
A result the paper reports from its own data — it cites no other source for it, so there is none to check. The quote shows it is in the paper.
In the paper
“Its results showed no significant performance difference between using the fine-tuning approach and the usual one using directly the outputs of the softmax layer for the classification”
§ Comparison of Feature Learning Methods for Human Activity Recognition Using Wearable Sensors > 2. Methods > 2.3. Artificial Neural Networks
plain- Asserted: passes — The authors put it forward as true.
- Checkable: passes — It can be checked against evidence.
- Load-bearing: passes — The paper’s conclusions depend on it.
- Based: passes — The paper gives a reason why it holds.
In the paper
“We noticed that the addition of a batch normalization layer [40] significantly improved the classification results.”
§ Comparison of Feature Learning Methods for Human Activity Recognition Using Wearable Sensors > 4. Comparative Study on OPPORTUNITY > 4.1. Implementation Details of the Feature Extraction Models
What the sources say
- Not checked yetcites [40] Ioffe, S., and Szegedy, C. (2015, January 6–11). Batch Normalization: Accelerating Deep Network Training by Reducing Internal Covariate Shift. Proceedings of the ICML 2015, Lille, France.
plainstates a cause- Asserted: passes — The authors put it forward as true.
- Checkable: passes — It can be checked against evidence.
- Load-bearing: unclear — It is unclear whether the paper’s conclusions depend on it.
- Based: passes — The paper gives a reason why it holds.
53 more claims
Create a free account to see all 108 claims and to verify the 37 references still open.
- Probably not a substantial claim. 35
- It may state two separate claims as one. 23
- The quote only partly states this claim. 1
Claims other papers make about this one
Each is checked against this paper’s own text: does it say what the citing paper says it does?
The cited source doesn’t support the claim as written.
In the citing paper
“In contrast to these three models, i.e.,sequential LSTM layers (LSTM-CNN) before Convolution layer [48], sequential Convolution and dropout layers (CNN-LSTM) before LSTM layer [59], parallel LSTM layers (Parrallel LSTM-CNN) with Convolution layer [60], our chosen model achieved the best testing result of 99.93% for H-Activity dataset and 98.76% and 93.11% for MHEALTH and UCI-HAR dataset respective”
From Deep CNN-LSTM With Self-Attention Model for Human Activity Recognition Using Wearable Sensor (2022) · cites this paper as [59]
Checked by a reasoning model — may be wrong.
Experimental — accuracy not yet measuredThe check wasn’t confident either way, so it gives no verdict — never disputed.
In the citing paper
“The second best result is 78.90% using DeepConvLSTM.”
From DanHAR: Dual Attention Network for multimodal human activity recognition using wearable sensors (2021) · cites this paper as [38]
Experimental — accuracy not yet measuredThe check wasn’t confident either way, so it gives no verdict — never disputed.
In the citing paper
“DanHAR outperforms DeepConvLSTM by a large margin with 3.85% improvement in accuracy.”
From DanHAR: Dual Attention Network for multimodal human activity recognition using wearable sensors (2021) · cites this paper as [38]
Experimental — accuracy not yet measuredIn the citing paper
“Papers [33,34] also compared deep-learning methods for HAR, and verified that variants of the LSTM architecture lead to flexible and robust results in several sensor-based HAR datasets.”
From Sensor Data Acquisition and Multimodal Sensor Fusion for Human Activity Recognition Using Deep Learning (2019) · cites this paper as [34]
In the citing paper
“Hence, all of the above-mentioned models [48], [59], [60] were implemented with exact parameters described in the respective literature except the input and output layer to match our dataset.”
From Deep CNN-LSTM With Self-Attention Model for Human Activity Recognition Using Wearable Sensor (2022) · cites this paper as [59]
Self-check
Percentages, sums and reported differences re-computed from the paper’s own numbers.
Rated minor: it would not touch a result — a value no result rests on, a p-value that stays on the same side of the significance level, or a conflict that is clerical, resolved elsewhere in the paper, or outside its own findings.
In the paper
“the data are sampled at a frequency of 50 Hz, and split in 17 different classes, comprising 8ADLs and 7 “falling” actions as shown in Table 2.”
§ Comparison of Feature Learning Methods for Human Activity Recognition Using Wearable Sensors > 3. Data Description > 3.2. UniMiB-SHAR
Reported 17 · recomputed 15
Citations
Cites
ImageNet classification with deep convolutional neural networks
Krizhevsky, A., Sutskever, I., & Hinton, G. E. (2017) · Communications of the ACM · doi:10.1145/3065386 · Cited by 112,155
Hochreiter, S., & Schmidhuber, J. (1997) · Neural Computation · doi:10.1162/neco.1997.9.8.1735 · Cited by 102,318
Cortes, C., & Vapnik, V. (1995) · Machine Learning · doi:10.1007/bf00994018 · Cited by 59,421
Rich Feature Hierarchies for Accurate Object Detection and Semantic Segmentation
Girshick, R., Donahue, J., Darrell, T., & Malik, J. (2014) · 2014 IEEE Conference on Computer Vision and Pattern Recognition · doi:10.1109/cvpr.2014.81 · Cited by 32,684
Batch Normalization: Accelerating Deep Network Training by Reducing Internal Covariate Shift
Ioffe, S., & Szegedy, C. (2015) · arXiv · doi:10.48550/arxiv.1502.03167 · Cited by 27,818
Reducing the dimensionality of data with neural networks
Hinton, G. E., & Salakhutdinov, R. R. (2006) · Science · doi:10.1126/science.1127647 · Cited by 20,928
Sequence to Sequence Learning with Neural Networks
Sutskever, I., Vinyals, O., & Le, Q. V. (2014) · arXiv · doi:10.48550/arxiv.1409.3215 · Cited by 17,766
Visualizing and understanding convolutional networks
Zeiler, M. D., & Fergus, R. (2014) · Lecture Notes in Computer Science · doi:10.1007/978-3-319-10590-1_53 · Cited by 15,839
SURF: Speeded Up Robust Features
Bay, H., Tuytelaars, T., & Van Gool, L. (2006) · Lecture Notes in Computer Science · doi:10.1007/11744023_32 · Cited by 14,955
Convolutional Neural Networks for Sentence Classification
Kim, Y. (2014) · Proceedings of the 2014 Conference on Empirical Methods in Natural Language Processing (EMNLP) · doi:10.3115/v1/d14-1181 · Cited by 14,831
Research works printed but not linked: 2
- Cook, D.J., and Krishnan, N.C. (2015). Activity Learning: Discovering, Recognizing, and Predicting Human Behaviour from Sensor Data, John Wiley & Sons.
- Han, J., Kamber, M., and Pei, J. (2011). Data Mining: Concepts and Techniques, Morgan Kaufmann.
Cited by
Deep Learning in Human Activity Recognition with Wearable Sensors: A Review on Advances
Zhang, S., Li, Y., Zhang, S., Shahabi, F., Xia, S., Deng, Y., & Alshurafa, N. (2022) · Sensors · doi:10.3390/s22041476 · Cited by 625
“Researchers have proposed various algorithms to extract features from sensor signals and to perform activity classification using machine-learned models like K Nearest Neighbor (KNN) and SVM [123, 149, 168, 193, 254, 265, 270, 290, 313, 319].”
MethodInfluentialDemrozi, F., Pravadelli, G., Bihorac, A., & Rashidi, P. (2020) · IEEE Access · doi:10.1109/access.2020.3037715 · Cited by 368
Yadav, S. K., Tiwari, K., Pandey, H. M., & Akbar, S. A. (2021) · Knowledge-Based Systems · doi:10.1016/j.knosys.2021.106970 · Cited by 311
Rahaman, M. M., Li, C., Yao, Y., Kulwa, F., Rahman, M. A., Wang, Q., Qi, S., Kong, F., Zhu, X., & Zhao, X. (2020) · Journal of X-Ray Science and Technology: Clinical Applications of Diagnosis and Therapeutics · doi:10.3233/xst-200715 · Cited by 302
Deep CNN-LSTM With Self-Attention Model for Human Activity Recognition Using Wearable Sensor
Khatun, M. A., Yousuf, M. A., Ahmed, S., Uddin, M. Z., Alyami, S. A., Al-Ashhab, S., Akhdar, H. F., Khan, A., Azad, A., & Moni, M. A. (2022) · IEEE Journal of Translational Engineering in Health and Medicine · doi:10.1109/jtehm.2022.3177710 · Cited by 288
“,sequential LSTM layers (LSTM-CNN) before Convolution layer [48], sequential Convolution and dropout layers (CNN-LSTM) before LSTM layer [59], parallel LSTM layers (Parrallel LSTM-CNN) with Convolution layer [60], our chosen model achieved the best testing result of 99.”
Metadata
- Authors
- Li, F., Shirahama, K., Nisar, M., Köping, L., & Grzegorzek, M.
- Affiliations
- University of Siegen (DE)
- University of Economics in Katowice (PL)
- Corresponding author
- Li, Frédéric
- Venue
- Sensors
- Publisher
- MDPI AG
- Published
- 2018-02-24
- Volume
- 18
- Issue
- 2
- Pages
- 679
- ISSN
- 1424-8220 (ISSN-L)
- PMC
- PMC5855052
- OpenAlex
- W2789868604
- Cited by
- 302
- References
- 41
- Citations by year
- 2026: 4 · 2025: 27 · 2024: 36 · 2023: 42 · 2022: 43 · 2021: 54 · 2020: 49 · 2019: 34 · 2018: 13
- FWCI
- 18.76
- Type
- journal article
- Language
- en
- Open access
- gold
- doi.org
- Licence
- Locations
- Sensors (publishedVersion, cc-by)
- PubMed Central (publishedVersion, cc-by)
- PubMed (publishedVersion)
- DOAJ (DOAJ: Directory of Open Access Journals) (submittedVersion, cc-by-sa)
- Funders
- Bundesministerium für Bildung und Forschung (16SV7223K, 16SV7512)
- Deutsche Forschungsgemeinschaft (GRK1564)
- Topics
- Physical Sciences › Computer Science › Computer Vision and Pattern Recognition › Context-Aware Activity Recognition Systems
- Physical Sciences › Engineering › Biomedical Engineering › Gait Recognition and Analysis
- Physical Sciences › Computer Science › Signal Processing › Time Series Analysis and Forecasting
- Keywords
- human activity recognition, wearable sensors, representation learning, feature representation, evaluation framework, deep learning, convolutional neural networks, long short-term memory, CNN-LSTM hybrid model, Opportunity dataset, time dependence
- MeSH terms
- Machine Learning, Wearable Electronic Devices, Humans, Human Activities, Neural Networks, Computer
About these checks
Registry, retraction, Cites and statistics results are computed, not judged, with one exception: a printed reference that no index lists is read once by a model before it counts as a citation error. Claims are extracted by a model and kept only when their quote appears verbatim in the text; each cited source is then checked, with a model’s help, for whether it says what the claim relies on. Those verdicts can be wrong — read the claim’s quote and the cited source before relying on one.
The claim verdicts this report counts are experimental: their accuracy is not yet measured.
A language model drew the claims from the paper on 2026-10-05, under version 3 of the claim definition (model deepseek-v4.1-flash, prompt extract-v3).
A second model labelled each claim on 2026-10-05 (model jev-1.13-20260917, definition revision gold-guideline-v0.2).
Cited sources are checked with a language model’s help (gpt-6-sol and qwen3.8-omni-flash).
Statistics and arithmetic are recomputed, not judged.
Confidence bands are shown only for fields calibrated on our annotated test set. None is calibrated yet, so no band is shown.
What counts as a claim ›How we measure confidence ›How we check this ›
Are you an author, or do you see a problem with this page? Request a review
How to cite
Cite CoChat for the checks on this page, and the paper for its own findings.
- This page
- CoChat. (2026). Citation check: Comparison of Feature Learning Methods for Human Activity Recognition Using Wearable Sensors. https://app.cochat.ai/papers/10.3390/s18020679
- The paper
- Li, F., Shirahama, K., Nisar, M., Köping, L., & Grzegorzek, M. (2018). Comparison of Feature Learning Methods for Human Activity Recognition Using Wearable Sensors. Sensors. https://doi.org/10.3390/s18020679
Data sources
Bibliographic data: Semantic Scholar, OpenAlex, Crossref.
Contains information from the Semantic Scholar Academic Graph Datasets, made available under the ODC Attribution License (ODC-BY 1.0).
Semantic Scholar’s data is described in: Kinney, R., et al. (2023). The Semantic Scholar Open Data Platform. arXiv:2301.10140.
