

The DOI matches its Crossref record; 19 of the 20 references it cites were found in a registry or an index.
Clinical Study of Continuous Non-Invasive Blood Pressure Monitoring in Neonates
Open accessAbstract
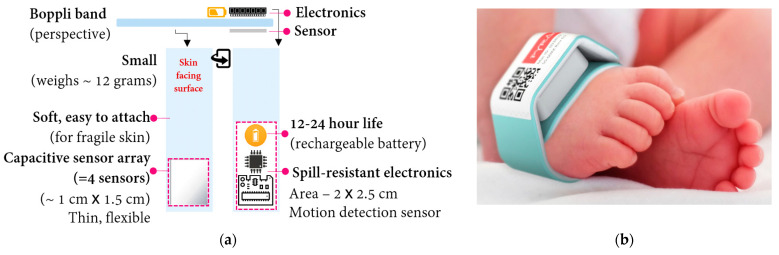
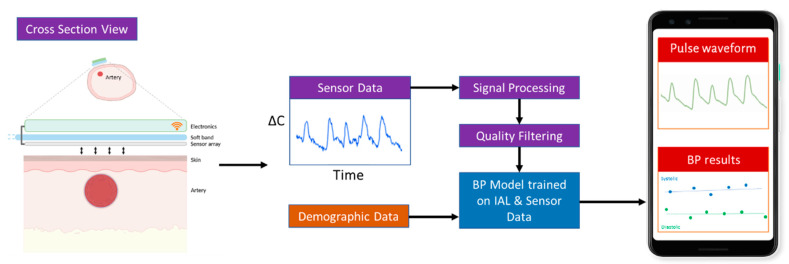
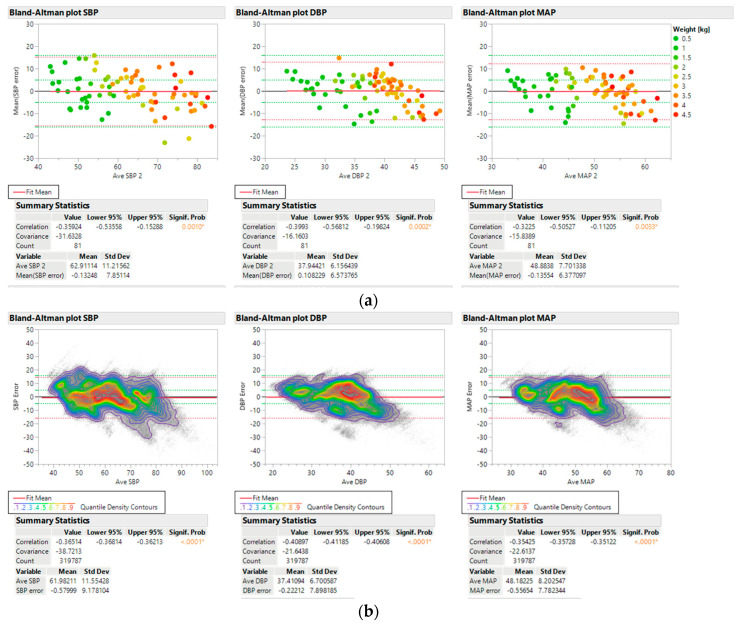
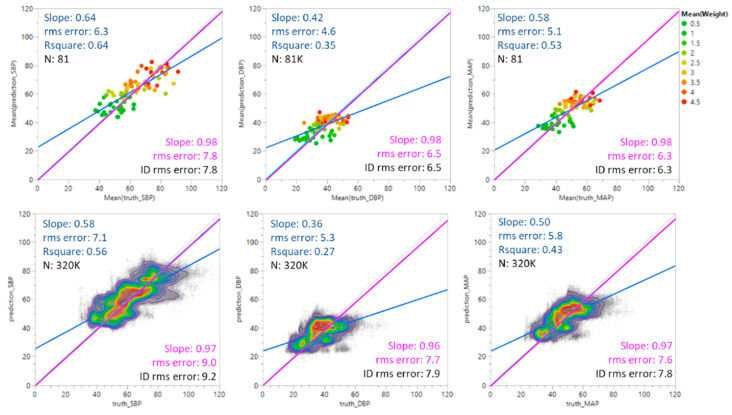
The continuous monitoring of arterial blood pressure (BP) is vital for assessing and treating cardiovascular instability in a sick infant. Currently, invasive catheters are inserted into an artery to monitor critically-ill infants. Catheterization requires skill, is time consuming, prone to complications, and often painful. Herein, we report on the feasibility and accuracy of a non-invasive, wearable device that is easy to place and operate and continuously monitors BP without the need for external calibration. The device uses capacitive sensors to acquire pulse waveform measurements from the wrist and/or foot of preterm and term infants. Systolic, diastolic, and mean arterial pressures are inferred from the recorded pulse waveform data using algorithms trained using artificial neural network (ANN) techniques. The sensor-derived, continuous, non-invasive BP data were compared with corresponding invasive arterial line (IAL) data from 81 infants with a wide variety of pathologies to conclude that inferred BP values meet FDA-level accuracy requirements for these critically ill, yet normotensive term and preterm infants.
Overview
The claims and statistics of this paper haven’t been checked yet.
Run the check — free, no account needed. It reads the open-access text and checks the sources it cites.
Integrity signals
Registry
Cites
Statistics
Figures
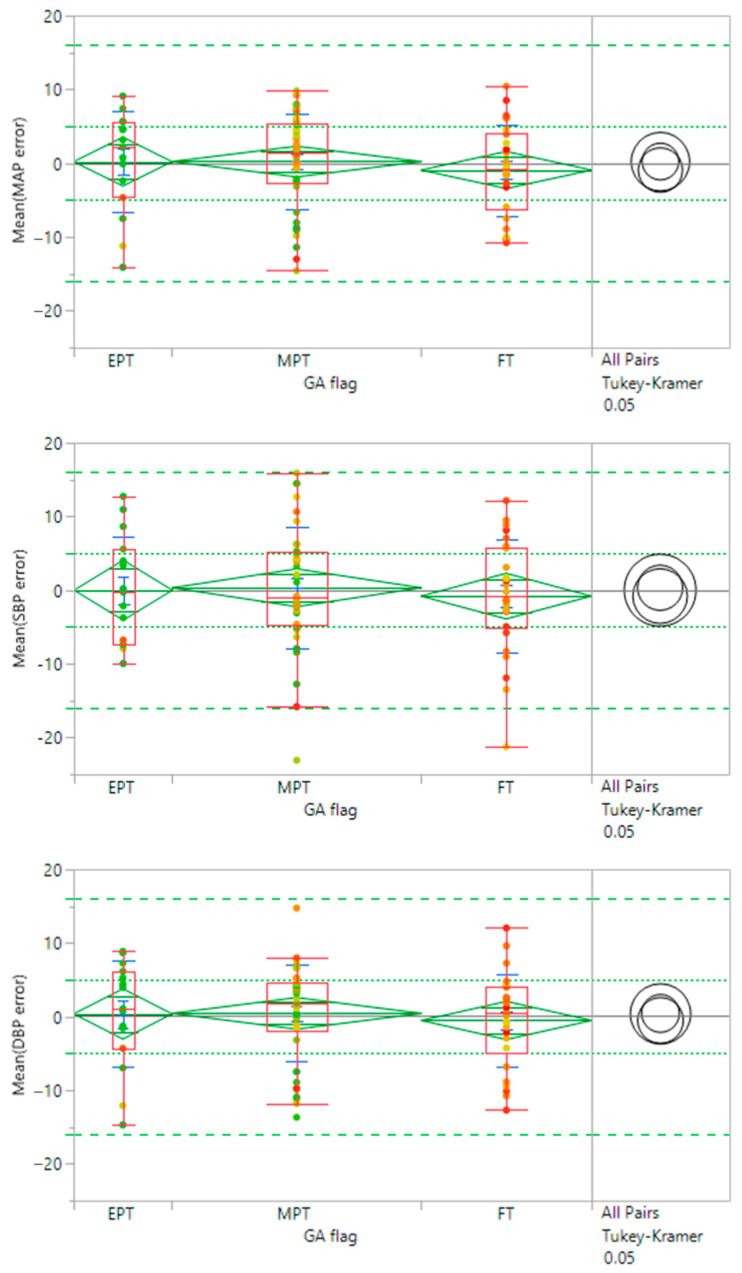
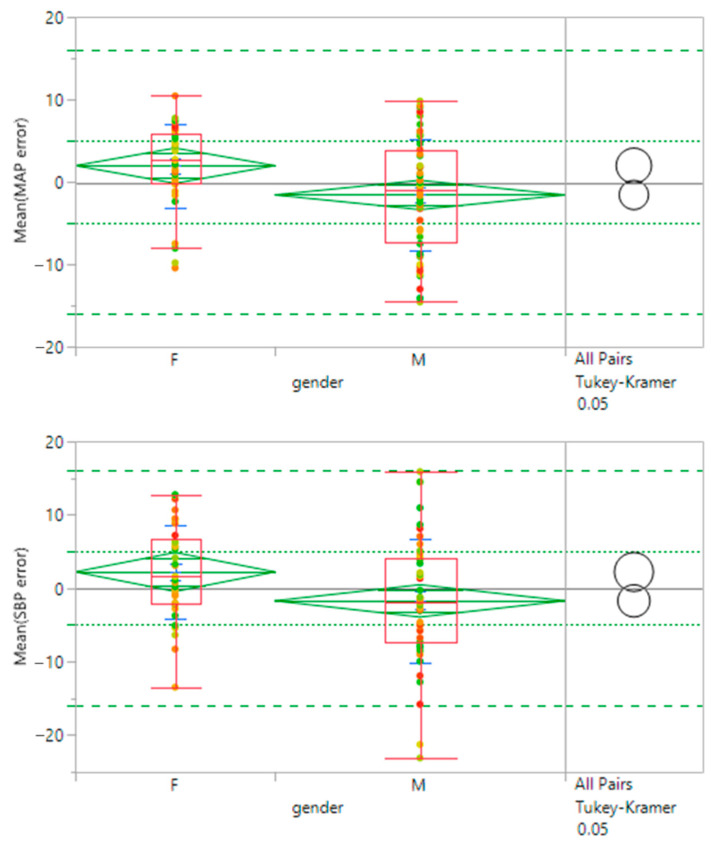
Verification
Claims the paper makes
The claims and statistics of this paper haven’t been checked yet.
Run the check — free, no account needed. It reads the open-access text and checks the sources it cites.
Claims other papers make about this one
Each is checked against this paper’s own text: does it say what the citing paper says it does?
The check wasn’t confident either way, so it gives no verdict — never disputed.
In the citing paper
“In addition, for infants who experience hypothermia or low body temperatures, which is common for infants in the Ethiopian NICU, distal measurement locations like the hand and foot often face limited perfusion to protect vital organs8–11.”
From Soft, all-in-one, nanomembrane wearable system for advancing neonatal health monitoring in Ethiopia (2025) · cites this paper as [10]
Experimental — accuracy not yet measured
Self-check
Percentages, sums and reported differences re-computed from the paper’s own numbers.
The self-check needs the paper’s full text.
Citations
Cites
Measurement in Medicine: The Analysis of Method Comparison Studies
Altman, D. G., & Bland, J. M. (1983) · The Statistician · doi:10.2307/2987937 · Cited by 4,300
Epidemiologic Trends in Neonatal Intensive Care, 2007-2012
Harrison, W. N., & Goodman, D. C. (2015) · Archives of Pediatrics and Adolescent Medicine · doi:10.1001/jamapediatrics.2015.1305 · Cited by 377
Newborn infant skin: Physiology, development, and care
Visscher, M. O., Adam, R., Brink, S., & Odio, M. R. (2014) · Clinics in Dermatology · doi:10.1016/j.clindermatol.2014.12.003 · Cited by 245
Surgical and Patient Risk Factors for Severe Arterial Line Complications in Adults
Nuttall, G. A., Burckhardt, J., Hadley, A., Kane, S. A., Kor, D. J., Marienau, M. S., Schroeder, D. R., Handlogten, K. S., Wilson, G. A., & Oliver, W. C. (2015) · Anesthesiology · doi:10.1097/aln.0000000000000967 · Cited by 163
Kumar, N., Akangire, G. G., Sullivan, B. A., Fairchild, K. D., & Sampath, V. (2019) · Pediatric Research · doi:10.1038/s41390-019-0527-0 · Cited by 143
Dannevig, I., Dale, H. C., Liestøl, K., & Lindemann, R. (2004) · Acta Paediatrica · doi:10.1111/j.1651-2227.2005.tb01889.x · Cited by 86
Arterial Catheter—Related Infections in Children A 1-Year Cohort Analysis
Furfaro, S. (1991) · American journal of diseases of children · doi:10.1001/archpedi.1991.02160090089031 · Cited by 84
Advances in Non-Invasive Blood Pressure Monitoring
Quan, X., Liu, J., Roxlo, T., Siddharth, S., Leong, W., Muir, A., Cheong, S., & Rao, A. V. (2021) · Sensors · doi:10.3390/s21134273 · Cited by 67
Self-citationTakçı, Ş., Yiğit, Ş., Korkmaz, A., & Yurdakök, M. (2011) · Acta Paediatrica · doi:10.1111/j.1651-2227.2011.02458.x · Cited by 49
Meyer, S., Sander, J., Gräber, S., Gottschling, S., & Gortner, L. (2010) · Journal of Paediatrics and Child Health · doi:10.1111/j.1440-1754.2009.01679.x · Cited by 49
Research works printed but not linked: 1
- Tareerath, 2018, Comparison of the Incidences of Cuff-Related Trauma after Non-Invasive Arterial Blood Pressure Measurement with and without Padding in Patients Undergoing Elective Surgery, J. Med. Assoc. Thail. Chotmaihet Thangphaet, 101, 1
Cited by
Sorted by citations
Cuffless Blood Pressure Measurement: Where Do We Actually Stand?
Mukkamala, R., Shroff, S. G., Kyriakoulis, K. G., Avolio, A. P., & Stergiou, G. S. (2025) · Hypertension · doi:10.1161/hypertensionaha.125.24822 · Cited by 50
Kailasanathan, N., Ezhilarasan, G., Selvarajan, S., Dhanaraj, R. K., Pamucar, D., & Shankar, N. (2025) · Frontiers in Digital Health · doi:10.3389/fdgth.2025.1612915 · Cited by 18
Baker, S., Yogavijayan, T., & Kandasamy, Y. (2023) · Healthcare · doi:10.3390/healthcare11243107 · Cited by 11
Sénéchal, E., Maximov, A. G., Jeanne, E., Radeschi, D. J., Azevedo, V. M. G. D. O., Gross, A., Shalish, W., Kearney, R. E., & SantʼAnna, G. (2025) · Pediatric Research · doi:10.1038/s41390-025-04469-0 · Cited by 8
Sénéchal, E., Radeschi, D. J., Lv, S., Jeanne, E., Ruiz, A. S., Tao, L., Dulmage, B., Shalish, W., Kearney, R. E., & SantʼAnna, G. (2025) · Frontiers in Bioengineering and Biotechnology · doi:10.3389/fbioe.2025.1555882 · Cited by 6
Metadata
- Authors
- Rao, A., Eskandar-Afshari, F., Weiner, Y., Billman, E., McMillin, A., Sella, N., Roxlo, T., Liu, J., Leong, W., Helfenbein, E., Walendowski, A., Muir, A., Joseph, A., Verma, A., Ramamoorthy, C., Honkanen, A., Green, G., Drake, K., Govindan, R. B., Rhine, W., & Quan, X.
- Affiliations
- Stanford Medicine (US)
- University of Southern California (US)
- Children's Hospital Los Angeles (US)
- Stanford University (US)
- PyrAmes Inc., Cupertino, CA 95014, USA
- Philips Healthcare, Sunnyvale, CA 94085, USA
- Children's National (US)
- Corresponding author
- Rao, Anoop
- ORCID
- Venue
- Sensors
- Publisher
- MDPI AG
- Published
- 2023-04-02
- Volume
- 23
- Issue
- 7
- Pages
- 3690
- ISSN
- 1424-8220 (ISSN-L)
- PMC
- PMC10098632
- OpenAlex
- W4362578520
- Cited by
- 14
- References
- 20
- Citations by year
- 2026: 2 · 2025: 10 · 2024: 1 · 2023: 1
- FWCI
- 1.11
- Type
- journal article
- Language
- en
- Open access
- gold
- doi.org
- Licence
- Locations
- Sensors (publishedVersion, cc-by)
- PubMed Central (publishedVersion, cc-by)
- PubMed (publishedVersion)
- DOAJ (DOAJ: Directory of Open Access Journals) (submittedVersion, cc-by-sa)
- Funders
- NIH SBIR (1R43HD101175, P50FD006430)
- Food and Drug Administration (1R43HD101175, P50FD006430)
- Southwest Pediatric Device Consortium (1R43HD101175, P50FD006430)
- Stanford’s Maternal and Child Health Research Institute (1R43HD101175, P50FD006430)
- Topics
- Physical Sciences › Engineering › Biomedical Engineering › Non-Invasive Vital Sign Monitoring
- Health Sciences › Medicine › Surgery › Hemodynamic Monitoring and Therapy
- Health Sciences › Medicine › Cardiology and Cardiovascular Medicine › Cardiovascular Health and Disease Prevention
- Keywords
- non-invasive blood pressure monitoring, neonates, preterm infants, capacitive sensors, pulse waveform, artificial neural networks, wearable devices, cardiovascular instability, intensive care
- MeSH terms
- Blood Pressure, Blood Pressure Determination, Humans, Infant, Infant, Newborn, Infant, Premature, Wrist, Arterial Pressure
About these checks
Registry, retraction, Cites and statistics results are computed, not judged, with one exception: a printed reference that no index lists is read once by a model before it counts as a citation error. Claims are extracted by a model and kept only when their quote appears verbatim in the text; each cited source is then checked, with a model’s help, for whether it says what the claim relies on. Those verdicts can be wrong — read the claim’s quote and the cited source before relying on one.
Statistics and arithmetic are recomputed, not judged.
Confidence bands are shown only for fields calibrated on our annotated test set. None is calibrated yet, so no band is shown.
What counts as a claim ›How we measure confidence ›How we check this ›
Are you an author, or do you see a problem with this page? Request a review
