

The DOI matches its Crossref record; 33 of the 33 references it cites were found in a registry or an index.
Detection of Missing Bolts for Engineering Structures in Natural Environment Using Machine Vision and Deep Learning
Open accessAbstract
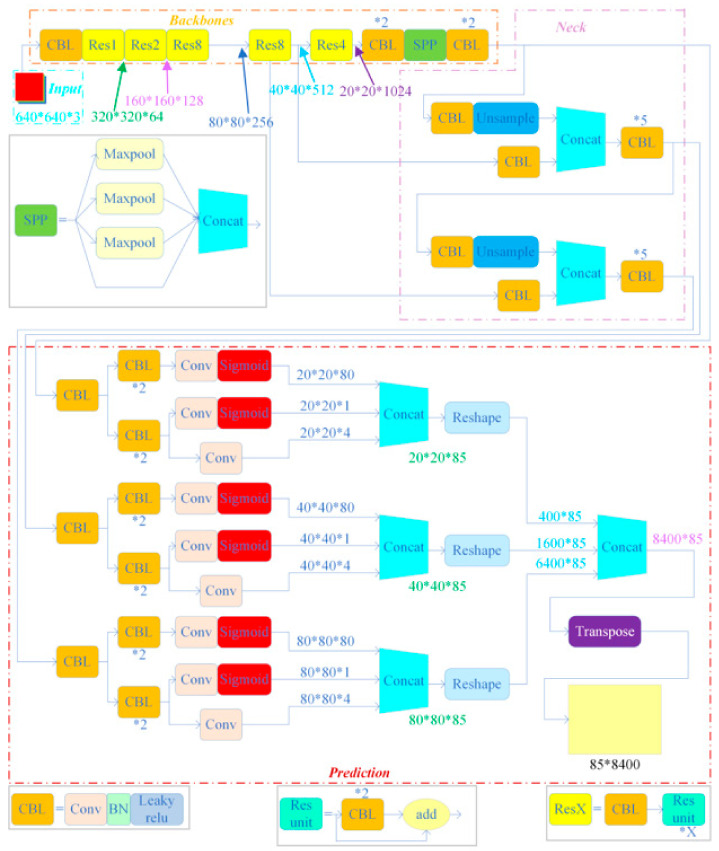
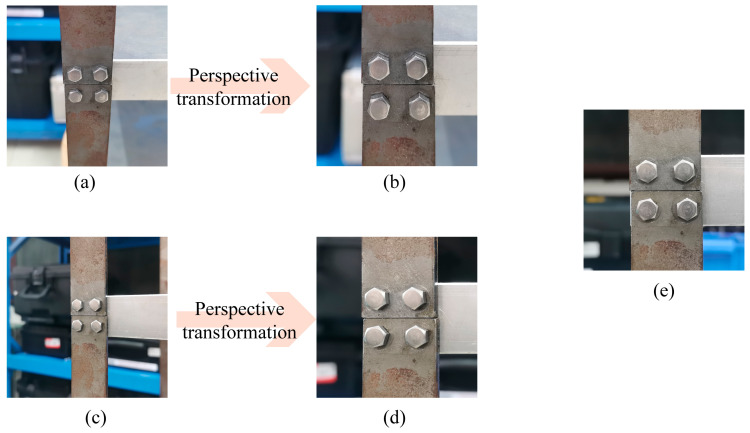
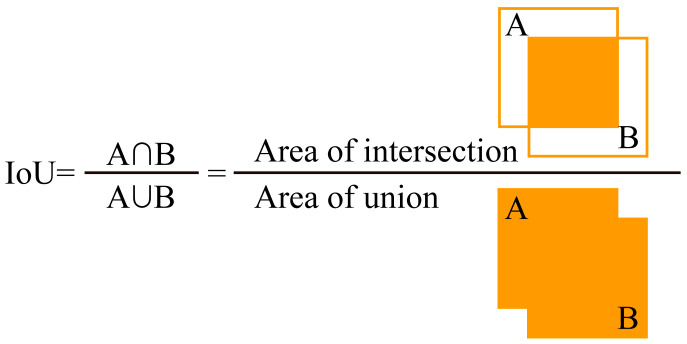
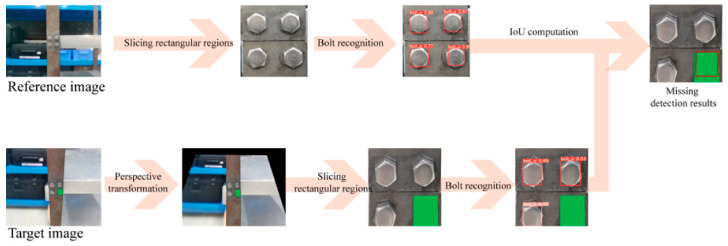
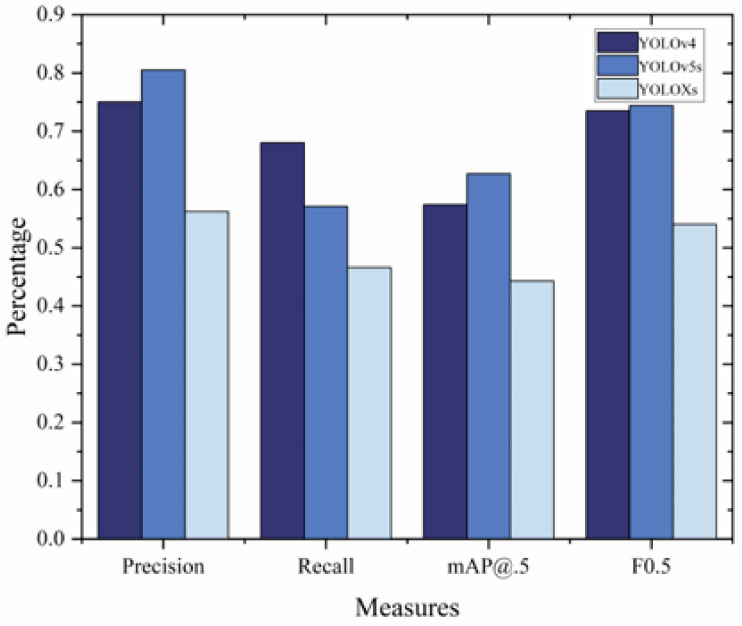
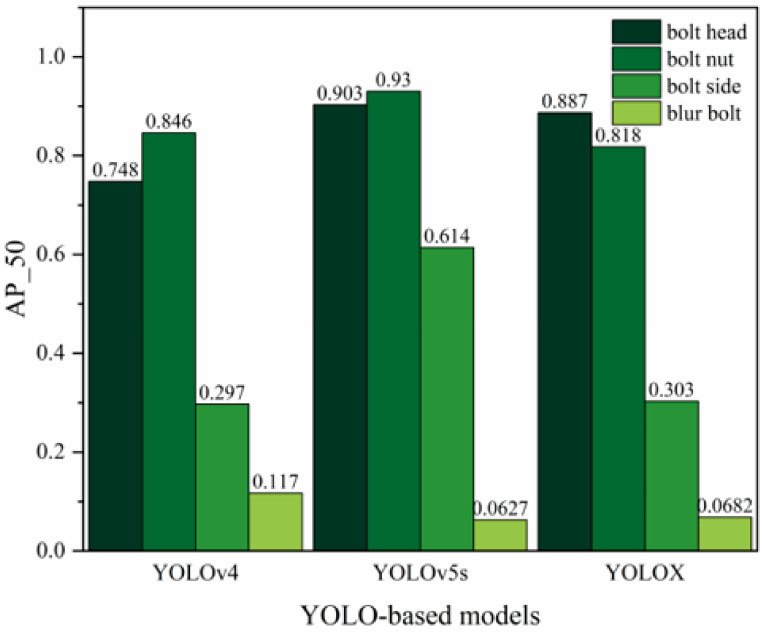
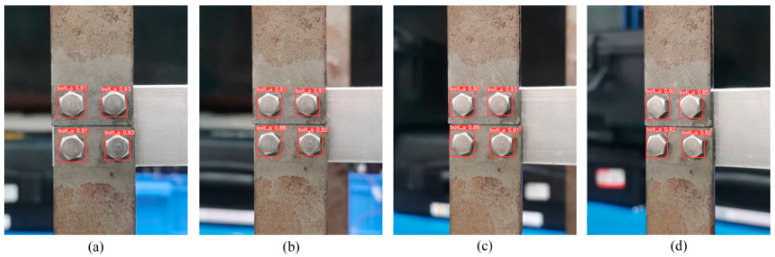
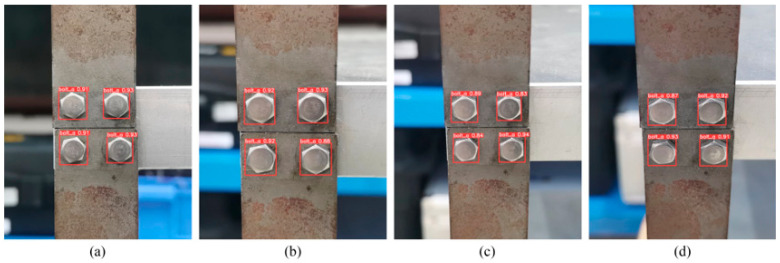
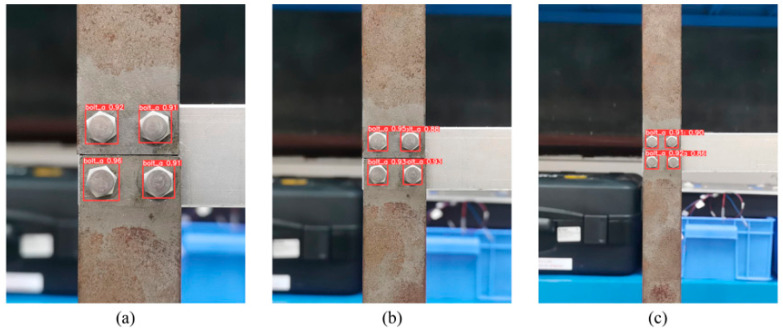
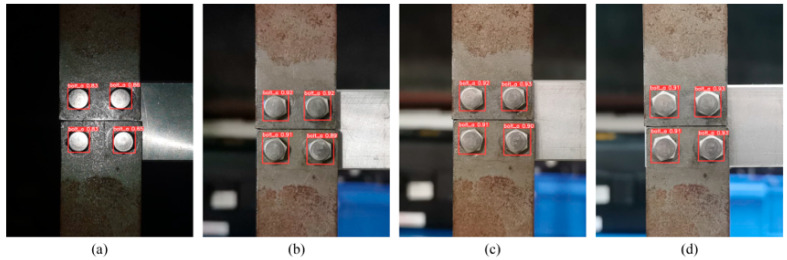
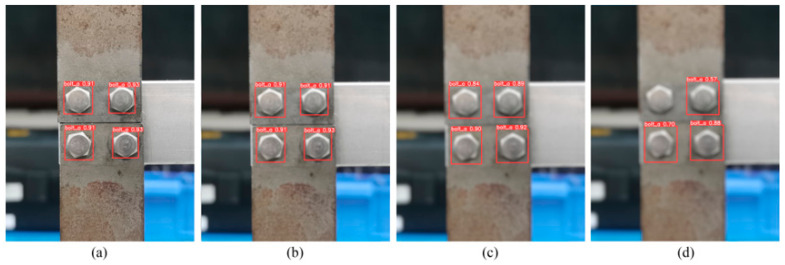
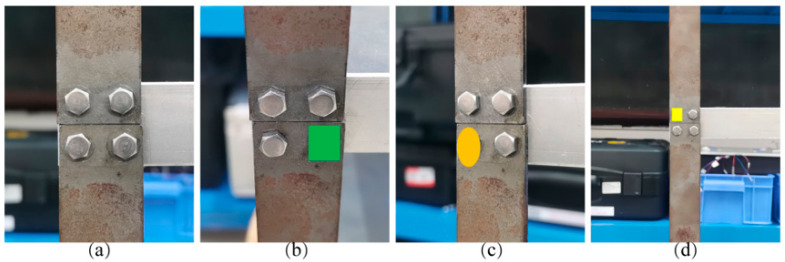
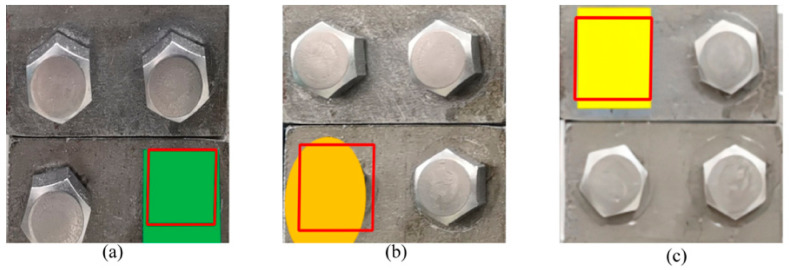
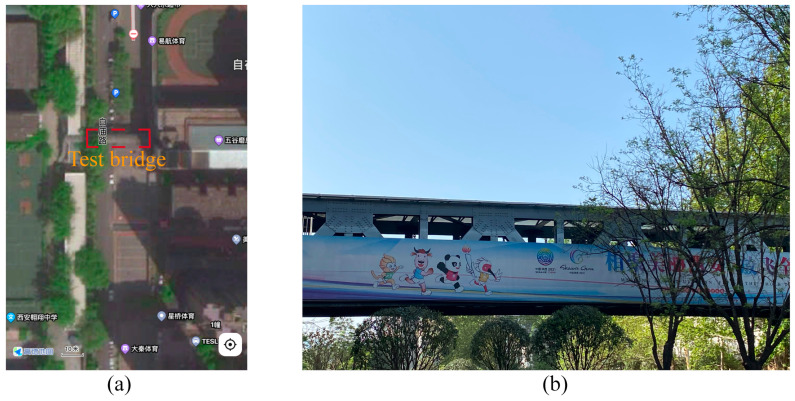
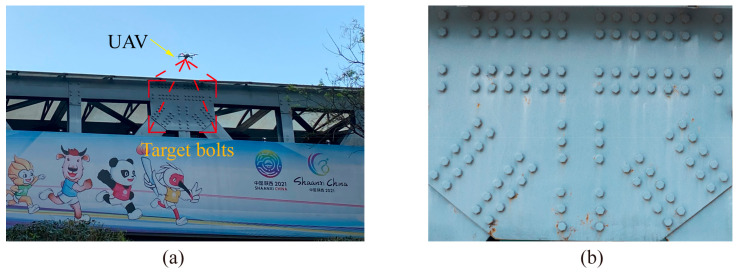
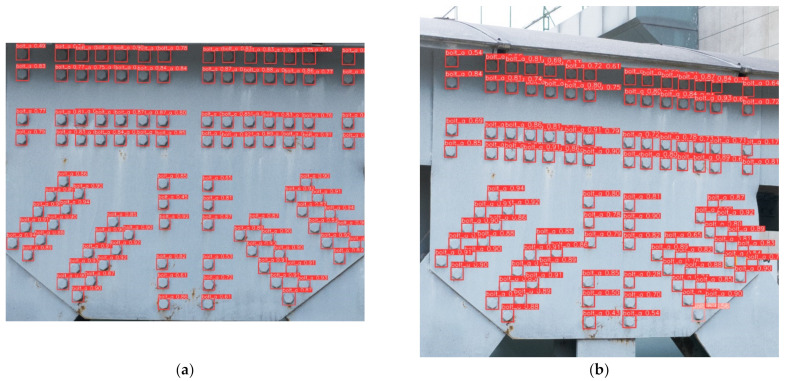
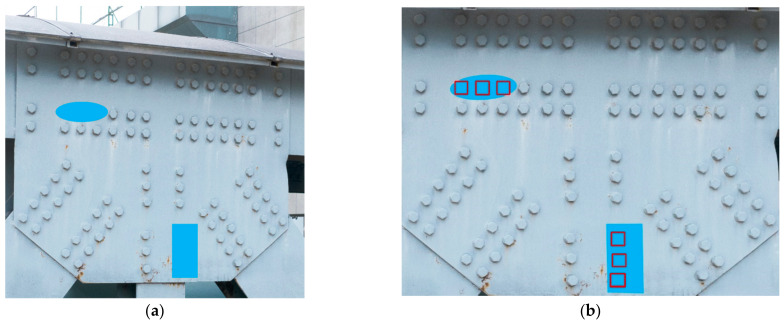
The development of an accurate and efficient method for detecting missing bolts in engineering structures is crucial. To this end, a missing bolt detection method that leveraged machine vision and deep learning was developed. First, a comprehensive dataset of bolt images captured under natural conditions was constructed, which improved the generality and recognition accuracy of the trained bolt target detection model. Second, three deep learning network models, namely, YOLOv4, YOLOv5s, and YOLOXs, were compared, and YOLOv5s was selected as the bolt target detection model. With YOLOv5s as the target recognition model, the bolt head and bolt nut had average precisions of 0.93 and 0.903, respectively. Third, a missing bolt detection method based on perspective transformation and IoU was presented and validated under laboratory conditions. Finally, the proposed method was applied to an actual footbridge structure to test its feasibility and effectiveness in real engineering scenarios. The experimental results showed that the proposed method could accurately identify bolt targets with a confidence level of over 80% and detect missing bolts under different image distances, perspective angles, light intensities, and image resolutions. Moreover, the experimental results on a footbridge demonstrated that the proposed method could reliably detect the missing bolt even at a shooting distance of 1 m. The proposed method provided a low-cost, efficient, and automated technical solution for the safety management of bolted connection components in engineering structures.
Overview
The claims and statistics of this paper haven’t been checked yet.
Run the check — free, no account needed. It reads the open-access text and checks the sources it cites.
Integrity signals
Registry
Cites
Statistics
Figures
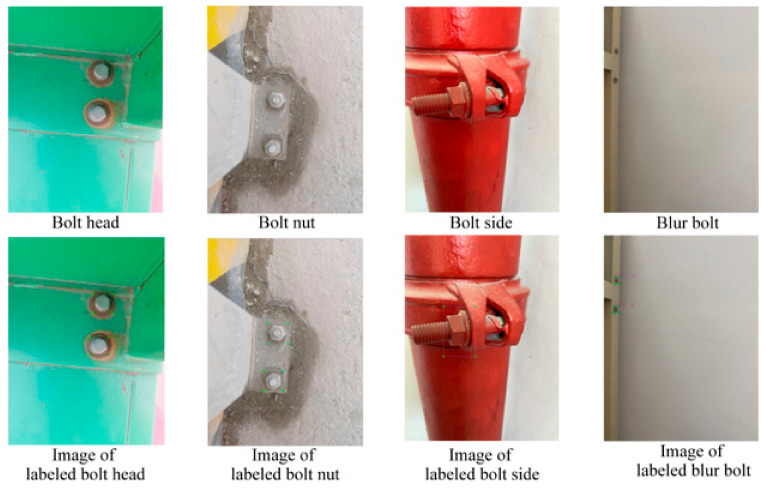
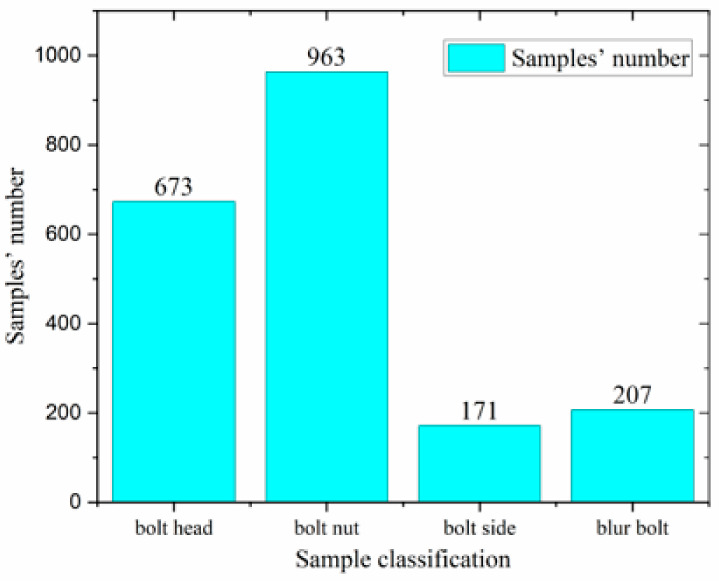
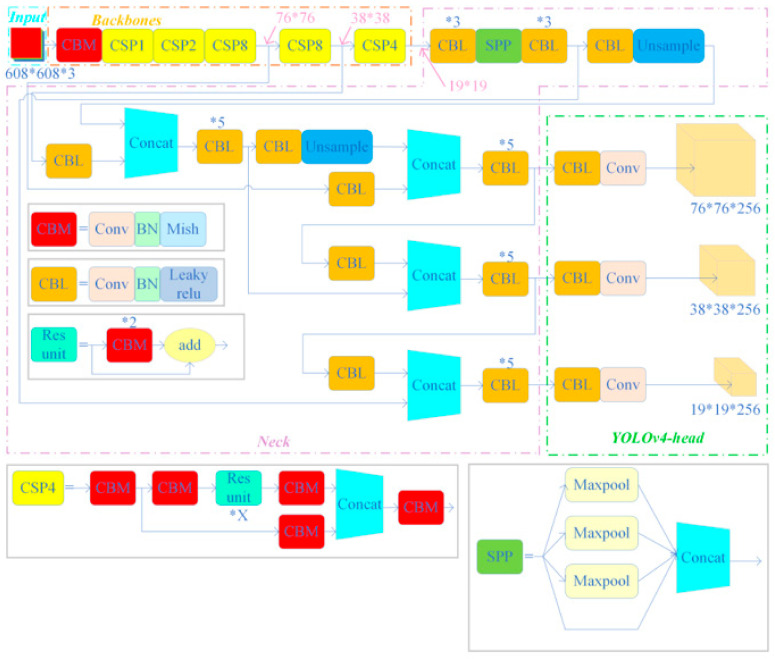
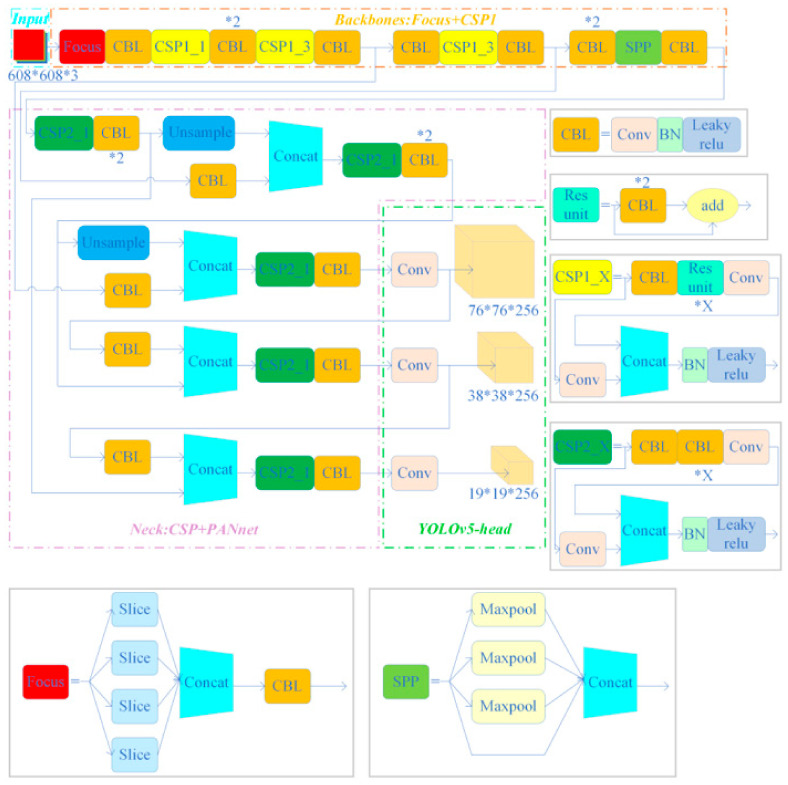
Verification
Claims the paper makes
The claims and statistics of this paper haven’t been checked yet.
Run the check — free, no account needed. It reads the open-access text and checks the sources it cites.
Self-check
Percentages, sums and reported differences re-computed from the paper’s own numbers.
The self-check needs the paper’s full text.
Citations
Cites
Faster R-CNN: Towards Real-Time Object Detection with Region Proposal Networks
Ren, S., He, K., Girshick, R., & Sun, J. (2017) · IEEE Transactions on Pattern Analysis and Machine Intelligence · doi:10.1109/tpami.2016.2577031 · Cited by 73,472
(2016) · Cited by 31,590
SSD: Single Shot MultiBox Detector
Liu, W., Anguelov, D., Erhan, D., Szegedy, C., Reed, S., Fu, C.-Y., & Berg, A. C. (2016) · Lecture Notes in Computer Science · doi:10.1007/978-3-319-46448-0_2 · Cited by 22,128
Path Aggregation Network for Instance Segmentation
Liu, S., Qi, L., Qin, H., Shi, J., & Jia, J. (2018) · 2018 IEEE/CVF Conference on Computer Vision and Pattern Recognition · doi:10.1109/cvpr.2018.00913 · Cited by 10,011
Deep Learning for Generic Object Detection: A Survey
Liu, L., Ouyang, W., Wang, X., Fieguth, P., Chen, J., Liu, X., & Pietikäinen, M. (2020) · International Journal of Computer Vision · doi:10.1007/s11263-019-01247-4 · Cited by 2,965
UnitBox: An Advanced Object Detection Network
Yu, J., Jiang, Y., Wang, Z., Cao, Z., & Huang, T. (2016) · Proceedings of the 24th ACM international conference on Multimedia · doi:10.1145/2964284.2967274 · Cited by 1,731
Mezirow, J. (1978) · Adult Education · doi:10.1177/074171367802800202 · Cited by 1,463
DC-SPP-YOLO: Dense connection and spatial pyramid pooling based YOLO for object detection
Huang, Z., Wang, J., Fu, X., Yu, T., Guo, Y., & Wang, R. (2020) · Information Sciences · doi:10.1016/j.ins.2020.02.067 · Cited by 392
Vision-based detection of loosened bolts using the Hough transform and support vector machines
Cha, Y., You, K., & Choi, W. (2016) · Automation in Construction · doi:10.1016/j.autcon.2016.06.008 · Cited by 330
Comparison of Faster-RCNN, YOLO, and SSD for Real-Time Vehicle Type Recognition
Kim, J.-A., Sung, J.-Y., & Park, S.-H. (2020) · IEEE International Conference on Consumer Electronics-Asia (ICCE-Asia) · doi:10.1109/icce-asia49877.2020.9277040 · Cited by 233
Huynh, T., Park, J. H., Jung, H., & Kim, J. (2019) · Automation in Construction · doi:10.1016/j.autcon.2019.102844 · Cited by 209
Fukuda, Y., Feng, M. Q., Narita, Y., Kaneko, S., & Tanaka, T. (2013) · IEEE Sensors Journal · doi:10.1109/jsen.2013.2273309 · Cited by 199
A Review Paper on Looseness Detection Methods in Bolted Structures
Nikravesh, S. M. Y., & Goudarzi, M. (2017) · Latin American Journal of Solids and Structures · doi:10.1590/1679-78254231 · Cited by 168
Choi, K.-H., & Kim, S. S. (2004) · Corrosion Science · doi:10.1016/j.corsci.2004.05.007 · Cited by 149
Bolt loosening angle detection technology using deep learning
Zhao, X., Zhang, Y., & Wang, N. (2018) · Structural Control and Health Monitoring · doi:10.1002/stc.2292 · Cited by 133
Design of a New Vision-Based Method for the Bolts Looseness Detection in Flange Connections
Wang, C., Wang, N., Ho, S.-C., Chen, X., & Song, G. (2019) · IEEE Transactions on Industrial Electronics · doi:10.1109/tie.2019.2899555 · Cited by 133
Vision-based technique for bolt-loosening detection in wind turbine tower
Park, J.-H., Huynh, T., Choi, S.-H., & Kim, J. (2015) · Wind and Structures · doi:10.12989/was.2015.21.6.709 · Cited by 121
Automated recognition of surface defects using digital color image processing
Lee, S., Chang, L., & Skibniewski, M. J. (2005) · Automation in Construction · doi:10.1016/j.autcon.2005.08.001 · Cited by 111
Bolt-Loosening Monitoring Framework Using an Image-Based Deep Learning and Graphical Model
Pham, H. C., Ta, Q.-B., Kim, J., Ho, D.-D., Tran, X.-L., & Huynh, T. (2020) · Sensors · doi:10.3390/s20123382 · Cited by 87
Vision-Based Detection of Bolt Loosening Using YOLOv5
Sun, Y., Li, M., Dong, R., Chen, W., & Jiang, D. L. (2022) · Sensors · doi:10.3390/s22145184 · Cited by 78
Deep learning‐based bolt loosening detection for wind turbine towers
Yang, X., Gao, Y., Fang, C., Zheng, Y., & We, W. (2022) · Structural Control and Health Monitoring · doi:10.1002/stc.2943 · Cited by 76
Gong, H., Deng, X., Liu, J., & Huang, J. (2021) · Automation in Construction · doi:10.1016/j.autcon.2021.104009 · Cited by 70
A fast template matching-based algorithm for railway bolts detection
Dou, Y., Huang, Y., Li, Q., & Luo, S. (2014) · International Journal of Machine Learning and Cybernetics · doi:10.1007/s13042-013-0223-z · Cited by 61
Near real‐time bolt‐loosening detection using mask and region‐based convolutional neural network
Yuan, C., Chen, W., Hao, H., & Kong, Q. (2021) · Structural Control and Health Monitoring · doi:10.1002/stc.2741 · Cited by 58
A Fast Bolt-Loosening Detection Method of Running Train’s Key Components Based on Binocular Vision
Sun, J., Xie, Y., & Cheng, X. (2019) · IEEE Access · doi:10.1109/access.2019.2900056 · Cited by 46
A Vision-Based Monitoring Method for the Looseness of High-Strength Bolt
Pan, Y., Ma, Y., Dong, Y., Gu, Z., & Wang, D. (2021) · IEEE Transactions on Instrumentation and Measurement · doi:10.1109/tim.2021.3101316 · Cited by 44
Small Aircraft Detection in Remote Sensing Images Based on YOLOv3
Zhao, K., & Ren, X. (2019) · IOP Conference Series Materials Science and Engineering · doi:10.1088/1757-899x/533/1/012056 · Cited by 42
Vision method of inspecting missing fastening components in high-speed railway
Zhang, H., Yang, J., Tao, W., & Zhao, H. Y. (2011) · Applied Optics · doi:10.1364/ao.50.003658 · Cited by 42
Yu, Y., Liu, Y., Chen, J., Jiang, D. L., Zhuang, Z., & Wu, X. (2021) · Sensors · doi:10.3390/s21093106 · Cited by 40
Experimental image and range scanner datasets fusion in SHM for displacement detection
Rivera-Castillo, J., Flores‐Fuentes, W., Rivas-López, M., Sergiyenko, O., Gonzalez-Navarro, F. F., Rodriguez-Quinonez, J. C., Balbuena, D. H., Lindner, L., & Básaca-Preciado, L. C. (2016) · Structural Control and Health Monitoring · doi:10.1002/stc.1967 · Cited by 39
Automated visual inspection of angle cocks during train operation
Zhou, F., Zou, R., Qiu, Y., & Gao, H. (2013) · Proceedings of the Institution of Mechanical Engineers Part F Journal of Rail and Rapid Transit · doi:10.1177/0954409713495532 · Cited by 39
Machine Vision Based Missing Fastener Detection in Rail Track Images Using SVM Classifier
Rajagopal, M., Balasubramanian, M., & Palanivel, S. (2017) · International Journal on Smart Sensing and Intelligent Systems · doi:10.21307/ijssis-2017-271 · Cited by 20
Detection of Nut–Bolt Loss in Steel Bridges Using Deep Learning Techniques
Li, Z., Adamu, K., Yan, K., Xu, X.-L., Shao, P., Li, X.-H., & Bashir, H. M. (2022) · Sustainability · doi:10.3390/su141710837 · Cited by 13
Research works printed but not linked: 6
- Ramana, L., Choi, W., and Cha, Y.-J. (2017). Sensors and Instrumentation, Springer.
- Liu, Y., Huo, L.-s., and Song, G.-b. (2018, January 27–31). Automatic detection on the bolt loose based on digital image processing. Proceedings of the 2018 Structures Congress, Incheon, Republic of Korea.
- Ge, Z., Liu, S., Wang, F., Li, Z., and Sun, J. (2021). Yolox: Exceeding yolo series in 2021. arXiv.
- Redmon, J., and Farhadi, A. (2018). Yolov3: An incremental improvement. arXiv.
- Bochkovskiy, A., Wang, C.-Y., and Liao, H.-Y.M. (2020). Yolov4: Optimal speed and accuracy of object detection. arXiv.
- Misra, D. (2019). Mish: A self regularized non-monotonic neural activation function. arXiv.
Cited by
Sorted by citations
Optimized deep learning for steel bridge bolt corrosion detection and classification
Li, Z., Shao, P., Zhao, M., Yan, K., Liu, G., Wan, L., Xu, X., & Li, K. (2024) · Journal of Constructional Steel Research · doi:10.1016/j.jcsr.2024.108570 · Cited by 32
Lin, T.-H., Chang, C.-T., & Putranto, A. (2024) · Engineering Applications of Artificial Intelligence · doi:10.1016/j.engappai.2024.108618 · Cited by 28
Review of Non-Destructive Testing for Wind Turbine Bolts
Sun, H., Dong, J., Liu, H., Shi, W., Feng, Q., Yao, K., Huang, S., Peng, L., & Cai, Z. (2025) · Sensors · doi:10.3390/s25185726 · Cited by 11
An oversampling method based on FEM for multibolt looseness monitoring using Lamb waves
Yang, J., Hua, M., Yu, T., Wang, T., Xie, J., & Pan, T. (2025) · Structural Health Monitoring · doi:10.1177/14759217241309068 · Cited by 9
Yang, J. N., Hua, M., Wang, T., Xie, J., & He, J. (2024) · Journal of Vibration and Control · doi:10.1177/10775463241260443 · Cited by 6
Metadata
- Authors
- Yang, Z., Zhao, Y., & Xu, C.
- Affiliations
- Northwestern Polytechnical University (CN)
- Corresponding author
- Xu, Chao
- Venue
- Sensors
- Publisher
- MDPI AG
- Published
- 2023-06-16
- Volume
- 23
- Issue
- 12
- Pages
- 5655
- ISSN
- 1424-8220 (ISSN-L)
- PMC
- PMC10304286
- OpenAlex
- W4380993029
- Cited by
- 22
- References
- 33
- Citations by year
- 2026: 7 · 2025: 9 · 2024: 6
- FWCI
- 2.57
- Type
- journal article
- Language
- en
- Open access
- gold
- doi.org
- Licence
- Locations
- Sensors (publishedVersion, cc-by)
- PubMed Central (publishedVersion, cc-by)
- PubMed (publishedVersion)
- DOAJ (DOAJ: Directory of Open Access Journals) (submittedVersion, cc-by-sa)
- Funders
- Suzhou Science and Technology Funding (SWY2021003, S202210699639)
- Provincial College Students’ innovation and entrepreneurship training program (SWY2021003, S202210699639)
- Topics
- Physical Sciences › Engineering › Civil and Structural Engineering › Infrastructure Maintenance and Monitoring
- Physical Sciences › Engineering › Industrial and Manufacturing Engineering › Industrial Vision Systems and Defect Detection
- Physical Sciences › Computer Science › Computer Vision and Pattern Recognition › Advanced Neural Network Applications
- Keywords
- bolted joints, engineering structures, pedestrian bridge, YOLOv5, object detection, homography, intersection over union, structural safety monitoring, image dataset construction
- MeSH terms
- Deep Learning, Engineering, Environment, Laboratories, Light
About these checks
Registry, retraction, Cites and statistics results are computed, not judged, with one exception: a printed reference that no index lists is read once by a model before it counts as a citation error. Claims are extracted by a model and kept only when their quote appears verbatim in the text; each cited source is then checked, with a model’s help, for whether it says what the claim relies on. Those verdicts can be wrong — read the claim’s quote and the cited source before relying on one.
Statistics and arithmetic are recomputed, not judged.
Confidence bands are shown only for fields calibrated on our annotated test set. None is calibrated yet, so no band is shown.
What counts as a claim ›How we measure confidence ›How we check this ›
Are you an author, or do you see a problem with this page? Request a review
