

An Unsupervised Method for Industrial Image Anomaly Detection with Vision Transformer-Based Autoencoder
Open accessThe DOI matches its Crossref record; 42 of the 44 references it cites were found in a registry or an index; 5 of the 29 sources its claims cite were checked for support.
Abstract
Existing industrial image anomaly detection techniques predominantly utilize codecs based on convolutional neural networks (CNNs). However, traditional convolutional autoencoders are limited to local features, struggling to assimilate global feature information. CNNs’ generalizability enables the reconstruction of certain anomalous regions. To mitigate these issues, this study proposes an unsupervised anomaly detection model employing the Vision Transformer (ViT) architecture, incorporating a Transformer structure to understand the global context between image blocks, thereby extracting a superior representation of feature information. It integrates a memory module to catalog normal sample features, both to counteract anomaly reconstruction issues and bolster feature representation, and additionally introduces a coordinate attention (CA) mechanism.
Overview
CoChat Summary
TL;DR
The paper proposes an unsupervised industrial image anomaly detection model combining a ViT-based autoencoder with a memory module and coordinate attention. On MVTec AD and BeanTech AD it reports average image-level AUROC of 91.2% and 92.2%, respectively, with ablation showing the memory and attention modules improve localization.
Key findings
- On MVTec AD, the proposed method achieves average image-level AUROC 91.2%, pixel-level AUROC 93.0%, and PRO 92.3%; it obtains the highest scores in 9 categories, including 100% on hazelnut and screw.
- On BeanTech AD, it reports average image-level AUROC 92.2%, pixel-level AUROC 91.9%, and PRO 91.0%, with improvements over compared methods of 3.6–10.5%, 0.2–10.1%, and 2–37% across those metrics, respectively.
- Ablation on MVTec AD: adding only the memory module increases image-level AUROC, pixel-level AUROC, and PRO by 3.5%, 8%, and 20.9%; adding only coordinate attention increases them by 2.3%, 2.6%, and 6.1%; adding both yields 91.2%, 93.0%, and 92.3%.
- The abstract reports an approximate 20% improvement in average image-level AUROC% over traditional convolutional encoders, while the MVTec AD comparison states overall average performance improved by 14% to 28% versus AE_SSIM, L2-CAE, and VAE.
Methods
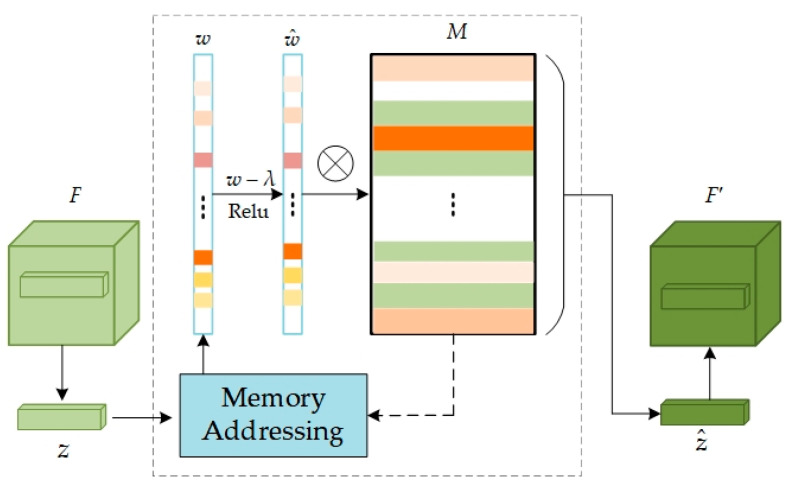
- Unsupervised reconstruction-based anomaly detection: input images are split into patches, processed by a ViT-based encoder, passed through a memory module that stores normal feature patterns via sparse weighted retrieval, enhanced by coordinate attention, and reconstructed by a decoder; anomalies are detected from reconstruction differences.
- Datasets: MVTec AD (5354 high-resolution color images: 3629 normal and 1725 anomalous; 15 categories; resolutions 700 × 700 or 1024 × 1024) and BeanTech AD (2830 RGB images across three industrial products).
- Evaluation uses image-level and pixel-level AUROC and PRO, with comparisons to baselines and an ablation study on MVTec AD. Training settings include 384 × 384 input, 16 × 16 patches, embedding dimension 768, 8 attention heads, 200 epochs, batch size 8, learning rate 0.0002, Adam optimizer, grid search, and Gaussian smoothing post-processing.
Limitations
- Stated: the memory unit requires substantial storage and increases computational demands; current memory storage methods limit the clarity of stored potential features, and future work aims to reduce computation and improve storage/query efficiency.
- Stated: detection results in challenging categories such as transistors are unsatisfactory, possibly because the model struggles to identify and localize subtle anomalies such as missing or misoriented transistors.
- Evident: evaluation is limited to two public datasets, and the paper does not report quantitative runtime or memory measurements despite identifying computational demand as a limitation.
Model-written summary. Check it against the paper before relying on it.
Integrity signals
Registry
Cites
Statistics
Figures




Verification
Claims the paper makes
4 Valid · 8 Not valid · 14 Not checked · 48 Own results and interpretations
Every source the paper cites for this claim was checked and supports it.
In the paper
“It comprises 2830 RGB images across three different industrial products.”
§ An Unsupervised Method for Industrial Image Anomaly Detection with Vision Transformer-Based Autoencoder > 4. Experiments and Results > 4.1. Datasets
What the sources say
- Supportedcites [13] Mishra, P., Verk, R., Fornasier, D., Piciarelli, C., and Foresti, G.L. (2021, January 20–23). VT-ADL: A vision transformer network for image anomaly detectionand localization. Proceedings of the 2021 IEEE 30th International Symposium on Industrial Electronics (ISIE), Kyoto, Japan. source
The Introduction (p. 1) states that BTAD contains 2830 images of three industrial products. The Datasets section (p. 4) specifies that its images are RGB. (LLM, conf=0.95)
plain- Asserted: passes — The authors put it forward as true.
- Checkable: passes — It can be checked against evidence.
- Load-bearing: unclear — It is unclear whether the paper’s conclusions depend on it.
- Based: passes — The paper gives a reason why it holds.
- Supported
The cited sources support only part of this claim — read each source’s verdict below.
In the paper
“The BeanTech AD dataset, designed for unsupervised anomaly detection in industrial settings”
§ An Unsupervised Method for Industrial Image Anomaly Detection with Vision Transformer-Based Autoencoder > 4. Experiments and Results > 4.1. Datasets
What the sources say
- Partly supportedcites [13] Mishra, P., Verk, R., Fornasier, D., Piciarelli, C., and Foresti, G.L. (2021, January 20–23). VT-ADL: A vision transformer network for image anomaly detectionand localization. Proceedings of the 2021 IEEE 30th International Symposium on Industrial Electronics (ISIE), Kyoto, Japan. sourceExperimental — accuracy not yet measured
The Introduction (p. 1) and Experimental Results (p. 4) identify BTAD as a real-world industrial dataset for anomaly detection. The paper does not describe BTAD as designed specifically for unsupervised detection; it calls its normal-only training approach semi-supervised and distinguishes that from unsupervised learning in Related Work (p. 2). (LLM, conf=0.84)
plain- Asserted: passes — The authors put it forward as true.
- Checkable: passes — It can be checked against evidence.
- Load-bearing: unclear — It is unclear whether the paper’s conclusions depend on it.
- Based: passes — The paper gives a reason why it holds.
- Partly supported
A result the paper reports from its own data — it cites no other source for it, so there is none to check. The quote shows it is in the paper.
In the paper
“Experiments conducted on two public datasets, MVTec AD and BeanTech AD, substantiate the method’s effectiveness, demonstrating an approximate 20% improvement in average AUROC% at the image level over traditional convolutional encoders.”
§ An Unsupervised Method for Industrial Image Anomaly Detection with Vision Transformer-Based Autoencoder > Abstract
boostedstates a cause- Asserted: passes — The authors put it forward as true.
- Checkable: passes — It can be checked against evidence.
- Load-bearing: passes — The paper’s conclusions depend on it.
- Based: passes — The paper gives a reason why it holds.
A result the paper reports from its own data — it cites no other source for it, so there is none to check. The quote shows it is in the paper.
In the paper
“with an average score of 91.2%”
- Also stated in: § 4.5. Ablation Experiment and Analysis · plain
“Introducing both M and CA modules improves I-AUROC to 91.2%, P-AUROC to 93.0%, and PRO to 92.3%.”
§ An Unsupervised Method for Industrial Image Anomaly Detection with Vision Transformer-Based Autoencoder > 4. Experiments and Results > 4.4. Comparative Experiment
plain- Asserted: passes — The authors put it forward as true.
- Checkable: passes — It can be checked against evidence.
- Load-bearing: passes — The paper’s conclusions depend on it.
- Based: passes — The paper gives a reason why it holds.
- Also stated in: § 4.5. Ablation Experiment and Analysis · plain
A result the paper reports from its own data — it cites no other source for it, so there is none to check. The quote shows it is in the paper.
In the paper
“the average image-level and pixel-level AUROC scores were 92.2% and 91.9%, respectively”
- Also stated in: § 4.4. Comparative Experiment · plain
“with average image-level and pixel-level AUROC scores of 92.2% and 91.9%, respectively”
§ An Unsupervised Method for Industrial Image Anomaly Detection with Vision Transformer-Based Autoencoder > 4. Experiments and Results > 4.4. Comparative Experiment
plain- Asserted: passes — The authors put it forward as true.
- Checkable: passes — It can be checked against evidence.
- Load-bearing: passes — The paper’s conclusions depend on it.
- Based: passes — The paper gives a reason why it holds.
- Also stated in: § 4.4. Comparative Experiment · plain
26 more claims
Create a free account to see all 74 claims and to verify the 9 references still open.
- Probably not a substantial claim. 21
- It may state two separate claims as one. 29
- The quote only partly states this claim. 1
Self-check
Percentages, sums and reported differences re-computed from the paper’s own numbers.
Each contradiction between two passages listed here was confirmed by an independent check.
Rated minor: it would not touch a result — a value no result rests on, a p-value that stays on the same side of the significance level, or a conflict that is clerical, resolved elsewhere in the paper, or outside its own findings.
In the paper
§ An Unsupervised Method for Industrial Image Anomaly Detection with Vision Transformer-Based Autoencoder > 3. Proposed Method > 3.1. ViT-Based Encoder
“(4)Z0=[Xp1E;Xp2E;…;XpNE]+Epos , E∈R(P2×C)×D , Epos∈R(N+1)×D”
§ An Unsupervised Method for Industrial Image Anomaly Detection with Vision Transformer-Based Autoencoder > 3. Proposed Method
“position embedding Epos∈R(N+1)×D is added to each patch embedding E, and a [cls] token is introduced for global image representation.”
Rated minor: it would not touch a result — a value no result rests on, a p-value that stays on the same side of the significance level, or a conflict that is clerical, resolved elsewhere in the paper, or outside its own findings.
In the paper
§ An Unsupervised Method for Industrial Image Anomaly Detection with Vision Transformer-Based Autoencoder > 5. Conclusions
“The effectiveness of the proposed method has been fully validated through ablation studies on two public datasets and comparisons with contemporary mainstream models.”
§ An Unsupervised Method for Industrial Image Anomaly Detection with Vision Transformer-Based Autoencoder > 4. Experiments and Results > 4.5. Ablation Experiment and Analysis
“This subsection presents an ablation study conducted on the MVTecAD dataset to investigate the effectiveness of different workflow modules, with results displayed in Table 6.”
Rated minor: it would not touch a result — a value no result rests on, a p-value that stays on the same side of the significance level, or a conflict that is clerical, resolved elsewhere in the paper, or outside its own findings.
In the paper
§ An Unsupervised Method for Industrial Image Anomaly Detection with Vision Transformer-Based Autoencoder > 3. Proposed Method > 3.2. Memory Network
“yielding the weight coefficient w (w∈R1×C) for the input feature z with respect to the memory storage unit M”
§ An Unsupervised Method for Industrial Image Anomaly Detection with Vision Transformer-Based Autoencoder > 3. Proposed Method > 3.2. Memory Network
“N denotes the number of feature information items in the memory, and C represents the dimensionality of each feature vector.”
Rated minor: it would not touch a result — a value no result rests on, a p-value that stays on the same side of the significance level, or a conflict that is clerical, resolved elsewhere in the paper, or outside its own findings.
In the paper
§ An Unsupervised Method for Industrial Image Anomaly Detection with Vision Transformer-Based Autoencoder > 3. Proposed Method > 3.5. Loss Functions
“(14)Lent=∑i=1Nw^ilog(w^i)”
§ An Unsupervised Method for Industrial Image Anomaly Detection with Vision Transformer-Based Autoencoder > 3. Proposed Method > 3.5. Loss Functions
“Minimizing the entropy loss encourages the model to adjust the matching probability of certain memory items close to 1 and others near 0”
Citations
Cites
ImageNet classification with deep convolutional neural networks
Krizhevsky, A., Sutskever, I., & Hinton, G. E. (2017) · Communications of the ACM · doi:10.1145/3065386 · Cited by 112,155 · cited 1×
“Feature-based approaches [17–19] commonly employ networks pre-trained on ImageNet [20] to map original images into a more distinguishable feature space.”
BackgroundBERT: Pre-training of Deep Bidirectional Transformers for Language Understanding
Devlin, J., Chang, M.-W., Lee, K., & Toutanova, K. (2018) · arXiv · doi:10.48550/arxiv.1810.04805 · Cited by 73,173
BERT: Pre-training of Deep Bidirectional Transformers for Language Understanding
Devlin, J., Chang, M.-W., Lee, K., & Toutanova, K. (2019) · Proceedings of the 2019 Conference of the North American Chapter of the Association for Computational Linguistics: Human Language Technologies, Volume 1 (Long and Short Papers) · doi:10.18653/v1/n19-1423 · Cited by 54,325
An Image is Worth 16x16 Words: Transformers for Image Recognition at Scale
Dosovitskiy, A., Beyer, L., Kolesnikov, A., Weissenborn, D., Zhai, X., Unterthiner, T., Dehghani, M., Minderer, M., Heigold, G., Gelly, S., et al. (2020) · arXiv · doi:10.48550/arxiv.2010.11929 · Cited by 47,472
Coordinate Attention for Efficient Mobile Network Design
Hou, Q., Zhou, D., & Feng, J. (2021) · 2021 IEEE/CVF Conference on Computer Vision and Pattern Recognition (CVPR) · doi:10.1109/cvpr46437.2021.01350 · Cited by 6,961 · cited 1×
“Coordinate Attention (CA) [33] is a lightweight attention mechanism designed to enhance feature representation.”
BackgroundDeep Learning for Anomaly Detection: A Review
Pang, G., Shen, C., Cao, L., & Hengel, A. V. D. (2022) · ACM Computing Surveys · doi:10.1145/3439950 · Cited by 2,837
Unsupervised Anomaly Detection with Generative Adversarial Networks to Guide Marker Discovery
Schlegl, T., Seeböck, P., Waldstein, S. M., Schmidt-Erfurth, U., & Langs, G. (2017) · Lecture Notes in Computer Science · doi:10.1007/978-3-319-59050-9_12 · Cited by 2,627 · cited 1×
“This subsection presents an ablation study conducted on the MVTecAD dataset to investigate the effectiveness of different workflow modules, with results displayed in Table Table 6 details the average performance across 15 categories in terms of image-level AUROC, pixel-level AUROC, and PRO metrics.”
MethodMVTec AD — A Comprehensive Real-World Dataset for Unsupervised Anomaly Detection
Bergmann, P., Fauser, M., Sattlegger, D., & Steger, C. (2019) · 2019 IEEE/CVF Conference on Computer Vision and Pattern Recognition (CVPR) · doi:10.1109/cvpr.2019.00982 · Cited by 2,203 · cited 2×
“This study employs the MVTec AD dataset [22] and the BeanTech AD dataset [13] for anomaly detection.”
MethodGong, D., Liu, L., Le, V., Saha, B., Mansour, M. R., Venkatesh, S., & Van Den Hengel, A. (2019) · 2019 IEEE/CVF International Conference on Computer Vision (ICCV) · doi:10.1109/iccv.2019.00179 · Cited by 1,930 · cited 1×
“To counteract the effects of excessive generalization, recent strategies aim to constrain the expressive capabilities of the AE’s latent space, incorporating techniques such as memory storage [26], selection and weighting within the latent space [27], and and clustering of features therein [28].”
MethodTowards Total Recall in Industrial Anomaly Detection
Roth, K., Pemula, L., Zepeda, J., Scholkopf, B., Brox, T., & Gehler, P. (2022) · 2022 IEEE/CVF Conference on Computer Vision and Pattern Recognition (CVPR) · doi:10.1109/cvpr52688.2022.01392 · Cited by 1,810
PaDiM: A Patch Distribution Modeling Framework for Anomaly Detection and Localization
Defard, T., Setkov, A., Loesch, A., & Audigier, R. (2021) · Lecture Notes in Computer Science · doi:10.1007/978-3-030-68799-1_35 · Cited by 1,415
CutPaste: Self-Supervised Learning for Anomaly Detection and Localization
Li, C.-L., Sohn, K., Yoon, J., & Pfister, T. (2021) · 2021 IEEE/CVF Conference on Computer Vision and Pattern Recognition (CVPR) · doi:10.1109/cvpr46437.2021.00954 · Cited by 1,107 · cited 1×
“Fully supervised learning methods [6,7], used in deep learning, depend on datasets meticulously labeled by experts for model training.”
MethodDRÆM – A discriminatively trained reconstruction embedding for surface anomaly detection
Zavrtanik, V., Kristan, M., & Skocaj, D. (2021) · 2021 IEEE/CVF International Conference on Computer Vision (ICCV) · doi:10.1109/iccv48922.2021.00822 · Cited by 1,086
Uninformed Students: Student-Teacher Anomaly Detection With Discriminative Latent Embeddings
Bergmann, P., Fauser, M., Sattlegger, D., & Steger, C. (2020) · 2020 IEEE/CVF Conference on Computer Vision and Pattern Recognition (CVPR) · doi:10.1109/cvpr42600.2020.00424 · Cited by 990 · cited 2×
“Conversely, Table 4 details each model’s performance on anomaly localization, evaluated by pixel-level AUROC and PRO scores, with average scores of 93.0% and 92.3%, respectively, across the dataset. ing highest scores across all evaluation metrics.”
BackgroundInfluentialReconstruction by inpainting for visual anomaly detection
Zavrtanik, V., Kristan, M., & Skočaj, D. (2021) · Pattern Recognition · doi:10.1016/j.patcog.2020.107706 · Cited by 732 · cited 2×
“Gaussian smoothing serves as a post-processing technique for image anomaly detection, generating a final score map by distributing each pixel’s score in a Gaussian distribution, a technique applied in various studies [34–36].”
MethodPatch SVDD: Patch-Level SVDD for Anomaly Detection and Segmentation
Yi, J., & Yoon, S. (2021) · Lecture Notes in Computer Science · doi:10.1007/978-3-030-69544-6_23 · Cited by 551
VT-ADL: A Vision Transformer Network for Image Anomaly Detection and Localization
Mishra, P., Verk, R., Fornasier, D., Piciarelli, C., & Foresti, G. L. (2021) · 2021 IEEE 30th International Symposium on Industrial Electronics (ISIE) · doi:10.1109/isie45552.2021.9576231 · Cited by 462 · cited 4×
“This study employs the MVTec AD dataset [22] and the BeanTech AD dataset [13] for anomaly detection.”
MethodInfluentialScaling Local Self-Attention for Parameter Efficient Visual Backbones
Vaswani, A., Ramachandran, P., Srinivas, A., Parmar, N., Hechtman, B., & Shlens, J. (2021) · 2021 IEEE/CVF Conference on Computer Vision and Pattern Recognition (CVPR) · doi:10.1109/cvpr46437.2021.01270 · Cited by 453
Improving Unsupervised Defect Segmentation by Applying Structural Similarity to Autoencoders
Bergmann, P., Löwe, S., Fauser, M., Sattlegger, D., & Steger, C. (2019) · Proceedings of the 14th International Joint Conference on Computer Vision, Imaging and Computer Graphics Theory and Applications · doi:10.5220/0007364500002108 · Cited by 336 · cited 1×
“This subsection presents an ablation study conducted on the MVTecAD dataset to investigate the effectiveness of different workflow modules, with results displayed in Table Table 6 details the average performance across 15 categories in terms of image-level AUROC, pixel-level AUROC, and PRO metrics.”
MethodAnomaly detection of defects on concrete structures with the convolutional autoencoder
Chow, J. K., Su, Z., Wu, J., Tan, P. S., Mao, X., & Wang, Y. H. (2020) · Advanced Engineering Informatics · doi:10.1016/j.aei.2020.101105 · Cited by 336 · cited 1×
“In unsupervised anomaly detection, deep codec structures based on convolutional neural networks (CNNs) are commonly employed, notably the Convolutional AutoEncoder (CAE) [10], which compresses a normal image and reconstructs it to resemble the original.”
MethodSelf-Supervised Predictive Convolutional Attentive Block for Anomaly Detection
Ristea, N.-C., Madan, N., Ionescu, R. T., Nasrollahi, K., Khan, F. S., Moeslund, T. B., & Shah, M. (2022) · 2022 IEEE/CVF Conference on Computer Vision and Pattern Recognition (CVPR) · doi:10.1109/cvpr52688.2022.01321 · Cited by 315
Attention Guided Anomaly Localization in Images
Venkataramanan, S., Peng, K.-C., Singh, R. V., & Mahalanobis, A. (2020) · Lecture Notes in Computer Science · doi:10.1007/978-3-030-58520-4_29 · Cited by 247 · cited 1×
“This subsection presents an ablation study conducted on the MVTecAD dataset to investigate the effectiveness of different workflow modules, with results displayed in Table Table 6 details the average performance across 15 categories in terms of image-level AUROC, pixel-level AUROC, and PRO metrics.”
MethodFastFlow: Unsupervised Anomaly Detection and Localization via 2D Normalizing Flows
Yu, J., Zheng, Y., Wang, X., Li, W., Wu, Y., Zhao, R., & Wu, L. (2021) · arXiv · doi:10.48550/arxiv.2111.07677 · Cited by 210
Defect-GAN: High-Fidelity Defect Synthesis for Automated Defect Inspection
Zhang, G., Cui, K., Hung, T.-Y., & Lu, S. (2021) · 2021 IEEE Winter Conference on Applications of Computer Vision (WACV) · doi:10.1109/wacv48630.2021.00257 · Cited by 200 · cited 1×
“Fully supervised learning methods [6,7], used in deep learning, depend on datasets meticulously labeled by experts for model training.”
MethodLearning Semantic Context from Normal Samples for Unsupervised Anomaly Detection
Yan, X., Zhang, H., Xu, X., Hu, X., & Heng, P.-A. (2021) · Proceedings of the AAAI Conference on Artificial Intelligence · doi:10.1609/aaai.v35i4.16420 · Cited by 177
Tang, T.-W., Kuo, W.-H., Lan, J.-H., Ding, C.-F., Hsu, H., & Young, H.-T. (2020) · Sensors · doi:10.3390/s20123336 · Cited by 148 · cited 1×
“Classic examples of reconstruction-based methods encompass auto-encoder (AE) [23], variational auto-encoder (VAE) [24] and generative adversarial network (GAN) [25].”
BackgroundLee, Y., & Kang, P. (2022) · arXiv · doi:10.48550/arxiv.2203.10808 · Cited by 123
Lee, Y., & Kang, P. (2022) · IEEE Access · doi:10.1109/access.2022.3171559 · Cited by 122 · cited 4×
“Lee et al. [14] introduced AnoViT, an encoder-decoder model based on the Vision Transformer, asserting its superiority over CNN-based L2-CAE in anomaly detection.”
BackgroundMethodInfluentialDeep Learning for Anomaly Detection
Wang, R., Nie, K., Wang, T., Yang, Y., & Long, B. (2020) · Proceedings of the 13th International Conference on Web Search and Data Mining · doi:10.1145/3336191.3371876 · Cited by 100 · cited 1×
“Reconstruction-based approaches [21] are more prevalent, based on the assumption that models trained on normal samples excel in reconstructing normal patterns but falter with abnormal regions.”
BackgroundNotice of Removal: Multiresolution Knowledge Distillation for Anomaly Detection
Salehi, M., Sadjadi, N., Baselizadeh, S., Rohban, M. H., & Rabiee, H. R. (2021) · 2021 IEEE/CVF Conference on Computer Vision and Pattern Recognition (CVPR) · doi:10.1109/cvpr46437.2021.01466 · Cited by 97
Visual Anomaly Detection for Images: A Systematic Survey
Yang, J., Xu, R., Qi, Z., & Shi, Y. (2022) · Procedia Computer Science · doi:10.1016/j.procs.2022.01.057 · Cited by 77
Anomaly localization by modeling perceptual featuresPreprint
Dehaene, D., & Eline, P. (2020) · arXiv (Cornell University) · doi:10.48550/arxiv.2008.05369 · Cited by 68
An Anomaly Feature-Editing-Based Adversarial Network for Texture Defect Visual Inspection
Yang, H., Zhou, Q., Song, K., & Yin, Z. (2021) · IEEE Transactions on Industrial Informatics · doi:10.1109/tii.2020.3015765 · Cited by 60 · cited 1×
“To counteract the effects of excessive generalization, recent strategies aim to constrain the expressive capabilities of the AE’s latent space, incorporating techniques such as memory storage [26], selection and weighting within the latent space [27], and and clustering of features therein [28].”
MethodPatch SVDD: Patch-level SVDD for Anomaly Detection and SegmentationPreprint
Yi, J., & Yoon, S. (2020) · arXiv (Cornell University) · doi:10.48550/arxiv.2006.16067 · Cited by 58
FAPM: Fast Adaptive Patch Memory for Real-Time Industrial Anomaly Detection
Kim, D., Park, C., Cho, S., & Lee, S. (2023) · ICASSP 2023 - 2023 IEEE International Conference on Acoustics, Speech and Signal Processing (ICASSP) · doi:10.1109/icassp49357.2023.10096400 · Cited by 56 · cited 2×
“Gaussian smoothing serves as a post-processing technique for image anomaly detection, generating a final score map by distributing each pixel’s score in a Gaussian distribution, a technique applied in various studies [34–36].”
MethodAn Effective Framework of Automated Visual Surface Defect Detection for Metal Parts
Qiu, K., Luo, T., & Wang, P. (2021) · IEEE Sensors Journal · doi:10.1109/jsen.2021.3095410 · Cited by 46 · cited 1×
“For instance, Qiu et al. [8] developed a framework featuring an image alignment module and a defect detection module for identifying defects on metal surfaces.”
BackgroundGaussian Mixture Variational Autoencoder with Contrastive Learning for Multi-Label ClassificationPreprint
Bai, J., Kong, S., & Gomes, C. P. (2021) · arXiv (Cornell University) · doi:10.48550/arxiv.2112.00976 · Cited by 38
Logit Inducing With Abnormality Capturing for Semi-Supervised Image Anomaly Detection
Wan, Q., Gao, L., & Li, X. (2022) · IEEE Transactions on Instrumentation and Measurement · doi:10.1109/tim.2022.3205674 · Cited by 22
Iterative energy-based projection on a normal data manifold for anomaly localization
Dehaene, D., Frigo, O., Combrexelle, S., & Eline, P. (2020) · arXiv (Cornell University) · doi:10.48550/arxiv.2002.03734 · Cited by 20
Anomaly Detection Based on Selection and Weighting in Latent Space
Liao, Y., Bartler, A., & Yang, B. (2021) · 2021 IEEE 17th International Conference on Automation Science and Engineering (CASE) · doi:10.1109/case49439.2021.9551267 · Cited by 17 · cited 1×
“To counteract the effects of excessive generalization, recent strategies aim to constrain the expressive capabilities of the AE’s latent space, incorporating techniques such as memory storage [26], selection and weighting within the latent space [27], and and clustering of features therein [28].”
MethodHaloAE: An HaloNet based Local Transformer Auto-Encoder for Anomaly Detection and Localization
Mathian, É., Liu, H.-D., Fernandez-Cuesta, L., Samaras, D., Foll, M., & Chen, L.-M. (2022) · VISIGRAPP · doi:10.5220/0011865900003417 · Cited by 16 · cited 1×
“HaloAE [15] integrates the Transformer with HaloNet [16], facilitating image reconstruction and achieving competitive results on the MVTec AD dataset.”
MethodA Vision Based System for Anomaly Detection and Classification in Additive Manufacturing
Chen, W. J., Ho, J.-H., Mustapha, K. B., & Chai, T.-Y. (2019) · 2019 IEEE Conference on Sustainable Utilization and Development in Engineering and Technologies (CSUDET) · doi:10.1109/csudet47057.2019.9214635 · Cited by 10
Research works printed but not linked: 6
- Zhou, 2021, A template matching based monochrome fabric defect detection algorithm, Meas. Control Technol., 40, 6
- Luo, 2022, A review of deep learning methods for industrial defect detection, Sci. China Inf. Sci., 52, 1002
- Liu, 2022, Research progress on transformer based on computer vision, Comput. Eng. Appl., 58, 1
- Li, 2023, Unsupervised wafer defect detection based on improved generative adversarial networks, Electron. Meas. Technol., 46, 91
- Vaswani, A., Shazeer, N., Parmar, N., Uszkoreit, J., Jones, L., Gomez, A.N., Kaiser, Ł., and Polosukhin, I. (2017, January 4–9). Attention is all you need. Proceedings of the 31st International Conference on Neural Information Processing Systems, Long Beach, CA, USA.
- Schubert, E., Reyes, N., and Connor, R. (October, January 29). A triangle inequality for cosine similarity. Proceedings of the International Conference on Similarity Search and Applications, Dortmund, Germany.
Cited by
A Survey on Surface Defect Inspection Based on Generative Models in Manufacturing
He, Y., Li, S., Wen, X., & Xu, J. (2024) · Applied Sciences · doi:10.3390/app14156774 · Cited by 35
Hussein, L., Babu, N. R., Guttikonda, B. S., et al. (2025) · International Conference on Distributed Computing and Electrical Circuits and Electronics (ICDCECE) · doi:10.1109/icdcece65353.2025.11035252 · Cited by 20
“In this research, MVTec AD dataset is utilized, which is considered as a comprehensive and benchmark dataset particularly designed for image anomalies detection in industrial environment [16].”
A survey on industrial image anomaly detection: methods, benchmarks and rethinks
Yu, M., Chen, Z., Liu, Y., Dong, C., & Song, K. (2025) · Measurement · doi:10.1016/j.measurement.2025.118377 · Cited by 23
Enhancing underwater thruster anomaly detection with support vector glow encoding description
Du, W., Xiong, Z., Zhu, P., et al. (2024) · Ocean Engineering · doi:10.1016/j.oceaneng.2024.119655 · Cited by 12
Industrial Image Anomaly Detection via Self-Supervised Learning with Feature Enhancement Assistance
Wu, B., & Wang, X. (2024) · Applied Sciences · doi:10.3390/app14167301 · Cited by 11
Metadata
- Authors
- Yang, Q., & Guo, R.
- Affiliations
- Sichuan Normal University (CN)
- Corresponding author
- Yang, Qiying
- ORCID
- Guo, Rongzuo
- Venue
- Sensors
- Publisher
- MDPI AG
- Published
- 2024-04-11
- Volume
- 24
- Issue
- 8
- Pages
- 2440
- ISSN
- 1424-8220 (ISSN-L)
- PMC
- PMC11054379
- OpenAlex
- W4394726689
- Cited by
- 35
- References
- 44
- Citations by year
- 2026: 10 · 2025: 19 · 2024: 6
- FWCI
- 7.14
- Type
- journal article
- Language
- en
- Open access
- gold
- doi.org
- Licence
- Locations
- Sensors (publishedVersion, cc-by)
- PubMed Central (publishedVersion, cc-by)
- PubMed (publishedVersion)
- DOAJ (DOAJ: Directory of Open Access Journals) (submittedVersion)
- Funders
- National Natural Science Foundation of China (11905153, 61701331)
- Topics
- Physical Sciences › Engineering › Industrial and Manufacturing Engineering › Industrial Vision Systems and Defect Detection
- Physical Sciences › Computer Science › Artificial Intelligence › Anomaly Detection Techniques and Applications
- Physical Sciences › Computer Science › Computer Vision and Pattern Recognition › Advanced Neural Network Applications
- Keywords
- unsupervised anomaly detection, vision transformer, transformer-based autoencoder, memory modules, coordinate attention, anomaly localization, global feature representation, class imbalance, MVTec AD
About these checks
Registry, retraction, Cites and statistics results are computed, not judged, with one exception: a printed reference that no index lists is read once by a model before it counts as a citation error. Claims are extracted by a model and kept only when their quote appears verbatim in the text; each cited source is then checked, with a model’s help, for whether it says what the claim relies on. Those verdicts can be wrong — read the claim’s quote and the cited source before relying on one.
The claim verdicts this report counts are experimental: their accuracy is not yet measured.
A language model drew the claims from the paper on 2026-10-10, under version 3 of the claim definition (model deepseek-v4.1-flash, prompt extract-v3).
A second model labelled each claim on 2026-10-10 (model jev-1.13-20260917, definition revision gold-guideline-v0.2).
Cited sources are checked with a language model’s help (gpt-6-sol).
Statistics and arithmetic are recomputed, not judged.
Confidence bands are shown only for fields calibrated on our annotated test set. None is calibrated yet, so no band is shown.
What counts as a claim ›How we measure confidence ›How we check this ›
Are you an author, or do you see a problem with this page? Request a review
Data sources
Bibliographic data: Semantic Scholar, OpenAlex, Crossref.
Contains information from the Semantic Scholar Academic Graph Datasets, made available under the ODC Attribution License (ODC-BY 1.0).
Semantic Scholar’s data is described in: Kinney, R., et al. (2023). The Semantic Scholar Open Data Platform. arXiv:2301.10140.
