

The DOI matches its Crossref record; 25 of the 26 references it cites were found in a registry or an index.
The Three-Month Effects of a Ketogenic Diet on Body Composition, Blood Parameters, and Performance Metrics in CrossFit Trainees: A Pilot Study
Open accessAbstract
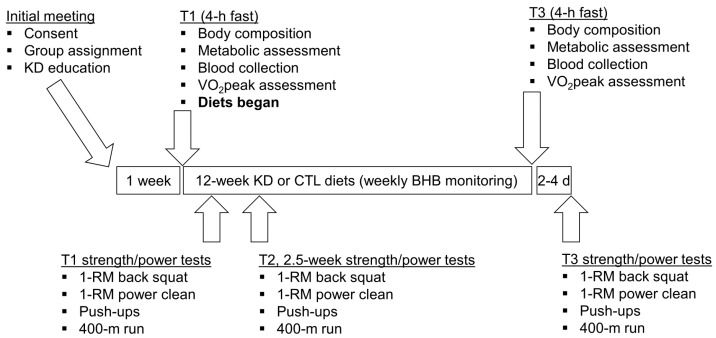
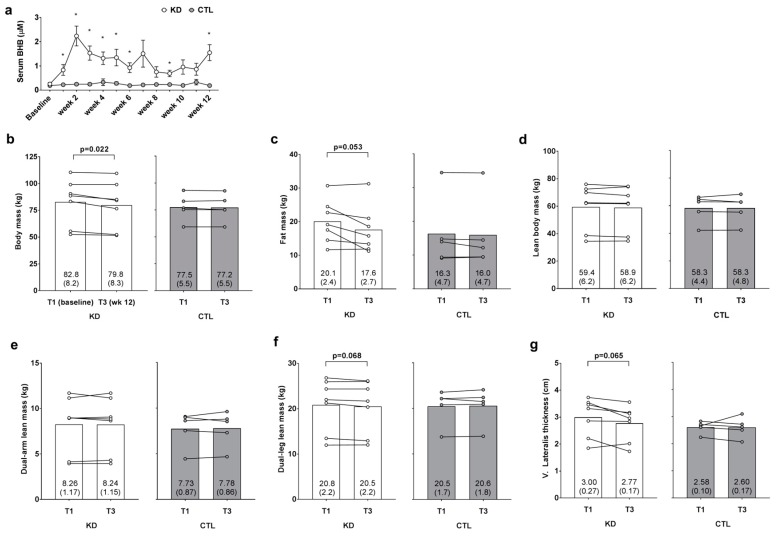
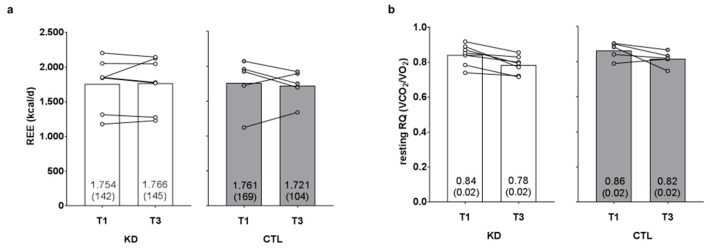
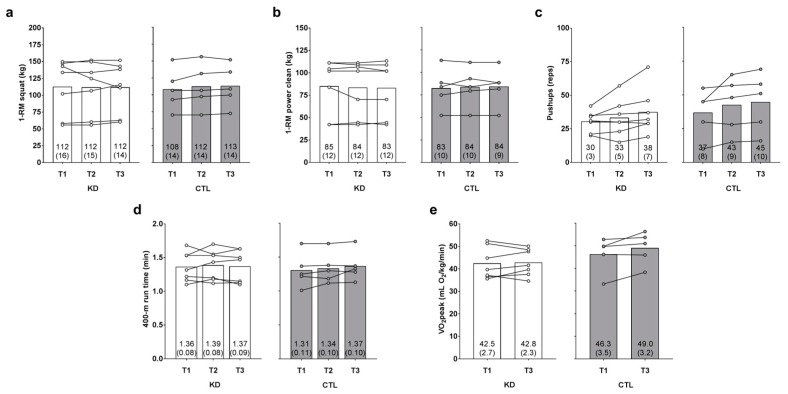
Adopting low carbohydrate, ketogenic diets remains a controversial issue for individuals who resistance train given that this form of dieting has been speculated to reduce skeletal muscle glycogen levels and stifle muscle anabolism. We sought to characterize the effects of a 12-week ketogenic diet (KD) on body composition, metabolic, and performance parameters in participants who trained recreationally at a local CrossFit facility. Twelve participants (nine males and three females, 31 ± 2 years of age, 80.3 ± 5.1 kg body mass, 22.9 ± 2.3% body fat, 1.37 back squat: body mass ratio) were divided into a control group (CTL; n = 5) and a KD group (n = 7). KD participants were given dietary guidelines to follow over 12 weeks while CTL participants were instructed to continue their normal diet throughout the study, and all participants continued their CrossFit training routine for 12 weeks. Pre, 2.5-week, and 12-week anaerobic performance tests were conducted, and pre- and 12-week tests were performed for body composition using dual X-ray absorptiometry (DXA) and ultrasound, resting energy expenditure (REE), blood-serum health markers, and aerobic capacity. Additionally, blood beta hydroxybutyrate (BHB) levels were measured weekly. Blood BHB levels were 2.8- to 9.5-fold higher in KD versus CTL throughout confirming a state of nutritional ketosis. DXA fat mass decreased by 12.4% in KD (p = 0.053). DXA total lean body mass changes were not different between groups, although DXA dual-leg lean mass decreased in the KD group by 1.4% (p = 0.068), and vastus lateralis thickness values decreased in the KD group by ~8% (p = 0.065). Changes in fasting glucose, HDL cholesterol, and triglycerides were similar between groups, although LDL cholesterol increased ~35% in KD (p = 0.048). Between-group changes in REE, one-repetition maximum (1-RM) back squat, 400 m run times, and VO2peak were similar between groups. While our n-sizes were limited, these preliminary data suggest that adopting a ketogenic diet causes marked reductions in whole-body adiposity while not impacting performance measures in recreationally-trained CrossFit trainees. Whether decrements in dual-leg muscle mass and vastus lateralis thickness in KD participants were due to fluid shifts remain unresolved, and increased LDL-C in these individuals warrants further investigation.
Overview
The claims and statistics of this paper haven’t been checked yet.
Run the check — free, no account needed. It reads the open-access text and checks the sources it cites.
Integrity signals
Registry
Cites
Statistics
Figures
Verification
Claims the paper makes
The claims and statistics of this paper haven’t been checked yet.
Run the check — free, no account needed. It reads the open-access text and checks the sources it cites.
Claims other papers make about this one
Each is checked against this paper’s own text: does it say what the citing paper says it does?
The check wasn’t confident either way, so it gives no verdict — never disputed.
In the citing paper
“In addition, strategies that could mitigate the likelihood of LPS release into the blood and, thus, endotoxin-associated symptoms, include limiting the consumption of saturated fat [138], avoiding the consumption of non-steroidal anti-inflammatory drugs (NSAIDs) [139], and maintaining an adequate water intake [139].”
From International Society of Sports Nutrition Position Stand: nutritional considerations for single-stage ultra-marathon training and racing (2019) · cites this paper as [139]
Experimental — accuracy not yet measuredIn the citing paper
“In addition, strategies that could mitigate the likelihood of LPS release into the blood and, thus, endotoxin-associated symptoms, include limiting the consumption of saturated fat [138], avoiding the consumption of non-steroidal anti-inflammatory drugs (NSAIDs) [139], and maintaining an adequate water intake [139].”
From International Society of Sports Nutrition Position Stand: nutritional considerations for single-stage ultra-marathon training and racing (2019) · cites this paper as [139]
Self-check
Percentages, sums and reported differences re-computed from the paper’s own numbers.
The self-check needs the paper’s full text.
Citations
Cites
Brehm, B. J., Seeley, R. J., Daniels, S. R., & D’Alessio, D. A. (2003) · The Journal of Clinical Endocrinology & Metabolism · doi:10.1210/jc.2002-021480 · Cited by 830
International Society of Sports Nutrition position stand: protein and exercise
Campbell, B., Kreider, R. B., Ziegenfuss, T., La Bounty, P., Roberts, M., Burke, D., Landis, J., Lopez, H., & Antonio, J. (2007) · Journal of the International Society of Sports Nutrition · doi:10.1186/1550-2783-4-8 · Cited by 716
Self-citationA high-fat, ketogenic diet induces a unique metabolic state in mice
Kennedy, A. R., Pissios, P., Otu, H., Xue, B., Asakura, K., Furukawa, N., Marino, F. E., Liu, F.-F., Kahn, B. B., Libermann, T. A., et al. (2007) · American Journal of Physiology-Endocrinology and Metabolism · doi:10.1152/ajpendo.00717.2006 · Cited by 420
Burke, L. M., Ross, M. L., Garvican‐Lewis, L. A., Welvaert, M., Heikura, I. A., Forbes, S. G., Mirtschin, J. G., Cato, L. E., Strobel, N., Sharma, A. P., et al. (2017) · The Journal of Physiology · doi:10.1113/jp273230 · Cited by 407
Carbohydrate Restriction has a More Favorable Impact on the Metabolic Syndrome than a Low Fat Diet
Volek, J. S., Phinney, S. D., Forsythe, C. E., Quann, E. E., Wood, R. J., Puglisi, M. J., Kraemer, W. J., Bibus, D. M., Fernandez, M. L., & Feinman, R. D. (2009) · Lipids · doi:10.1007/s11745-008-3274-2 · Cited by 397
Metabolic characteristics of keto-adapted ultra-endurance runners
Volek, J. S., Freidenreich, D. J., Saenz, C., Kunces, L. J., Creighton, B. C., Bartley, J. M., Davitt, P. M., Munoz, C. X., Anderson, J. M., Maresh, C. M., et al. (2016) · Metabolism · doi:10.1016/j.metabol.2015.10.028 · Cited by 311
Longland, T. M., Oikawa, S. Y., Mitchell, C. J., Devries, M. C., & Phillips, S. M. (2016) · The American Journal of Clinical Nutrition · doi:10.3945/ajcn.115.119339 · Cited by 271
Gomez-Arbelaez, D., Bellido, D., Castro, A. I., Ordoñez-Mayan, L., Carreira, J., Galban, C., Martinez-Olmos, M. A., Crujeiras, A. B., Sajoux, I., & Casanueva, F. F. (2017) · The Journal of Clinical Endocrinology & Metabolism · doi:10.1210/jc.2016-2385 · Cited by 214
The Effects of a Ketogenic Diet on Exercise Metabolism and Physical Performance in Off-Road Cyclists
Zajac, A., Poprzecki, S., Maszczyk, A., Czuba, M., Michalczyk, M., & Zydek, G. (2014) · Nutrients · doi:10.3390/nu6072493 · Cited by 184
Carbohydrate Nutrition and Team Sport Performance
Williams, C., & Rollo, I. (2015) · Sports Medicine · doi:10.1007/s40279-015-0399-3 · Cited by 175
Cited by
Sorted by citations
Items 101–107 of 107
La dieta chetogenica nella preservazione della massa muscolare
Falbo, E., Conte, C., Barrea, L., & Tarsitano, M. G. (2023) · L Endocrinologo · doi:10.1007/s40619-023-01236-3
Exercise and sports performance
Zinn, C., Harvey, C., Noakes, T. D., Smith, J. A. H., Webster, C. C., & Sáenz, C. (2023) · Elsevier eBooks · doi:10.1016/b978-0-12-821617-0.00013-9
HISTORY OF ESTABLISHMENT AND CURRENT STATUS OF DOCTRINE ON KETO DIET
Куйбіда, В., Коханець, П., & Lopatynska, V. V. (2024) · History of Science and Biographical Studies · doi:10.31073/istnauka202401-03
A avaliação do perfil nutricional de praticantes de Crossfit
de Gusmão, K. W. M. V., Ribeiro, Y. T. S., & de Almeida, S. G. (2024) · Research Society and Development · doi:10.33448/rsd-v13i12.47607
Ketogenic Diet: Physical Performance and Metabolic Health of Athletes
Kaur, T. J., & Grewal, R. (2024) · Design science and innovation · doi:10.1007/978-981-97-7804-1_8
Effect of Ketogenic Diet on Selected Cardiometabolic-Related Diseases
Ogbonnaya, F. C., & Shokunbi, O. S. (2025) · Baghdad Journal of Biochemistry and Applied Biological Sciences · doi:10.47419/bjbabs.v6i02.287
Schlegel, P., & Bozděch, M. (2026) · Journal of Kinesiology and Exercise Sciences · doi:10.5604/01.3001.0055.9064
Metadata
- Authors
- Kephart, W., Pledge, C., Roberson, P., Mumford, P., Romero, M., Mobley, C., Martin, J., Young, K., Lowery, R., Wilson, J., Huggins, K., & Roberts, M.
- Affiliations
- University of Wisconsin–Whitewater (US)
- Auburn University (US)
- Applied Sports Performance Institute, Tampa, FL 33607, USA
- Corresponding author
- Roberts, Michael
- ORCID
- Venue
- Sports
- Publisher
- MDPI AG
- Published
- 2018-01-09
- Volume
- 6
- Issue
- 1
- Pages
- 1
- ISSN
- 2075-4663 (ISSN-L)
- PMC
- PMC5969192
- OpenAlex
- W2783047285
- Cited by
- 107
- References
- 26
- Citations by year
- 2026: 2 · 2025: 7 · 2024: 13 · 2023: 9 · 2022: 13 · 2021: 23 · 2020: 17 · 2019: 20 · 2018: 3
- FWCI
- 10.83
- Type
- journal article
- Language
- en
- Open access
- gold
- doi.org
- Licence
- Locations
- Sports (publishedVersion, cc-by)
- Europe PMC (PubMed Central) (publishedVersion, other-oa)
- PubMed Central (publishedVersion, cc-by)
- PubMed (publishedVersion)
- DOAJ (DOAJ: Directory of Open Access Journals) (submittedVersion, cc-by-sa)
- Topics
- Health Sciences › Medicine › Physiology (medical) › Diet and metabolism studies
- Health Sciences › Nursing › Nutrition and Dietetics › Muscle metabolism and nutrition
- Health Sciences › Medicine › Physiology (medical) › Dietary Effects on Health
- Keywords
- ketogenic diet, CrossFit, body composition, fat mass, lean body mass, beta-hydroxybutyrate, nutritional ketosis, resistance training, anaerobic performance, cardiorespiratory fitness, resting energy expenditure, LDL cholesterol, triglycerides, fat oxidation, muscle glycogen, recreational athletes, dietary fat intake
About these checks
Registry, retraction, Cites and statistics results are computed, not judged, with one exception: a printed reference that no index lists is read once by a model before it counts as a citation error. Claims are extracted by a model and kept only when their quote appears verbatim in the text; each cited source is then checked, with a model’s help, for whether it says what the claim relies on. Those verdicts can be wrong — read the claim’s quote and the cited source before relying on one.
Statistics and arithmetic are recomputed, not judged.
Confidence bands are shown only for fields calibrated on our annotated test set. None is calibrated yet, so no band is shown.
What counts as a claim ›How we measure confidence ›How we check this ›
Are you an author, or do you see a problem with this page? Request a review
